Work and Jobs in Pittsburgh, Pennsylvania (PA) Detailed Stats
Occupations, Industries, Unemployment, Workers, Commute
Settings
X


Recent posts about work in Pittsburgh, Pennsylvania on our local forum with over 2,400,000 registered users:

Latest news about work in Pittsburgh, PA collected exclusively by city-data.com from local newspapers, TV, and radio stations
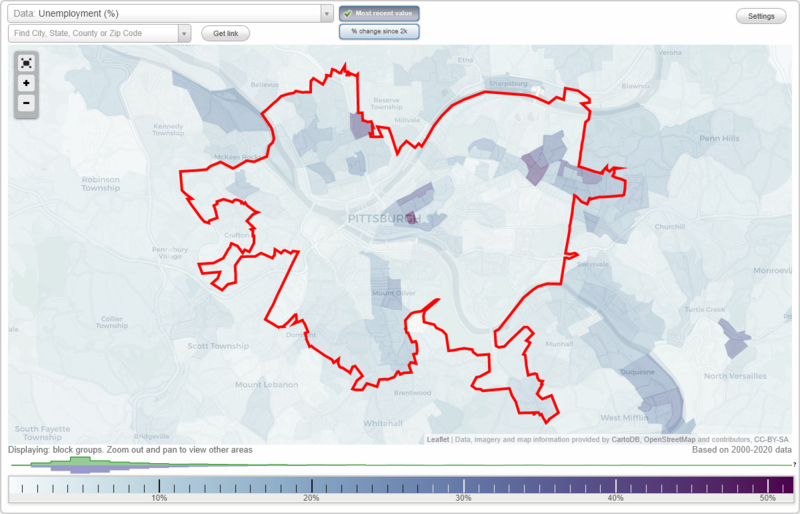
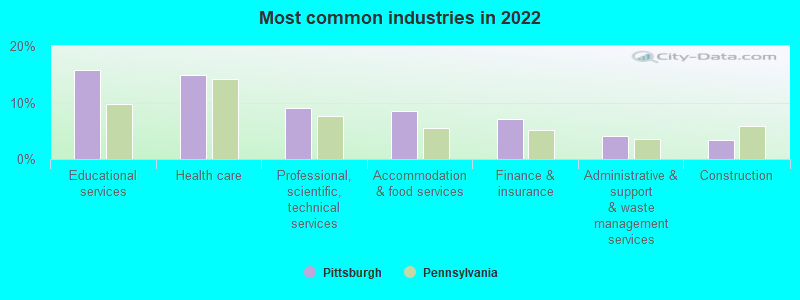
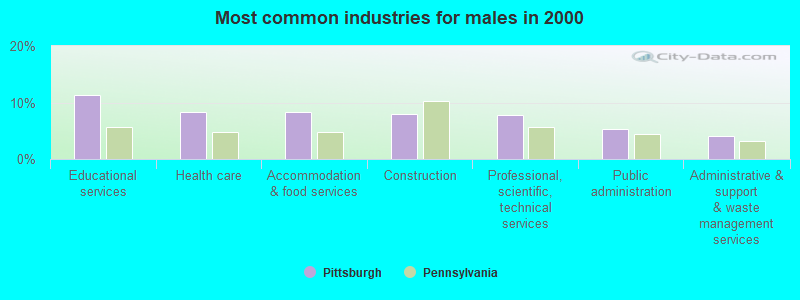
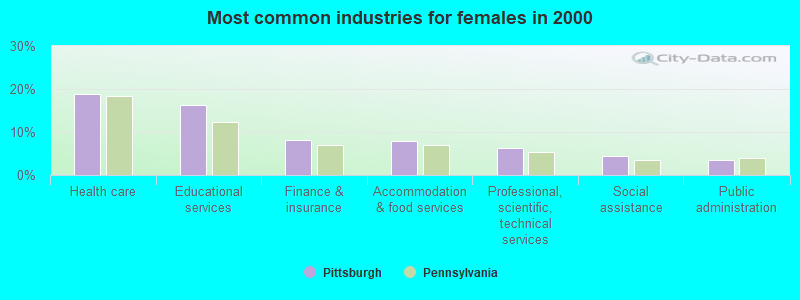
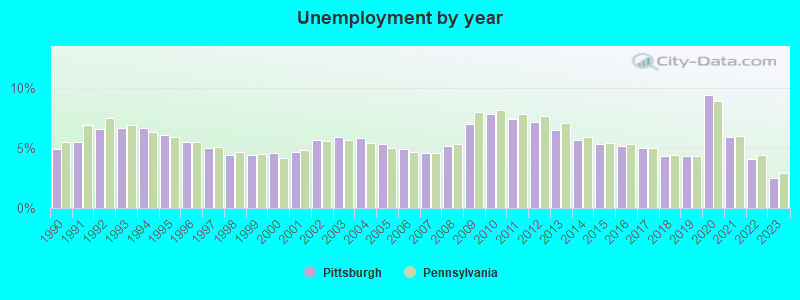
The unemployment rate in 2023 in Pittsburgh, PA was 2.5%, which was 16.0% less than the unemployment rate of 2.9% across the entire state of Pennsylvania. Compared to the unemployment rate of 6.5% in 2013, this represents a decrease of 160.0%. According to 2022 data, the most common industries in Pittsburgh are: Educational services (15.8% of civilian employees), Health care (14.8% of civilian employees), Professional, scientific, technical services (9.0% of civilian employees). 95.6% of workers work in Allegheny County and 22.9% of all workers work at home. 58.9% of workers are employees of private companies, which is 15.0% less than the rate of 67.7% across the entire state of Pennsylvania.
Whole page based on the data from 2000 / 2022 when the population of Pittsburgh, Pennsylvania was 334,563 / 302,905
Whole page based on the data from 2000 / 2022 when the population of Pittsburgh, Pennsylvania was 334,563 / 302,905
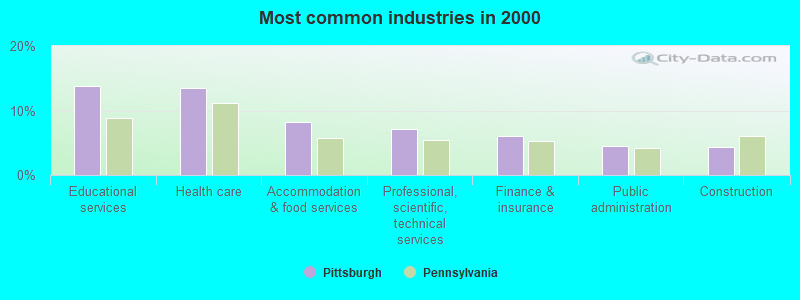
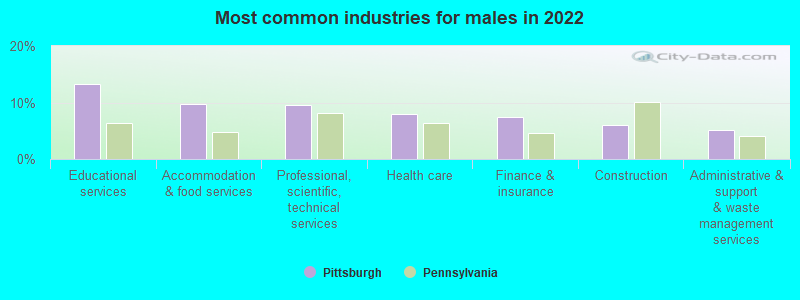
Most common industries

Most common industries | Most common industries | |||||
|---|---|---|---|---|---|---|
Industry | All | Males | Females | All | Males | Females |
| Educational services | 15.8% (25,309) | 13.2% (10,931) | 18.5% (14,378) | 13.8% (19,907) | 11.3% (8,249) | 16.2% (11,658) |
| Health care | 14.8% (23,832) | 8.0% (6,649) | 22.1% (17,183) | 13.5% (19,613) | 8.4% (6,088) | 18.8% (13,525) |
| Professional, scientific, and technical services | 9.0% (14,512) | 9.5% (7,888) | 8.5% (6,624) | 7.1% (10,303) | 7.8% (5,712) | 6.4% (4,591) |
| Accommodation and food services | 8.5% (13,653) | 9.7% (8,040) | 7.2% (5,613) | 8.2% (11,816) | 8.3% (6,053) | 8.0% (5,763) |
| Finance and insurance | 7.1% (11,464) | 7.4% (6,149) | 6.8% (5,315) | 6.0% (8,642) | 3.8% (2,733) | 8.2% (5,909) |
| Administrative and support and waste management services | 4.1% (6,546) | 5.1% (4,197) | 3.0% (2,349) | 3.8% (5,448) | 4.2% (3,024) | 3.4% (2,424) |
| Construction | 3.4% (5,516) | 6.0% (4,968) | 0.7% (548) | 4.3% (6,185) | 8.0% (5,825) | 0.5% (360) |
| Public administration | 3.4% (5,433) | 4.0% (3,300) | 2.7% (2,133) | 4.5% (6,509) | 5.4% (3,928) | 3.6% (2,581) |
| Social assistance | 3.0% (4,792) | 1.7% (1,371) | 4.4% (3,421) | 2.6% (3,799) | 0.9% (627) | 4.4% (3,172) |
| Arts, entertainment, and recreation | 2.7% (4,394) | 2.5% (2,054) | 3.0% (2,340) | 2.2% (3,177) | 2.4% (1,727) | 2.0% (1,450) |
| Religious, grantmaking, civic, professional, and similar organizations | 2.4% (3,844) | 1.9% (1,547) | 3.0% (2,297) | 2.1% (3,102) | 1.8% (1,290) | 2.5% (1,812) |
| Food and beverage stores | 2.3% (3,729) | 3.0% (2,485) | 1.6% (1,244) | 2.7% (3,903) | 2.4% (1,758) | 3.0% (2,145) |
| Real estate and rental and leasing | 1.6% (2,649) | 2.2% (1,860) | 1.0% (789) | 2.0% (2,878) | 2.2% (1,634) | 1.7% (1,244) |
| Personal and laundry services | 1.4% (2,171) | 1.1% (938) | 1.6% (1,233) | 1.8% (2,627) | 1.5% (1,105) | 2.1% (1,522) |
| Other transportation, and support activities, and couriers | 1.1% (1,737) | 1.4% (1,133) | 0.8% (604) | 1.7% (2,464) | 2.5% (1,854) | 0.8% (610) |
| Publishing, and motion picture and sound recording industries | 1.0% (1,654) | 1.0% (869) | 1.0% (785) | 1.0% (1,388) | 1.1% (808) | 0.8% (580) |
| Pharmacies and drug stores | 1.0% (1,645) | 0.9% (745) | 1.2% (900) | 0.8% (1,158) | 0.7% (476) | 0.9% (682) |
| Broadcasting and telecommunications | 0.9% (1,474) | 1.0% (858) | 0.8% (616) | 1.6% (2,257) | 1.4% (1,031) | 1.7% (1,226) |
| Clothing and accessories, including shoe, stores | 0.7% (1,190) | 0.4% (369) | 1.1% (821) | 0.7% (941) | 0.5% (331) | 0.8% (610) |
| Miscellaneous manufacturing | 0.7% (1,162) | 1.2% (1,011) | 0.2% (151) | 0.7% (1,063) | 1.1% (790) | 0.4% (273) |
| Building material and garden equipment and supplies dealers | 0.7% (1,131) | 1.1% (871) | 0.3% (260) | 0.5% (677) | 0.6% (461) | 0.3% (216) |
| Department and other general merchandise stores | 0.7% (1,127) | 0.8% (657) | 0.6% (470) | 1.2% (1,778) | 0.8% (591) | 1.6% (1,187) |
| Repair and maintenance | 0.6% (1,029) | 1.2% (954) | 0.1% (75) | 0.8% (1,211) | 1.5% (1,096) | 0.2% (115) |
| Groceries and related products merchant wholesalers | 0.6% (1,021) | 0.8% (643) | 0.5% (378) | 0.4% (637) | 0.7% (509) | 0.2% (128) |
| Used merchandise, gift, novelty, and souvenir, and other miscellaneous stores | 0.6% (1,005) | 0.9% (709) | 0.4% (296) | 0.6% (811) | 0.4% (291) | 0.7% (520) |
| Computer and electronic products | 0.6% (971) | 0.7% (563) | 0.5% (408) | 0.5% (715) | 0.7% (528) | 0.3% (187) |
| Electronic shopping and mail-order houses | 0.5% (845) | 0.2% (201) | 0.8% (644) | 0.2% (292) | 0.2% (148) | 0.2% (144) |
| Metal and metal products | 0.5% (829) | 0.8% (681) | 0.2% (148) | 1.3% (1,825) | 1.9% (1,400) | 0.6% (425) |
| Utilities | 0.5% (825) | 0.7% (560) | 0.3% (265) | 0.6% (933) | 0.9% (657) | 0.4% (276) |
| Machinery | 0.5% (786) | 0.5% (431) | 0.5% (355) | 0.3% (480) | 0.5% (367) | 0.2% (113) |
| Chemicals | 0.5% (764) | 0.6% (482) | 0.4% (282) | 0.5% (684) | 0.6% (407) | 0.4% (277) |
| U. S. Postal service | 0.5% (760) | 0.7% (598) | 0.2% (162) | 1.0% (1,420) | 1.2% (869) | 0.8% (551) |
| Food | 0.4% (717) | 0.3% (225) | 0.6% (492) | 0.8% (1,132) | 0.9% (638) | 0.7% (494) |
| Mining, quarrying, and oil and gas extraction | 0.4% (638) | 0.6% (489) | 0.2% (149) | 0.1% (97) | 0.1% (51) | 0.1% (46) |
| Radio, TV, and computer stores | 0.4% (638) | 0.6% (459) | 0.2% (179) | 0.5% (751) | 0.7% (538) | 0.3% (213) |
| Sporting goods, camera, and hobby and toy stores | 0.4% (632) | 0.1% (53) | 0.7% (579) | 0.2% (340) | 0.3% (189) | 0.2% (151) |
| Health and personal care, except drug, stores | 0.4% (613) | 0.2% (196) | 0.5% (417) | 0.2% (310) | 0.2% (114) | 0.3% (196) |
| Gasoline stations | 0.4% (612) | 0.4% (367) | 0.3% (245) | 0.3% (370) | 0.3% (230) | 0.2% (140) |
| Data processing, libraries, and other information services | 0.4% (592) | 0.4% (362) | 0.3% (230) | 0.9% (1,289) | 0.8% (596) | 1.0% (693) |
| Private households | 0.3% (552) | 0.2% (201) | 0.5% (351) | 0.4% (549) | 0.1% (59) | 0.7% (490) |
| Motor vehicle and parts dealers | 0.3% (512) | 0.6% (483) | 0.0% (29) | 0.7% (998) | 1.2% (899) | 0.1% (99) |
| Nonmetallic mineral products | 0.3% (494) | 0.4% (362) | 0.2% (132) | 0.2% (353) | 0.4% (294) | 0.1% (59) |
| Professional and commercial equipment and supplies merchant wholesalers | 0.3% (458) | 0.4% (366) | 0.1% (92) | 0.3% (465) | 0.5% (334) | 0.2% (131) |
| Printing and related support activities | 0.3% (438) | 0.5% (390) | 0.1% (48) | 0.5% (726) | 0.7% (531) | 0.3% (195) |
| Transportation equipment | 0.3% (434) | 0.5% (404) | 0.0% (30) | 0.3% (383) | 0.4% (324) | 0.1% (59) |
| Furniture and home furnishings, and household appliance stores | 0.3% (417) | 0.2% (151) | 0.3% (266) | 0.4% (594) | 0.5% (370) | 0.3% (224) |
| Electrical equipment, appliances, and components | 0.3% (405) | 0.3% (277) | 0.2% (128) | 0.2% (271) | 0.2% (148) | 0.2% (123) |
| Rail transportation | 0.2% (378) | 0.5% (378) | 0.0% (0) | 0.1% (196) | 0.2% (181) | 0.0% (15) |
| Electrical and electronic goods merchant wholesalers | 0.2% (332) | 0.2% (191) | 0.2% (141) | 0.3% (384) | 0.4% (298) | 0.1% (86) |
| Other direct selling establishments | 0.2% (321) | 0.3% (273) | 0.1% (48) | 0.6% (818) | 0.6% (409) | 0.6% (409) |
| Air transportation | 0.2% (312) | 0.1% (54) | 0.3% (258) | 0.4% (521) | 0.4% (273) | 0.3% (248) |
| Warehousing and storage | 0.2% (306) | 0.2% (154) | 0.2% (152) | 0.2% (261) | 0.3% (201) | 0.1% (60) |
| Truck transportation | 0.2% (305) | 0.4% (305) | 0.0% (0) | 0.6% (894) | 1.1% (798) | 0.1% (96) |
| Agriculture, forestry, fishing and hunting | 0.2% (300) | 0.4% (300) | 0.0% (0) | 0.1% (168) | 0.1% (97) | 0.1% (71) |
| Beverage and tobacco products | 0.2% (270) | 0.3% (270) | 0.0% (0) | 0.1% (129) | 0.2% (120) | 0.0% (9) |
| Hardware, plumbing and heating equipment, and supplies merchant wholesalers | 0.1% (221) | 0.1% (61) | 0.2% (160) | 0.1% (121) | 0.1% (92) | 0.0% (29) |
| Recyclable material merchant wholesalers | 0.1% (202) | 0.1% (121) | 0.1% (81) | 0.1% (117) | 0.1% (94) | 0.0% (23) |
| Textile mills and textile products | 0.1% (174) | 0.2% (174) | 0.0% (0) | 0.1% (124) | 0.1% (74) | 0.1% (50) |
| Apparel, fabrics, and notions merchant wholesalers | 0.1% (172) | 0.1% (82) | 0.1% (90) | 0.0% (49) | 0.0% (33) | 0.0% (16) |
| Machinery, equipment, and supplies merchant wholesalers | 0.1% (168) | 0.2% (168) | 0.0% (0) | 0.1% (200) | 0.2% (171) | 0.0% (29) |
| Miscellaneous nondurable goods merchant wholesalers | 0.1% (159) | 0.1% (121) | 0.0% (38) | 0.2% (313) | 0.3% (222) | 0.1% (91) |
| Plastics and rubber products | 0.1% (143) | 0.1% (99) | 0.1% (44) | 0.2% (265) | 0.2% (175) | 0.1% (90) |
| Wood products | 0.1% (134) | 0.2% (134) | 0.0% (0) | 0.1% (75) | 0.1% (53) | 0.0% (22) |
| Retail florists | 0.1% (110) | 0.1% (84) | 0.0% (26) | 0.2% (264) | 0.2% (116) | 0.2% (148) |
| Drugs, sundries, and chemical and allied products merchant wholesalers | 0.1% (109) | 0.1% (109) | 0.0% (0) | 0.1% (170) | 0.2% (122) | 0.1% (48) |
| Paper and paper products merchant wholesalers | 0.1% (103) | 0.1% (103) | 0.0% (0) | 0.1% (79) | 0.1% (65) | 0.0% (14) |
| Book stores and news dealers | 0.0% (34) | 0.0% (0) | 0.0% (34) | 0.2% (271) | 0.2% (112) | 0.2% (159) |
| Management of companies and enterprises | 0.0% (29) | 0.0% (29) | 0.0% (0) | 0.2% (262) | 0.2% (141) | 0.2% (121) |
| Paper | 0.0% (23) | 0.0% (23) | 0.0% (0) | 0.1% (129) | 0.2% (114) | 0.0% (15) |
| Furniture and related product manufacturing | 0.0% (0) | 0.0% (0) | 0.0% (0) | 0.2% (336) | 0.3% (238) | 0.1% (98) |
| Motor vehicles, parts and supplies merchant wholesalers | 0.0% (0) | 0.0% (0) | 0.0% (0) | 0.1% (96) | 0.1% (84) | 0.0% (12) |
| Furniture and home furnishing merchant wholesalers | 0.0% (0) | 0.0% (0) | 0.0% (0) | 0.1% (101) | 0.1% (86) | 0.0% (15) |
| Lumber and other construction materials merchant wholesalers | 0.0% (0) | 0.0% (0) | 0.0% (0) | 0.1% (117) | 0.1% (89) | 0.0% (28) |
| Office supplies and stationery stores | 0.0% (0) | 0.0% (0) | 0.0% (0) | 0.1% (170) | 0.2% (123) | 0.1% (47) |
| Music stores | 0.0% (0) | 0.0% (0) | 0.0% (0) | 0.1% (216) | 0.2% (134) | 0.1% (82) |
Unemployment in Pittsburgh
- Unemployment by race in 2022
- Unemployment rate for White non-Hispanic residents
- 5.2%Males
- 3.6%Females
- Unemployment rate for Black residents
- 8.9%Males
- 9.7%Females
- Unemployment rate for American Indian and Alaska Native residents
- 29.1%Males
- 1.2%Females
- Unemployment rate for Asian residents
- 1.5%Males
- 2.8%Females
- Unemployment rate for other race residents
- 4.9%Males
- 2.2%Females
- Unemployment rate for two or more race residents
- 7.6%Males
- 10.2%Females
- Unemployment rate for Hispanic or Latino residents
- 6.7%Males
- 2.8%Females
- Unemployment by race in 2000
- Unemployment rate for White non-Hispanic residents
- 7.8%Males
- 7.5%Females
- Unemployment rate for Black residents
- 17.5%Males
- 14.4%Females
- Unemployment rate for American Indian and Alaska Native residents
- 23.7%Males
- 31.0%Females
- Unemployment rate for Asian residents
- 15.6%Males
- 17.4%Females
- Unemployment rate for other race residents
- 37.5%Males
- 33.3%Females
- Unemployment rate for two or more race residents
- 17.2%Males
- 14.9%Females
- Unemployment rate for Hispanic or Latino residents
- 15.9%Males
- 8.4%Females
Unemployment in 2023:
| Pittsburgh: | 2.5% |
| Pennsylvania: | 2.9% |
Unemployment in 2022:
| Pittsburgh: | 4.1% |
| Pennsylvania: | 4.4% |
Unemployment in 2021:
| Pittsburgh: | 5.9% |
| Pennsylvania: | 6.0% |
Unemployment in 2020:
| Pittsburgh: | 9.4% |
| Pennsylvania: | 8.9% |
Unemployment in 2019:
| Pittsburgh: | 4.3% |
| Pennsylvania: | 4.3% |
Unemployment in 2018:
| Pittsburgh: | 4.3% |
| Pennsylvania: | 4.4% |
Unemployment in 2017:
| Pittsburgh: | 5.0% |
| Pennsylvania: | 5.0% |
Unemployment in 2016:
| Pittsburgh: | 5.2% |
| Pennsylvania: | 5.3% |
Unemployment in 2015:
| Pittsburgh: | 5.3% |
| Pennsylvania: | 5.4% |
Unemployment in 2014:
| Pittsburgh: | 5.7% |
| Pennsylvania: | 5.9% |
Unemployment in 2013:
| Pittsburgh: | 6.5% |
| Pennsylvania: | 7.1% |
Unemployment in 2012:
| Pittsburgh: | 7.2% |
| Pennsylvania: | 7.7% |
Unemployment in 2011:
| Pittsburgh: | 7.4% |
| Pennsylvania: | 7.8% |
Unemployment in 2010:
| Pittsburgh: | 7.8% |
| Pennsylvania: | 8.2% |
Unemployment in 2009:
| Pittsburgh: | 7.0% |
| Pennsylvania: | 8.0% |
Unemployment in 2008:
| Pittsburgh: | 5.2% |
| Pennsylvania: | 5.3% |
Unemployment in 2007:
| Pittsburgh: | 4.6% |
| Pennsylvania: | 4.6% |
Unemployment in 2006:
| Pittsburgh: | 4.9% |
| Pennsylvania: | 4.7% |
Unemployment in 2005:
| Pittsburgh: | 5.3% |
| Pennsylvania: | 5.0% |
Unemployment in 2004:
| Pittsburgh: | 5.8% |
| Pennsylvania: | 5.4% |
Unemployment in 2003:
| Pittsburgh: | 5.9% |
| Pennsylvania: | 5.7% |
Unemployment in 2002:
| Pittsburgh: | 5.7% |
| Pennsylvania: | 5.6% |
Unemployment in 2001:
| Pittsburgh: | 4.7% |
| Pennsylvania: | 4.8% |
Unemployment in 2000:
| Pittsburgh: | 4.6% |
| Pennsylvania: | 4.2% |
Unemployment in 1999:
| Pittsburgh: | 4.4% |
| Pennsylvania: | 4.5% |
Unemployment in 1998:
| Pittsburgh: | 4.4% |
| Pennsylvania: | 4.7% |
Unemployment in 1997:
| Pittsburgh: | 5.0% |
| Pennsylvania: | 5.1% |
Unemployment in 1996:
| Pittsburgh: | 5.5% |
| Pennsylvania: | 5.5% |
Unemployment in 1995:
| Pittsburgh: | 6.1% |
| Pennsylvania: | 5.9% |
Unemployment in 1994:
| Pittsburgh: | 6.7% |
| Pennsylvania: | 6.3% |
Unemployment in 1993:
| Pittsburgh: | 6.7% |
| Pennsylvania: | 6.9% |
Unemployment in 1992:
| Pittsburgh: | 6.6% |
| Pennsylvania: | 7.5% |
Unemployment in 1991:
| Pittsburgh: | 5.5% |
| Pennsylvania: | 6.9% |
Unemployment in 1990:
| Pittsburgh: | 4.9% |
| Pennsylvania: | 5.5% |
Time leaving home to go to work
12:00 a.m. to 4:59 a.m.:
| Pittsburgh: | 3.7% (4,426) |
| Pennsylvania: | 5.2% (278,903) |
5:00 a.m. to 5:29 a.m.:
| Pittsburgh: | 1.6% (1,905) |
| Pennsylvania: | 3.9% (210,362) |
5:30 a.m. to 5:59 a.m.:
| Pittsburgh: | 2.9% (3,492) |
| Pennsylvania: | 5.1% (274,242) |
6:00 a.m. to 6:29 a.m.:
| Pittsburgh: | 5.0% (6,012) |
| Pennsylvania: | 9.0% (480,402) |
6:30 a.m. to 6:59 a.m.:
| Pittsburgh: | 9.1% (11,018) |
| Pennsylvania: | 10.0% (532,059) |
7:00 a.m. to 7:29 a.m.:
| Pittsburgh: | 11.3% (13,648) |
| Pennsylvania: | 13.6% (726,980) |
7:30 a.m. to 7:59 a.m.:
| Pittsburgh: | 12.2% (14,701) |
| Pennsylvania: | 11.5% (611,627) |
8:00 a.m. to 8:29 a.m.:
| Pittsburgh: | 12.9% (15,598) |
| Pennsylvania: | 11.0% (585,665) |
8:30 a.m. to 8:59 a.m.:
| Pittsburgh: | 6.9% (8,390) |
| Pennsylvania: | 5.7% (302,857) |
9:00 a.m. to 9:59 a.m.:
| Pittsburgh: | 10.9% (13,204) |
| Pennsylvania: | 6.1% (324,576) |
10:00 a.m. to 10:59 a.m.:
| Pittsburgh: | 5.3% (6,383) |
| Pennsylvania: | 2.7% (146,376) |
11:00 a.m. to 11:59 a.m.:
| Pittsburgh: | 2.1% (2,550) |
| Pennsylvania: | 1.4% (75,840) |
12:00 p.m. to 3:59 p.m.:
| Pittsburgh: | 9.3% (11,231) |
| Pennsylvania: | 7.6% (407,255) |
4:00 p.m. to 11:59 p.m.:
| Pittsburgh: | 6.9% (8,292) |
| Pennsylvania: | 6.9% (369,524) |
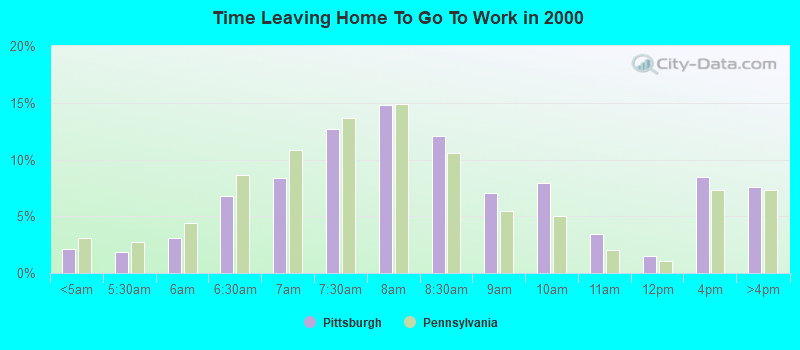
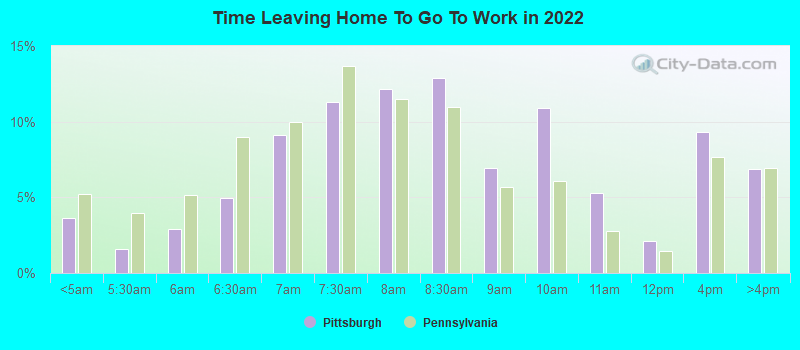
<5am:
| Pittsburgh: | 2.1% (2,967) |
| Pennsylvania: | 3.1% (172,304) |
5:30am:
| Pittsburgh: | 1.8% (2,589) |
| Pennsylvania: | 2.7% (150,168) |
6am:
| Pittsburgh: | 3.1% (4,347) |
| Pennsylvania: | 4.4% (245,004) |
6:30am:
| Pittsburgh: | 6.8% (9,588) |
| Pennsylvania: | 8.6% (478,636) |
7am:
| Pittsburgh: | 8.4% (11,919) |
| Pennsylvania: | 10.8% (599,808) |
7:30am:
| Pittsburgh: | 12.7% (17,987) |
| Pennsylvania: | 13.7% (759,372) |
8am:
| Pittsburgh: | 14.8% (20,976) |
| Pennsylvania: | 14.9% (826,968) |
8:30am:
| Pittsburgh: | 12.1% (17,132) |
| Pennsylvania: | 10.6% (588,440) |
9am:
| Pittsburgh: | 7.0% (9,964) |
| Pennsylvania: | 5.5% (304,765) |
10am:
| Pittsburgh: | 7.9% (11,190) |
| Pennsylvania: | 5.1% (280,812) |
11am:
| Pittsburgh: | 3.5% (4,921) |
| Pennsylvania: | 2.1% (114,676) |
12pm:
| Pittsburgh: | 1.5% (2,145) |
| Pennsylvania: | 1.0% (57,867) |
4pm:
| Pittsburgh: | 8.5% (12,026) |
| Pennsylvania: | 7.3% (404,775) |
>4pm:
| Pittsburgh: | 7.6% (10,734) |
| Pennsylvania: | 7.3% (408,070) |
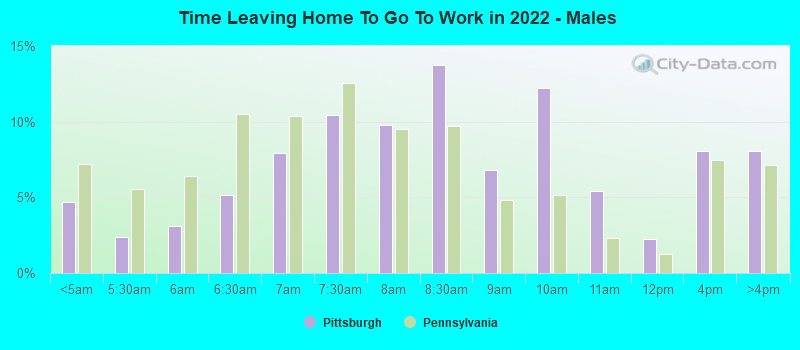
12:00 a.m. to 4:59 a.m. - Males:
| Pittsburgh: | 4.7% (2,915) |
| Pennsylvania: | 7.2% (203,028) |
5:00 a.m. to 5:29 a.m. - Males:
| Pittsburgh: | 2.4% (1,495) |
| Pennsylvania: | 5.6% (157,829) |
5:30 a.m. to 5:59 a.m. - Males:
| Pittsburgh: | 3.1% (1,931) |
| Pennsylvania: | 6.4% (180,791) |
6:00 a.m. to 6:29 a.m. - Males:
| Pittsburgh: | 5.1% (3,201) |
| Pennsylvania: | 10.5% (296,669) |
6:30 a.m. to 6:59 a.m. - Males:
| Pittsburgh: | 7.9% (4,939) |
| Pennsylvania: | 10.4% (293,727) |
7:00 a.m. to 7:29 a.m. - Males:
| Pittsburgh: | 10.4% (6,478) |
| Pennsylvania: | 12.6% (356,257) |
7:30 a.m. to 7:59 a.m. - Males:
| Pittsburgh: | 9.8% (6,075) |
| Pennsylvania: | 9.5% (268,895) |
8:00 a.m. to 8:29 a.m. - Males:
| Pittsburgh: | 13.7% (8,550) |
| Pennsylvania: | 9.7% (274,966) |
8:30 a.m. to 8:59 a.m. - Males:
| Pittsburgh: | 6.8% (4,246) |
| Pennsylvania: | 4.9% (137,370) |
9:00 a.m. to 9:59 a.m. - Males:
| Pittsburgh: | 12.2% (7,598) |
| Pennsylvania: | 5.1% (145,545) |
10:00 a.m. to 10:59 a.m. - Males:
| Pittsburgh: | 5.4% (3,355) |
| Pennsylvania: | 2.3% (66,088) |
11:00 a.m. to 11:59 a.m. - Males:
| Pittsburgh: | 2.2% (1,390) |
| Pennsylvania: | 1.3% (36,091) |
12:00 p.m. to 3:59 p.m. - Males:
| Pittsburgh: | 8.1% (5,025) |
| Pennsylvania: | 7.4% (210,601) |
4:00 p.m. to 11:59 p.m. - Males:
| Pittsburgh: | 8.1% (5,027) |
| Pennsylvania: | 7.1% (202,203) |
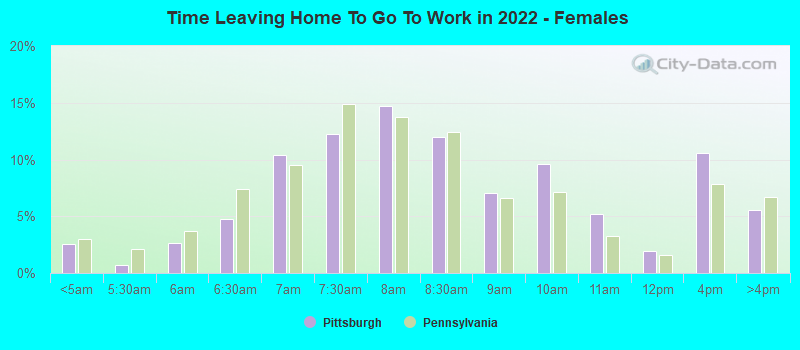
12:00 a.m. to 4:59 a.m. - Females:
| Pittsburgh: | 2.6% (1,511) |
| Pennsylvania: | 3.0% (75,875) |
5:00 a.m. to 5:29 a.m. - Females:
| Pittsburgh: | 0.7% (410) |
| Pennsylvania: | 2.1% (52,533) |
5:30 a.m. to 5:59 a.m. - Females:
| Pittsburgh: | 2.7% (1,561) |
| Pennsylvania: | 3.7% (93,451) |
6:00 a.m. to 6:29 a.m. - Females:
| Pittsburgh: | 4.8% (2,811) |
| Pennsylvania: | 7.4% (183,733) |
6:30 a.m. to 6:59 a.m. - Females:
| Pittsburgh: | 10.4% (6,079) |
| Pennsylvania: | 9.5% (238,332) |
7:00 a.m. to 7:29 a.m. - Females:
| Pittsburgh: | 12.2% (7,170) |
| Pennsylvania: | 14.8% (370,723) |
7:30 a.m. to 7:59 a.m. - Females:
| Pittsburgh: | 14.7% (8,626) |
| Pennsylvania: | 13.7% (342,732) |
8:00 a.m. to 8:29 a.m. - Females:
| Pittsburgh: | 12.0% (7,048) |
| Pennsylvania: | 12.4% (310,699) |
8:30 a.m. to 8:59 a.m. - Females:
| Pittsburgh: | 7.1% (4,144) |
| Pennsylvania: | 6.6% (165,487) |
9:00 a.m. to 9:59 a.m. - Females:
| Pittsburgh: | 9.6% (5,606) |
| Pennsylvania: | 7.2% (179,031) |
10:00 a.m. to 10:59 a.m. - Females:
| Pittsburgh: | 5.2% (3,028) |
| Pennsylvania: | 3.2% (80,288) |
11:00 a.m. to 11:59 a.m. - Females:
| Pittsburgh: | 2.0% (1,160) |
| Pennsylvania: | 1.6% (39,749) |
12:00 p.m. to 3:59 p.m. - Females:
| Pittsburgh: | 10.6% (6,206) |
| Pennsylvania: | 7.9% (196,654) |
4:00 p.m. to 11:59 p.m. - Females:
| Pittsburgh: | 5.6% (3,265) |
| Pennsylvania: | 6.7% (167,321) |
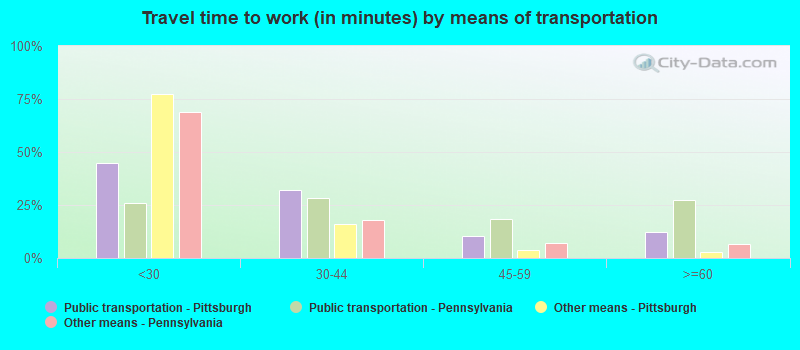
Travel time to work
Percentage of workers working in this county: 95.6%
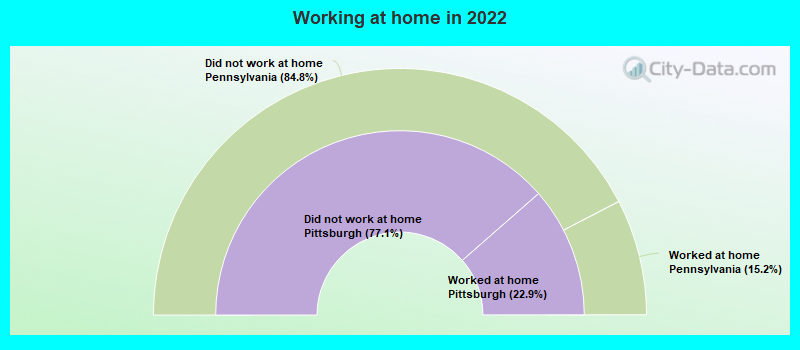
Number of people working at home: 35,888 (22.9% of all workers)
Daytime population change due to commuting: +138,191 (+41.3%)
Workers who live and work in this city: 98,005 (69.1%)
Number of people working at home: 35,888 (22.9% of all workers)
Daytime population change due to commuting: +138,191 (+41.3%)
Workers who live and work in this city: 98,005 (69.1%)
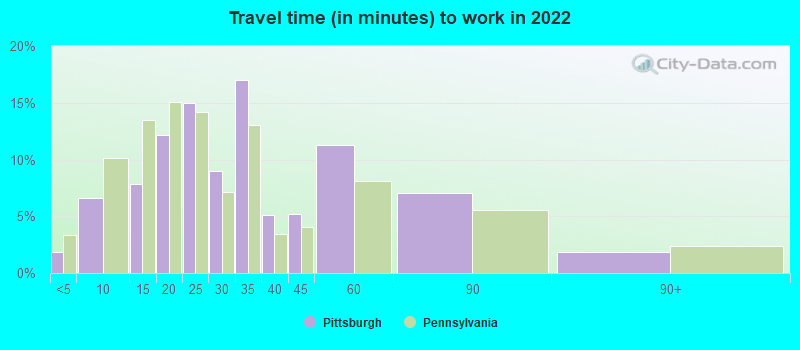
Less than 5 minutes:
| Pittsburgh: | 1.9% (4,454) |
| Pennsylvania: | 3.3% (176,091) |
5 to 9 minutes:
| Pittsburgh: | 6.6% (15,627) |
| Pennsylvania: | 10.2% (536,363) |
10 to 14 minutes:
| Pittsburgh: | 7.8% (18,507) |
| Pennsylvania: | 13.4% (709,149) |
15 to 19 minutes:
| Pittsburgh: | 12.2% (28,869) |
| Pennsylvania: | 15.1% (795,392) |
20 to 24 minutes:
| Pittsburgh: | 14.9% (35,348) |
| Pennsylvania: | 14.2% (750,120) |
25 to 29 minutes:
| Pittsburgh: | 9.0% (21,220) |
| Pennsylvania: | 7.1% (376,011) |
30 to 34 minutes:
| Pittsburgh: | 17.0% (40,338) |
| Pennsylvania: | 13.1% (689,933) |
35 to 39 minutes:
| Pittsburgh: | 5.1% (12,000) |
| Pennsylvania: | 3.4% (181,099) |
40 to 44 minutes:
| Pittsburgh: | 5.2% (12,404) |
| Pennsylvania: | 4.0% (211,803) |
45 to 59 minutes:
| Pittsburgh: | 11.3% (26,676) |
| Pennsylvania: | 8.1% (429,639) |
60 to 89 minutes:
| Pittsburgh: | 7.1% (16,740) |
| Pennsylvania: | 5.5% (292,390) |
90 or more minutes:
| Pittsburgh: | 1.9% (4,455) |
| Pennsylvania: | 2.4% (127,300) |
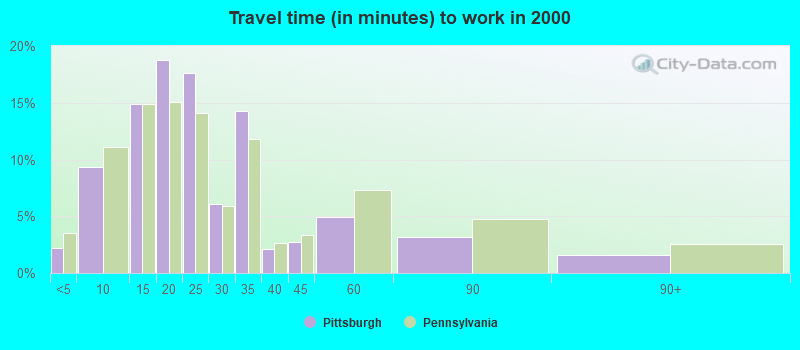
Less than 5 minutes:
| Pittsburgh: | 2.2% (3,087) |
| Pennsylvania: | 3.5% (196,492) |
5 to 9 minutes:
| Pittsburgh: | 9.4% (13,265) |
| Pennsylvania: | 11.1% (615,919) |
10 to 14 minutes:
| Pittsburgh: | 14.9% (21,152) |
| Pennsylvania: | 14.9% (825,199) |
15 to 19 minutes:
| Pittsburgh: | 18.8% (26,612) |
| Pennsylvania: | 15.0% (836,006) |
20 to 24 minutes:
| Pittsburgh: | 17.6% (24,953) |
| Pennsylvania: | 14.1% (782,790) |
25 to 29 minutes:
| Pittsburgh: | 6.1% (8,626) |
| Pennsylvania: | 5.9% (327,459) |
30 to 34 minutes:
| Pittsburgh: | 14.3% (20,286) |
| Pennsylvania: | 11.8% (655,811) |
35 to 39 minutes:
| Pittsburgh: | 2.1% (2,970) |
| Pennsylvania: | 2.7% (148,906) |
40 to 44 minutes:
| Pittsburgh: | 2.7% (3,832) |
| Pennsylvania: | 3.4% (187,483) |
45 to 59 minutes:
| Pittsburgh: | 4.9% (7,016) |
| Pennsylvania: | 7.3% (407,516) |
60 to 89 minutes:
| Pittsburgh: | 3.2% (4,479) |
| Pennsylvania: | 4.8% (265,759) |
90 or more minutes:
| Pittsburgh: | 1.6% (2,207) |
| Pennsylvania: | 2.6% (142,325) |
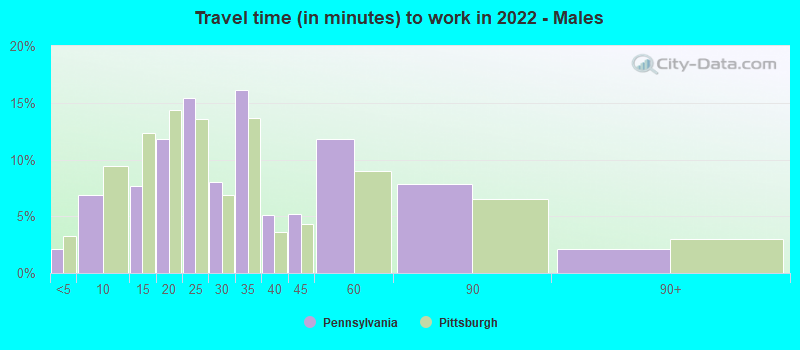
Less than 5 minutes - Males:
| Pittsburgh: | 2.1% (2,511) |
| Pennsylvania: | 3.2% (90,117) |
5 to 9 minutes - Males:
| Pittsburgh: | 6.9% (8,272) |
| Pennsylvania: | 9.4% (263,803) |
10 to 14 minutes - Males:
| Pittsburgh: | 7.7% (9,181) |
| Pennsylvania: | 12.3% (344,337) |
15 to 19 minutes - Males:
| Pittsburgh: | 11.8% (14,122) |
| Pennsylvania: | 14.4% (402,062) |
20 to 24 minutes - Males:
| Pittsburgh: | 15.4% (18,502) |
| Pennsylvania: | 13.6% (380,953) |
25 to 29 minutes - Males:
| Pittsburgh: | 8.0% (9,601) |
| Pennsylvania: | 6.9% (193,555) |
30 to 34 minutes - Males:
| Pittsburgh: | 16.1% (19,327) |
| Pennsylvania: | 13.7% (383,132) |
35 to 39 minutes - Males:
| Pittsburgh: | 5.1% (6,168) |
| Pennsylvania: | 3.6% (102,122) |
40 to 44 minutes - Males:
| Pittsburgh: | 5.2% (6,190) |
| Pennsylvania: | 4.3% (120,376) |
45 to 59 minutes - Males:
| Pittsburgh: | 11.8% (14,127) |
| Pennsylvania: | 9.0% (251,766) |
60 to 89 minutes - Males:
| Pittsburgh: | 7.8% (9,386) |
| Pennsylvania: | 6.5% (183,289) |
90 or more minutes - Males:
| Pittsburgh: | 2.1% (2,497) |
| Pennsylvania: | 3.0% (85,115) |
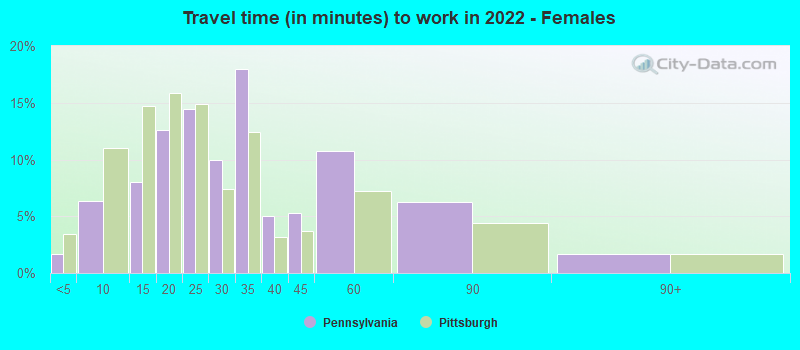
Less than 5 minutes - Females:
| Pittsburgh: | 1.7% (1,943) |
| Pennsylvania: | 3.5% (85,974) |
5 to 9 minutes - Females:
| Pittsburgh: | 6.3% (7,355) |
| Pennsylvania: | 11.0% (272,560) |
10 to 14 minutes - Females:
| Pittsburgh: | 8.0% (9,326) |
| Pennsylvania: | 14.7% (364,812) |
15 to 19 minutes - Females:
| Pittsburgh: | 12.6% (14,747) |
| Pennsylvania: | 15.9% (393,330) |
20 to 24 minutes - Females:
| Pittsburgh: | 14.4% (16,846) |
| Pennsylvania: | 14.9% (369,167) |
25 to 29 minutes - Females:
| Pittsburgh: | 10.0% (11,619) |
| Pennsylvania: | 7.4% (182,456) |
30 to 34 minutes - Females:
| Pittsburgh: | 18.0% (21,011) |
| Pennsylvania: | 12.4% (306,801) |
35 to 39 minutes - Females:
| Pittsburgh: | 5.0% (5,832) |
| Pennsylvania: | 3.2% (78,977) |
40 to 44 minutes - Females:
| Pittsburgh: | 5.3% (6,214) |
| Pennsylvania: | 3.7% (91,427) |
45 to 59 minutes - Females:
| Pittsburgh: | 10.7% (12,549) |
| Pennsylvania: | 7.2% (177,873) |
60 to 89 minutes - Females:
| Pittsburgh: | 6.3% (7,354) |
| Pennsylvania: | 4.4% (109,101) |
90 or more minutes - Females:
| Pittsburgh: | 1.7% (1,958) |
| Pennsylvania: | 1.7% (42,185) |
Means of transportation to work
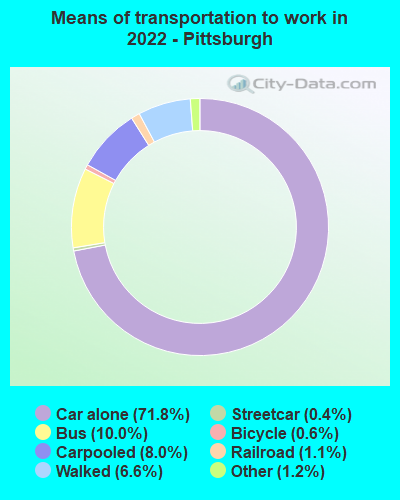
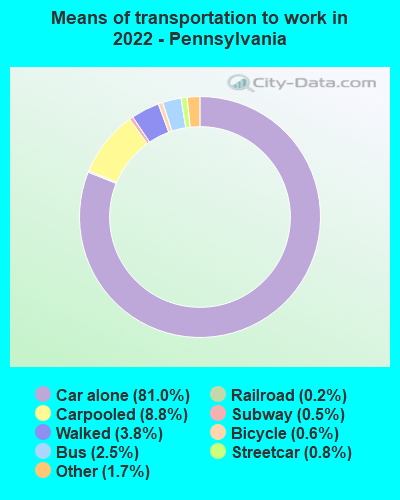
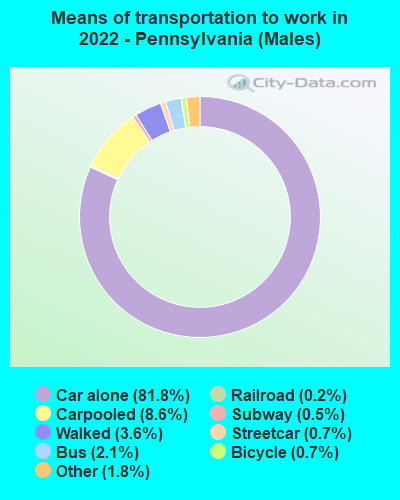
Drove car alone:
| Pittsburgh: | 71.8% (169,897) |
| Pennsylvania: | 81.0% (1,982,533) |
Carpooled:
| Pittsburgh: | 8.0% (19,049) |
| Pennsylvania: | 8.8% (224,687) |
Bus:
| Pittsburgh: | 10.0% (23,761) |
| Pennsylvania: | 2.5% (70,902) |
Subway or elevated rail:
| Pittsburgh: | 0.4% (1,030) |
| Pennsylvania: | 0.8% (23,171) |
Light rail, streetcar or trolley:
| Pittsburgh: | 1.1% (2,703) |
| Pennsylvania: | 0.2% (6,258) |
Ferryboat:
| Pittsburgh: | 0.0% (70) |
| Pennsylvania: | 0.0% (312) |
Bicycle:
| Pittsburgh: | 0.6% (1,516) |
| Pennsylvania: | 0.6% (11,632) |
Walked:
| Pittsburgh: | 6.6% (15,735) |
| Pennsylvania: | 3.8% (101,672) |
Other means:
| Pittsburgh: | 1.2% (2,877) |
| Pennsylvania: | 1.7% (40,804) |
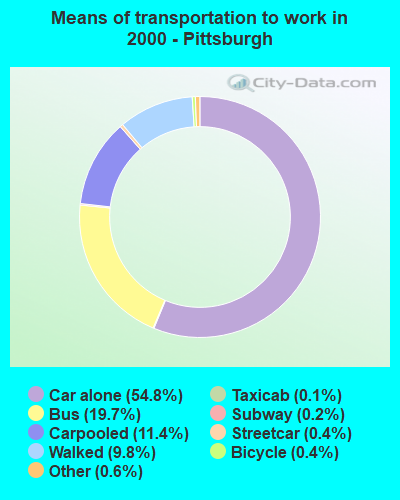

Drove car alone:
| Pittsburgh: | 54.8% (77,787) |
| Pennsylvania: | 76.5% (4,247,836) |
Carpooled:
| Pittsburgh: | 11.4% (16,131) |
| Pennsylvania: | 10.4% (577,364) |
Bus or trolley bus:
| Pittsburgh: | 19.7% (27,984) |
| Pennsylvania: | 3.6% (198,036) |
Streetcar or trolley car:
| Pittsburgh: | 0.4% (611) |
| Pennsylvania: | 0.1% (8,214) |
Subway or elevated:
| Pittsburgh: | 0.2% (260) |
| Pennsylvania: | 0.6% (34,724) |
Railroad:
| Pittsburgh: | 0.0% (15) |
| Pennsylvania: | 0.8% (43,455) |
Ferryboat:
| Pittsburgh: | 0.0% (32) |
| Pennsylvania: | 0.0% (400) |
Taxicab:
| Pittsburgh: | 0.1% (160) |
| Pennsylvania: | 0.1% (4,870) |
Motorcycle:
| Pittsburgh: | 0.1% (126) |
| Pennsylvania: | 0.1% (3,235) |
Bicycle:
| Pittsburgh: | 0.4% (627) |
| Pennsylvania: | 0.3% (14,001) |
Walked:
| Pittsburgh: | 9.8% (13,870) |
| Pennsylvania: | 4.1% (229,725) |
Other means:
| Pittsburgh: | 0.6% (882) |
| Pennsylvania: | 0.5% (29,805) |
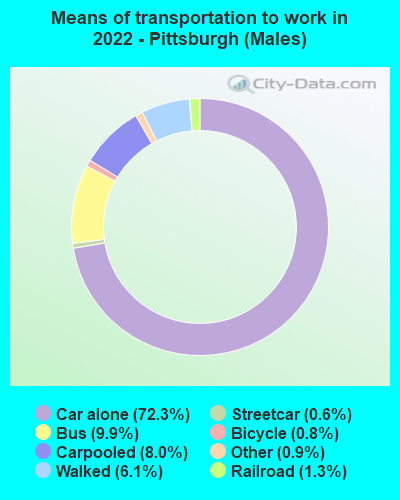
Drove car alone - Males:
| Pittsburgh: | 72.3% (86,707) |
| Pennsylvania: | 81.8% (1,982,533) |
Carpooled - Males:
| Pittsburgh: | 8.0% (9,597) |
| Pennsylvania: | 8.6% (224,687) |
Bus - Males:
| Pittsburgh: | 9.9% (11,920) |
| Pennsylvania: | 2.1% (70,902) |
Subway or elevated rail - Males:
| Pittsburgh: | 0.6% (698) |
| Pennsylvania: | 0.7% (23,171) |
Light rail, streetcar or trolley - Males:
| Pittsburgh: | 1.3% (1,587) |
| Pennsylvania: | 0.2% (6,258) |
Ferryboat - Males:
| Pittsburgh: | 0.1% (70) |
| Pennsylvania: | 0.0% (312) |
Bicycle - Males:
| Pittsburgh: | 0.8% (987) |
| Pennsylvania: | 0.7% (11,632) |
Walked - Males:
| Pittsburgh: | 6.1% (7,270) |
| Pennsylvania: | 3.6% (101,672) |
Other means - Males:
| Pittsburgh: | 0.9% (1,048) |
| Pennsylvania: | 1.8% (40,804) |
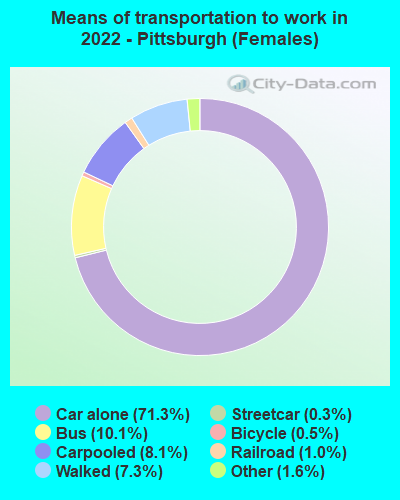
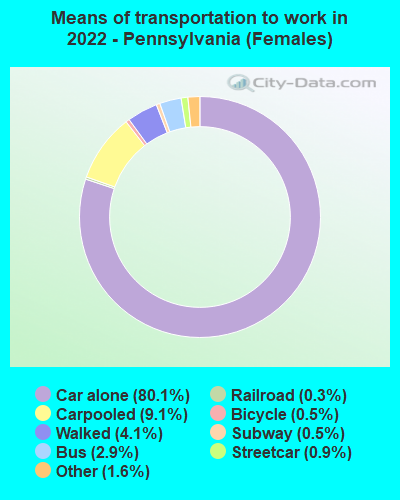
Drove car alone - Females:
| Pittsburgh: | 71.3% (83,190) |
| Pennsylvania: | 80.1% (1,982,533) |
Carpooled - Females:
| Pittsburgh: | 8.1% (9,452) |
| Pennsylvania: | 9.1% (224,687) |
Bus - Females:
| Pittsburgh: | 10.1% (11,841) |
| Pennsylvania: | 2.9% (70,902) |
Subway or elevated rail - Females:
| Pittsburgh: | 0.3% (332) |
| Pennsylvania: | 0.9% (23,171) |
Light rail, streetcar or trolley - Females:
| Pittsburgh: | 1.0% (1,116) |
| Pennsylvania: | 0.3% (6,258) |
Bicycle - Females:
| Pittsburgh: | 0.5% (529) |
| Pennsylvania: | 0.5% (11,632) |
Walked - Females:
| Pittsburgh: | 7.3% (8,465) |
| Pennsylvania: | 4.1% (101,672) |
Other means - Females:
| Pittsburgh: | 1.6% (1,829) |
| Pennsylvania: | 1.6% (40,804) |
Private vehicle occupancy
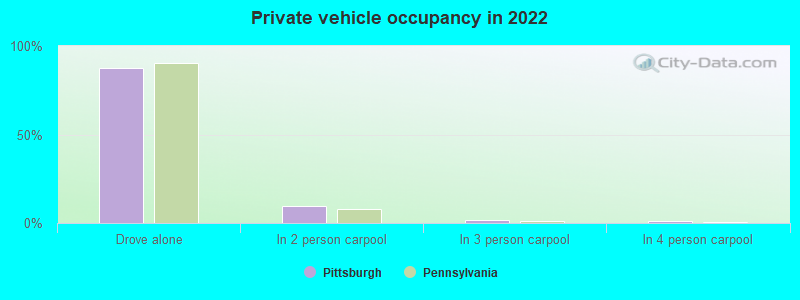
Drove alone:
| Pittsburgh: | 87.5% (74,291) |
| Pennsylvania: | 90.2% (4,322,003) |
In 2 person carpool:
| Pittsburgh: | 9.8% (8,292) |
| Pennsylvania: | 7.7% (367,639) |
In 3 person carpool:
| Pittsburgh: | 1.6% (1,379) |
| Pennsylvania: | 1.2% (57,942) |
In 4 person carpool:
| Pittsburgh: | 0.9% (801) |
| Pennsylvania: | 0.5% (23,156) |
In 5-6 person carpool:
| Pittsburgh: | 0.1% (90) |
| Pennsylvania: | 0.3% (13,205) |
In 7+ person carpool:
| Pittsburgh: | 0.0% (13) |
| Pennsylvania: | 0.1% (7,065) |
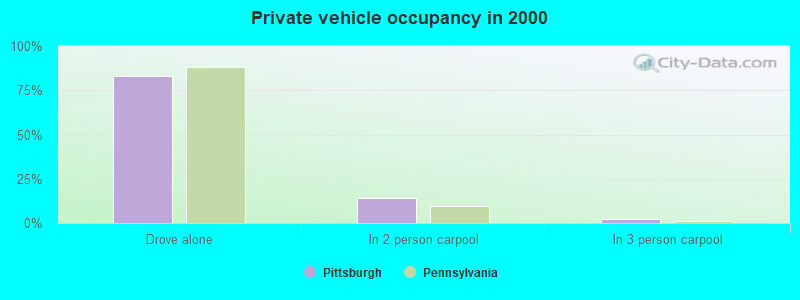
Drove alone:
| Pittsburgh: | 82.8% (77,787) |
| Pennsylvania: | 88.0% (4,247,836) |
In 2 person carpool:
| Pittsburgh: | 14.3% (13,473) |
| Pennsylvania: | 9.7% (470,174) |
In 3 person carpool:
| Pittsburgh: | 2.0% (1,880) |
| Pennsylvania: | 1.4% (67,610) |
In 4 person carpool:
| Pittsburgh: | 0.6% (553) |
| Pennsylvania: | 0.5% (22,718) |
In 5-6 person carpool:
| Pittsburgh: | 0.1% (133) |
| Pennsylvania: | 0.2% (9,833) |
In 7+ person carpool:
| Pittsburgh: | 0.1% (92) |
| Pennsylvania: | 0.1% (7,029) |
Class of workers
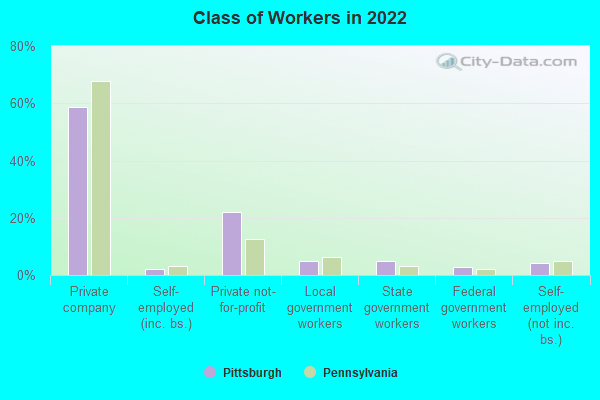
Employee of private company:
| Pittsburgh: | 58.9% (94,179) |
| Pennsylvania: | 67.7% (4,333,849) |
Self-employed in own incorporated business:
| Pittsburgh: | 2.1% (3,332) |
| Pennsylvania: | 3.2% (202,029) |
Private not-for-profit wage and salary workers:
| Pittsburgh: | 22.2% (35,447) |
| Pennsylvania: | 12.7% (810,562) |
Local government workers:
| Pittsburgh: | 4.8% (7,715) |
| Pennsylvania: | 6.2% (397,120) |
State government workers:
| Pittsburgh: | 5.0% (8,015) |
| Pennsylvania: | 3.0% (193,490) |
Federal government workers:
| Pittsburgh: | 2.8% (4,421) |
| Pennsylvania: | 2.1% (136,008) |
Self-employed workers in own not incorporated business:
| Pittsburgh: | 4.2% (6,747) |
| Pennsylvania: | 5.0% (318,118) |
Unpaid family workers:
| Pittsburgh: | 0.1% (158) |
| Pennsylvania: | 0.2% (11,066) |
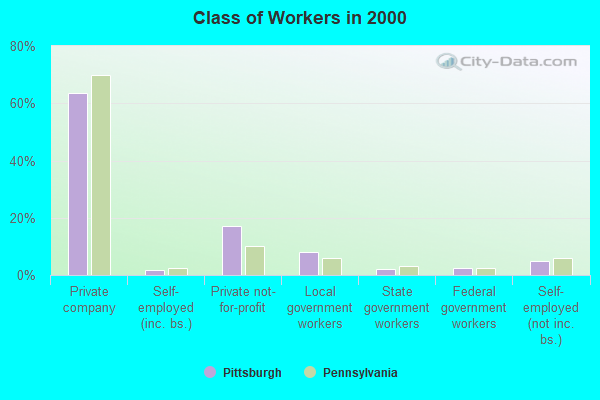
Employee of private company:
| Pittsburgh: | 63.6% (92,009) |
| Pennsylvania: | 69.7% (3,942,119) |
Self-employed in own incorporated business:
| Pittsburgh: | 1.8% (2,641) |
| Pennsylvania: | 2.4% (134,871) |
Private not-for-profit wage and salary workers:
| Pittsburgh: | 17.2% (24,875) |
| Pennsylvania: | 10.3% (580,382) |
Local government workers:
| Pittsburgh: | 8.1% (11,726) |
| Pennsylvania: | 5.8% (326,222) |
State government workers:
| Pittsburgh: | 2.0% (2,830) |
| Pennsylvania: | 3.2% (182,232) |
Federal government workers:
| Pittsburgh: | 2.5% (3,571) |
| Pennsylvania: | 2.3% (130,634) |
Self-employed workers in own not incorporated business:
| Pittsburgh: | 4.8% (6,887) |
| Pennsylvania: | 6.0% (339,631) |
Unpaid family workers:
| Pittsburgh: | 0.2% (229) |
| Pennsylvania: | 0.3% (17,409) |
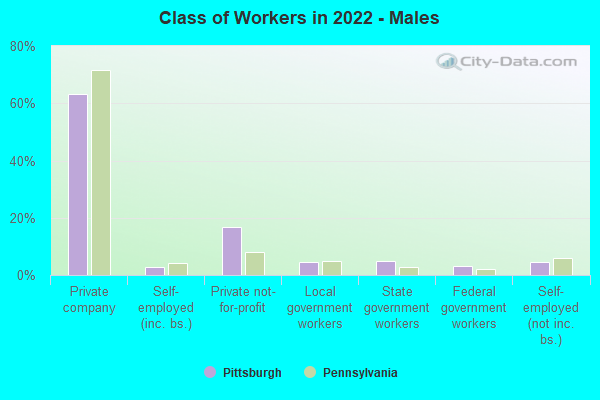
Employee of private company - Males:
| Pittsburgh: | 63.3% (51,319) |
| Pennsylvania: | 71.5% (2,388,579) |
Self-employed in own incorporated business - Males:
| Pittsburgh: | 2.8% (2,244) |
| Pennsylvania: | 4.0% (134,437) |
Private not-for-profit wage and salary workers - Males:
| Pittsburgh: | 16.8% (13,643) |
| Pennsylvania: | 8.1% (270,498) |
Local government workers - Males:
| Pittsburgh: | 4.6% (3,727) |
| Pennsylvania: | 5.0% (168,310) |
State government workers - Males:
| Pittsburgh: | 4.9% (3,997) |
| Pennsylvania: | 2.9% (97,540) |
Federal government workers - Males:
| Pittsburgh: | 3.1% (2,555) |
| Pennsylvania: | 2.2% (75,158) |
Self-employed workers in own not incorporated business - Males:
| Pittsburgh: | 4.5% (3,646) |
| Pennsylvania: | 6.0% (199,421) |
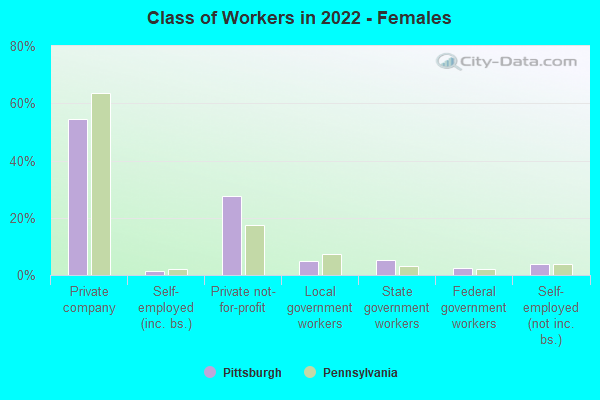
Employee of private company - Females:
| Pittsburgh: | 54.3% (42,860) |
| Pennsylvania: | 63.5% (1,945,270) |
Self-employed in own incorporated business - Females:
| Pittsburgh: | 1.4% (1,088) |
| Pennsylvania: | 2.2% (67,592) |
Private not-for-profit wage and salary workers - Females:
| Pittsburgh: | 27.6% (21,804) |
| Pennsylvania: | 17.6% (540,064) |
Local government workers - Females:
| Pittsburgh: | 5.1% (3,988) |
| Pennsylvania: | 7.5% (228,810) |
State government workers - Females:
| Pittsburgh: | 5.1% (4,018) |
| Pennsylvania: | 3.1% (95,950) |
Federal government workers - Females:
| Pittsburgh: | 2.4% (1,866) |
| Pennsylvania: | 2.0% (60,850) |
Self-employed workers in own not incorporated business - Females:
| Pittsburgh: | 3.9% (3,101) |
| Pennsylvania: | 3.9% (118,697) |
Unpaid family workers - Females:
| Pittsburgh: | 0.2% (158) |
| Pennsylvania: | 0.1% (4,362) |