Work and Jobs in Richfield, Minnesota (MN) Detailed Stats
Occupations, Industries, Unemployment, Workers, Commute
Settings
X


Recent posts about work in Richfield, Minnesota on our local forum with over 2,400,000 registered users:
 | Jobs in MN (77 replies) |
| Working at Best Buy HQ (10 replies) |
| Where to buy a house- Richfield? (16 replies) |
| Where are the jobs? (12 replies) |
| Twin Cities Median House Prices hit 280k (23 replies) |
| What is the best high school for an incoming freshman that wants to play Varsity basketball? (32 replies) |
Latest news about work in Richfield, MN collected exclusively by city-data.com from local newspapers, TV, and radio stations
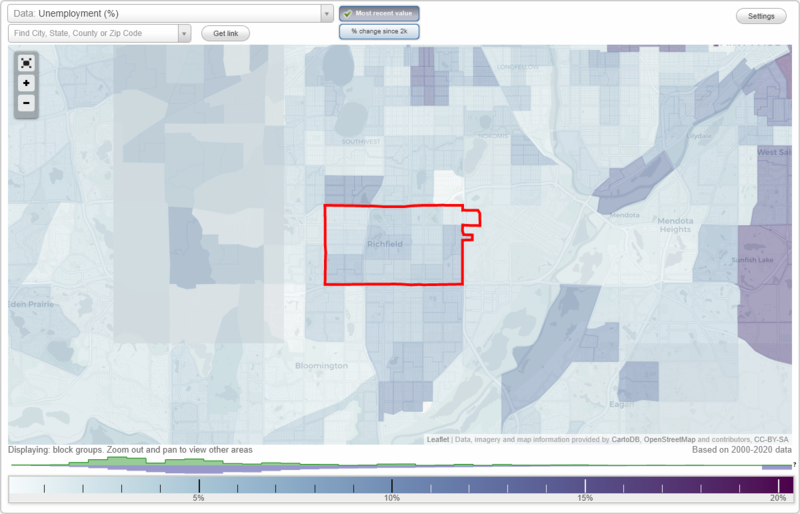
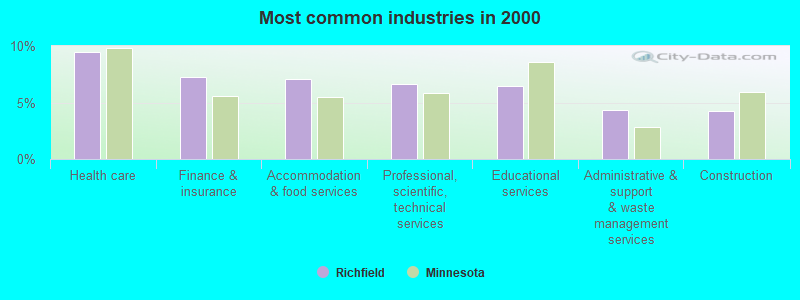
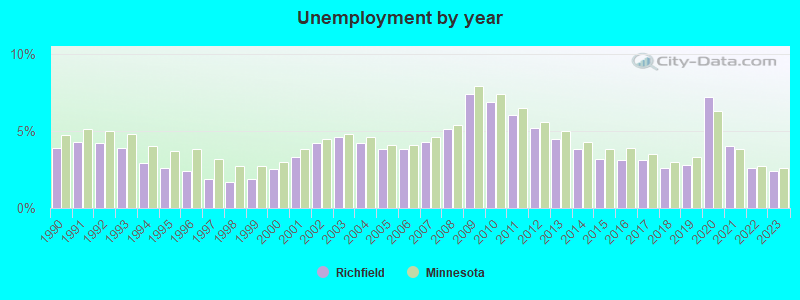
The unemployment rate in 2023 in Richfield, MN was 2.4%, which was 8.3% less than the unemployment rate of 2.6% across the entire state of Minnesota. Compared to the unemployment rate of 4.5% in 2013, this represents a decrease of 87.5%. The most common industries in Richfield are: Health care (9.5% of civilian employees), Finance & insurance (7.3% of civilian employees), Accommodation & food services (7.1% of civilian employees). 78.3% of workers work in Hennepin County and 13.3% of all workers work at home. 73.4% of workers are employees of private companies, which is 10.3% greater than the rate of 65.9% across the entire state of Minnesota.
Whole page based on the data from 2000 / 2022 when the population of Richfield, Minnesota was 34,439 / 36,500
Whole page based on the data from 2000 / 2022 when the population of Richfield, Minnesota was 34,439 / 36,500
Most common industries
Most common industries | |||
|---|---|---|---|
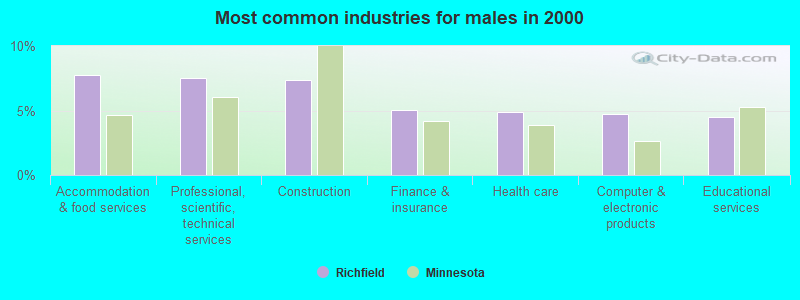
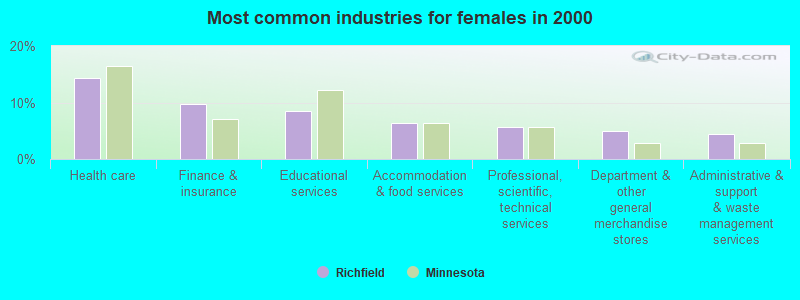
Industry | All | Males | Females |
| Health care | 9.5% (1,841) | 4.9% (492) | 14.4% (1,349) |
| Finance and insurance | 7.3% (1,416) | 5.0% (504) | 9.7% (912) |
| Accommodation and food services | 7.1% (1,385) | 7.8% (782) | 6.4% (603) |
| Professional, scientific, and technical services | 6.7% (1,298) | 7.5% (758) | 5.8% (540) |
| Educational services | 6.4% (1,251) | 4.5% (454) | 8.5% (797) |
| Administrative and support and waste management services | 4.4% (849) | 4.3% (437) | 4.4% (412) |
| Construction | 4.3% (827) | 7.3% (737) | 1.0% (90) |
| Department and other general merchandise stores | 3.5% (684) | 2.1% (212) | 5.0% (472) |
| Computer and electronic products | 3.5% (682) | 4.7% (472) | 2.2% (210) |
| Public administration | 2.7% (522) | 2.6% (261) | 2.8% (261) |
| Social assistance | 2.5% (483) | 0.8% (78) | 4.3% (405) |
| Food and beverage stores | 2.3% (445) | 2.4% (238) | 2.2% (207) |
| Air transportation | 2.3% (443) | 2.6% (261) | 1.9% (182) |
| Real estate and rental and leasing | 1.9% (367) | 2.1% (210) | 1.7% (157) |
| Religious, grantmaking, civic, professional, and similar organizations | 1.8% (348) | 1.7% (174) | 1.9% (174) |
| Repair and maintenance | 1.8% (341) | 2.6% (261) | 0.9% (80) |
| Other transportation, and support activities, and couriers | 1.6% (315) | 2.5% (247) | 0.7% (68) |
| Radio, TV, and computer stores | 1.5% (300) | 2.1% (216) | 0.9% (84) |
| Miscellaneous manufacturing | 1.5% (300) | 2.0% (198) | 1.1% (102) |
| Publishing, and motion picture and sound recording industries | 1.5% (283) | 1.4% (145) | 1.5% (138) |
| Printing and related support activities | 1.4% (275) | 2.0% (198) | 0.8% (77) |
| Personal and laundry services | 1.4% (273) | 1.1% (107) | 1.8% (166) |
| Arts, entertainment, and recreation | 1.3% (255) | 1.6% (163) | 1.0% (92) |
| Broadcasting and telecommunications | 1.1% (209) | 1.3% (134) | 0.8% (75) |
| Machinery | 1.1% (208) | 1.7% (169) | 0.4% (39) |
| Motor vehicle and parts dealers | 1.0% (191) | 1.5% (150) | 0.4% (41) |
| Building material and garden equipment and supplies dealers | 0.9% (170) | 1.0% (101) | 0.7% (69) |
| Used merchandise, gift, novelty, and souvenir, and other miscellaneous stores | 0.8% (162) | 0.5% (49) | 1.2% (113) |
| Groceries and related products merchant wholesalers | 0.8% (155) | 0.7% (75) | 0.9% (80) |
| U. S. Postal service | 0.8% (148) | 0.8% (76) | 0.8% (72) |
| Truck transportation | 0.8% (148) | 0.9% (88) | 0.6% (60) |
| Metal and metal products | 0.8% (147) | 1.2% (122) | 0.3% (25) |
| Clothing and accessories, including shoe, stores | 0.8% (147) | 0.2% (21) | 1.3% (126) |
| Sporting goods, camera, and hobby and toy stores | 0.7% (139) | 0.9% (88) | 0.5% (51) |
| Food | 0.7% (131) | 0.6% (56) | 0.8% (75) |
| Plastics and rubber products | 0.6% (123) | 1.0% (104) | 0.2% (19) |
| Data processing, libraries, and other information services | 0.6% (123) | 0.5% (50) | 0.8% (73) |
| Professional and commercial equipment and supplies merchant wholesalers | 0.6% (109) | 0.9% (88) | 0.2% (21) |
| Furniture and home furnishings, and household appliance stores | 0.5% (103) | 0.7% (71) | 0.3% (32) |
| Other direct selling establishments | 0.5% (102) | 0.5% (47) | 0.6% (55) |
| Machinery, equipment, and supplies merchant wholesalers | 0.5% (93) | 0.6% (59) | 0.4% (34) |
| Chemicals | 0.5% (88) | 0.7% (69) | 0.2% (19) |
| Pharmacies and drug stores | 0.4% (83) | 0.1% (12) | 0.8% (71) |
| Management of companies and enterprises | 0.4% (77) | 0.2% (18) | 0.6% (59) |
| Transportation equipment | 0.4% (72) | 0.4% (45) | 0.3% (27) |
| Paper | 0.4% (71) | 0.6% (56) | 0.2% (15) |
| Furniture and related product manufacturing | 0.3% (68) | 0.5% (48) | 0.2% (20) |
| Hardware, plumbing and heating equipment, and supplies merchant wholesalers | 0.3% (67) | 0.5% (47) | 0.2% (20) |
| Retail florists | 0.3% (66) | 0.1% (13) | 0.6% (53) |
| Utilities | 0.3% (60) | 0.6% (60) | 0.0% (0) |
| Gasoline stations | 0.3% (58) | 0.3% (35) | 0.2% (23) |
| Private households | 0.3% (56) | 0.0% (0) | 0.6% (56) |
| Miscellaneous nondurable goods merchant wholesalers | 0.3% (55) | 0.2% (19) | 0.4% (36) |
| Electronic shopping and mail-order houses | 0.3% (54) | 0.2% (24) | 0.3% (30) |
| Nonmetallic mineral products | 0.3% (54) | 0.4% (41) | 0.1% (13) |
| Electrical and electronic goods merchant wholesalers | 0.3% (53) | 0.4% (39) | 0.1% (14) |
| Health and personal care, except drug, stores | 0.3% (53) | 0.0% (0) | 0.6% (53) |
| Drugs, sundries, and chemical and allied products merchant wholesalers | 0.3% (53) | 0.4% (40) | 0.1% (13) |
| Paper and paper products merchant wholesalers | 0.3% (51) | 0.4% (41) | 0.1% (10) |
| Agriculture, forestry, fishing and hunting | 0.2% (46) | 0.2% (22) | 0.3% (24) |
| Alcoholic beverages merchant wholesalers | 0.2% (44) | 0.3% (35) | 0.1% (9) |
| Electrical equipment, appliances, and components | 0.2% (39) | 0.3% (30) | 0.1% (9) |
| Rail transportation | 0.2% (36) | 0.4% (36) | 0.0% (0) |
| Textile mills and textile products | 0.2% (34) | 0.0% (5) | 0.3% (29) |
| Book stores and news dealers | 0.2% (33) | 0.1% (13) | 0.2% (20) |
| Miscellaneous durable goods merchant wholesalers | 0.2% (30) | 0.1% (9) | 0.2% (21) |
| Motor vehicles, parts and supplies merchant wholesalers | 0.2% (30) | 0.2% (20) | 0.1% (10) |
| Wood products | 0.2% (30) | 0.2% (23) | 0.1% (7) |
| Warehousing and storage | 0.1% (26) | 0.1% (13) | 0.1% (13) |
| Office supplies and stationery stores | 0.1% (21) | 0.0% (5) | 0.2% (16) |
| Music stores | 0.1% (20) | 0.1% (6) | 0.1% (14) |
| Beverage and tobacco products | 0.1% (17) | 0.2% (17) | 0.0% (0) |
| Vending machine operators | 0.1% (16) | 0.2% (16) | 0.0% (0) |
| Furniture and home furnishing merchant wholesalers | 0.1% (13) | 0.1% (13) | 0.0% (0) |
Unemployment in Richfield
- Unemployment by race in 2022
- Unemployment rate for White non-Hispanic residents
- 2.2%Males
- 2.5%Females
- Unemployment rate for Black residents
- 4.6%Males
- 14.9%Females
- Unemployment rate for American Indian and Alaska Native residents
- 65.2%Females
- Unemployment rate for Asian residents
- 1.8%Males
- 4.6%Females
- Unemployment rate for other race residents
- 3.5%Males
- 10.5%Females
- Unemployment rate for two or more race residents
- 8.2%Males
- 1.3%Females
- Unemployment rate for Hispanic or Latino residents
- 2.7%Males
- 5.3%Females
- Unemployment by race in 2000
- Unemployment rate for White non-Hispanic residents
- 2.5%Males
- 1.8%Females
- Unemployment rate for Black residents
- 11.4%Males
- 4.8%Females
- Unemployment rate for American Indian and Alaska Native residents
- 12.7%Males
- 18.4%Females
- Unemployment rate for Asian residents
- 6.5%Males
- 1.6%Females
- Unemployment rate for other race residents
- 4.8%Males
- 5.1%Females
- Unemployment rate for two or more race residents
- 10.3%Males
- 2.7%Females
- Unemployment rate for Hispanic or Latino residents
- 6.2%Males
- 3.2%Females
Unemployment in 2023:
| Richfield: | 2.4% |
| Minnesota: | 2.6% |
Unemployment in 2022:
| Richfield: | 2.6% |
| Minnesota: | 2.7% |
Unemployment in 2021:
| Richfield: | 4.0% |
| Minnesota: | 3.8% |
Unemployment in 2020:
| Richfield: | 7.2% |
| Minnesota: | 6.3% |
Unemployment in 2019:
| Richfield: | 2.8% |
| Minnesota: | 3.3% |
Unemployment in 2018:
| Richfield: | 2.6% |
| Minnesota: | 3.0% |
Unemployment in 2017:
| Richfield: | 3.1% |
| Minnesota: | 3.5% |
Unemployment in 2016:
| Richfield: | 3.1% |
| Minnesota: | 3.9% |
Unemployment in 2015:
| Richfield: | 3.2% |
| Minnesota: | 3.8% |
Unemployment in 2014:
| Richfield: | 3.8% |
| Minnesota: | 4.3% |
Unemployment in 2013:
| Richfield: | 4.5% |
| Minnesota: | 5.0% |
Unemployment in 2012:
| Richfield: | 5.2% |
| Minnesota: | 5.6% |
Unemployment in 2011:
| Richfield: | 6.0% |
| Minnesota: | 6.5% |
Unemployment in 2010:
| Richfield: | 6.9% |
| Minnesota: | 7.4% |
Unemployment in 2009:
| Richfield: | 7.4% |
| Minnesota: | 7.9% |
Unemployment in 2008:
| Richfield: | 5.1% |
| Minnesota: | 5.4% |
Unemployment in 2007:
| Richfield: | 4.3% |
| Minnesota: | 4.6% |
Unemployment in 2006:
| Richfield: | 3.8% |
| Minnesota: | 4.1% |
Unemployment in 2005:
| Richfield: | 3.8% |
| Minnesota: | 4.1% |
Unemployment in 2004:
| Richfield: | 4.2% |
| Minnesota: | 4.6% |
Unemployment in 2003:
| Richfield: | 4.6% |
| Minnesota: | 4.8% |
Unemployment in 2002:
| Richfield: | 4.2% |
| Minnesota: | 4.5% |
Unemployment in 2001:
| Richfield: | 3.3% |
| Minnesota: | 3.8% |
Unemployment in 2000:
| Richfield: | 2.5% |
| Minnesota: | 3.0% |
Unemployment in 1999:
| Richfield: | 1.9% |
| Minnesota: | 2.7% |
Unemployment in 1998:
| Richfield: | 1.7% |
| Minnesota: | 2.7% |
Unemployment in 1997:
| Richfield: | 1.9% |
| Minnesota: | 3.2% |
Unemployment in 1996:
| Richfield: | 2.4% |
| Minnesota: | 3.8% |
Unemployment in 1995:
| Richfield: | 2.6% |
| Minnesota: | 3.7% |
Unemployment in 1994:
| Richfield: | 2.9% |
| Minnesota: | 4.0% |
Unemployment in 1993:
| Richfield: | 3.9% |
| Minnesota: | 4.8% |
Unemployment in 1992:
| Richfield: | 4.2% |
| Minnesota: | 5.0% |
Unemployment in 1991:
| Richfield: | 4.3% |
| Minnesota: | 5.1% |
Unemployment in 1990:
| Richfield: | 3.9% |
| Minnesota: | 4.7% |
Time leaving home to go to work
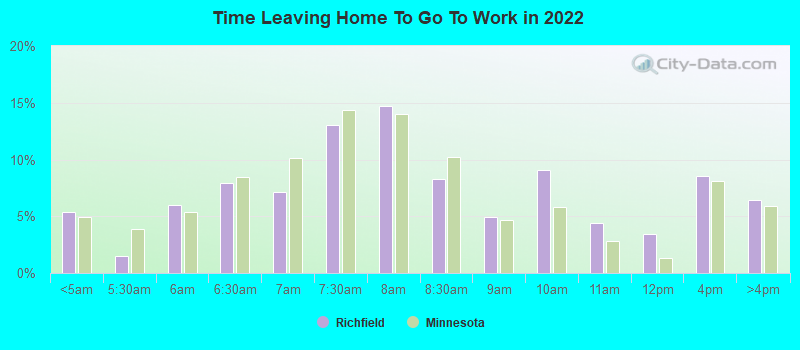
12:00 a.m. to 4:59 a.m.:
| Richfield: | 5.4% (887) |
| Minnesota: | 4.9% (120,781) |
5:00 a.m. to 5:29 a.m.:
| Richfield: | 1.5% (252) |
| Minnesota: | 3.8% (94,357) |
5:30 a.m. to 5:59 a.m.:
| Richfield: | 6.0% (983) |
| Minnesota: | 5.3% (131,116) |
6:00 a.m. to 6:29 a.m.:
| Richfield: | 7.9% (1,302) |
| Minnesota: | 8.4% (206,641) |
6:30 a.m. to 6:59 a.m.:
| Richfield: | 7.1% (1,174) |
| Minnesota: | 10.2% (249,032) |
7:00 a.m. to 7:29 a.m.:
| Richfield: | 13.1% (2,153) |
| Minnesota: | 14.4% (352,698) |
7:30 a.m. to 7:59 a.m.:
| Richfield: | 14.7% (2,422) |
| Minnesota: | 14.0% (344,046) |
8:00 a.m. to 8:29 a.m.:
| Richfield: | 8.3% (1,370) |
| Minnesota: | 10.2% (250,244) |
8:30 a.m. to 8:59 a.m.:
| Richfield: | 4.9% (815) |
| Minnesota: | 4.6% (113,732) |
9:00 a.m. to 9:59 a.m.:
| Richfield: | 9.1% (1,504) |
| Minnesota: | 5.8% (143,250) |
10:00 a.m. to 10:59 a.m.:
| Richfield: | 4.4% (721) |
| Minnesota: | 2.8% (69,598) |
11:00 a.m. to 11:59 a.m.:
| Richfield: | 3.5% (569) |
| Minnesota: | 1.3% (32,436) |
12:00 p.m. to 3:59 p.m.:
| Richfield: | 8.5% (1,403) |
| Minnesota: | 8.1% (199,389) |
4:00 p.m. to 11:59 p.m.:
| Richfield: | 6.4% (1,061) |
| Minnesota: | 5.9% (144,679) |
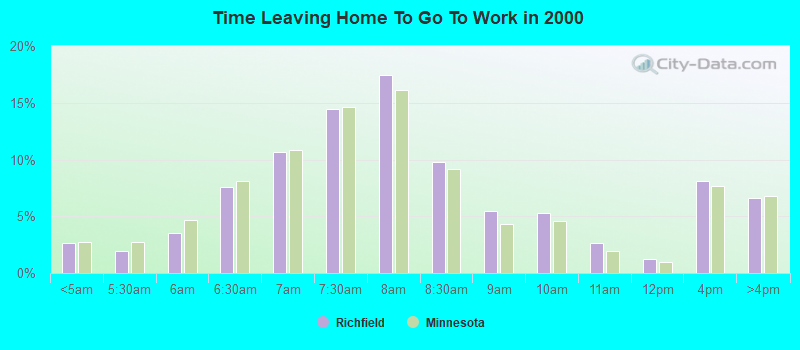
<5am:
| Richfield: | 2.7% (515) |
| Minnesota: | 2.8% (70,312) |
5:30am:
| Richfield: | 1.9% (364) |
| Minnesota: | 2.8% (70,053) |
6am:
| Richfield: | 3.5% (679) |
| Minnesota: | 4.7% (119,123) |
6:30am:
| Richfield: | 7.6% (1,459) |
| Minnesota: | 8.1% (206,893) |
7am:
| Richfield: | 10.6% (2,040) |
| Minnesota: | 10.8% (275,657) |
7:30am:
| Richfield: | 14.5% (2,776) |
| Minnesota: | 14.6% (371,966) |
8am:
| Richfield: | 17.4% (3,342) |
| Minnesota: | 16.2% (410,487) |
8:30am:
| Richfield: | 9.8% (1,874) |
| Minnesota: | 9.2% (233,326) |
9am:
| Richfield: | 5.4% (1,044) |
| Minnesota: | 4.3% (109,027) |
10am:
| Richfield: | 5.3% (1,021) |
| Minnesota: | 4.6% (117,544) |
11am:
| Richfield: | 2.6% (507) |
| Minnesota: | 1.9% (48,795) |
12pm:
| Richfield: | 1.3% (242) |
| Minnesota: | 1.0% (25,041) |
4pm:
| Richfield: | 8.1% (1,555) |
| Minnesota: | 7.7% (195,126) |
>4pm:
| Richfield: | 6.6% (1,260) |
| Minnesota: | 6.8% (171,607) |
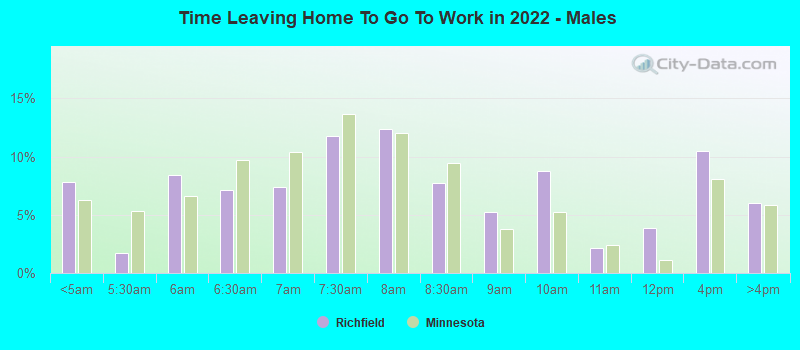
12:00 a.m. to 4:59 a.m. - Males:
| Richfield: | 7.8% (658) |
| Minnesota: | 6.3% (82,514) |
5:00 a.m. to 5:29 a.m. - Males:
| Richfield: | 1.7% (145) |
| Minnesota: | 5.4% (70,578) |
5:30 a.m. to 5:59 a.m. - Males:
| Richfield: | 8.4% (707) |
| Minnesota: | 6.6% (86,477) |
6:00 a.m. to 6:29 a.m. - Males:
| Richfield: | 7.1% (600) |
| Minnesota: | 9.7% (127,243) |
6:30 a.m. to 6:59 a.m. - Males:
| Richfield: | 7.4% (620) |
| Minnesota: | 10.4% (136,365) |
7:00 a.m. to 7:29 a.m. - Males:
| Richfield: | 11.7% (988) |
| Minnesota: | 13.7% (179,738) |
7:30 a.m. to 7:59 a.m. - Males:
| Richfield: | 12.4% (1,042) |
| Minnesota: | 12.0% (158,107) |
8:00 a.m. to 8:29 a.m. - Males:
| Richfield: | 7.7% (648) |
| Minnesota: | 9.4% (123,700) |
8:30 a.m. to 8:59 a.m. - Males:
| Richfield: | 5.3% (444) |
| Minnesota: | 3.8% (49,970) |
9:00 a.m. to 9:59 a.m. - Males:
| Richfield: | 8.8% (739) |
| Minnesota: | 5.3% (69,327) |
10:00 a.m. to 10:59 a.m. - Males:
| Richfield: | 2.1% (181) |
| Minnesota: | 2.4% (32,133) |
11:00 a.m. to 11:59 a.m. - Males:
| Richfield: | 3.9% (328) |
| Minnesota: | 1.2% (15,147) |
12:00 p.m. to 3:59 p.m. - Males:
| Richfield: | 10.5% (882) |
| Minnesota: | 8.1% (106,315) |
4:00 p.m. to 11:59 p.m. - Males:
| Richfield: | 6.0% (508) |
| Minnesota: | 5.9% (77,278) |
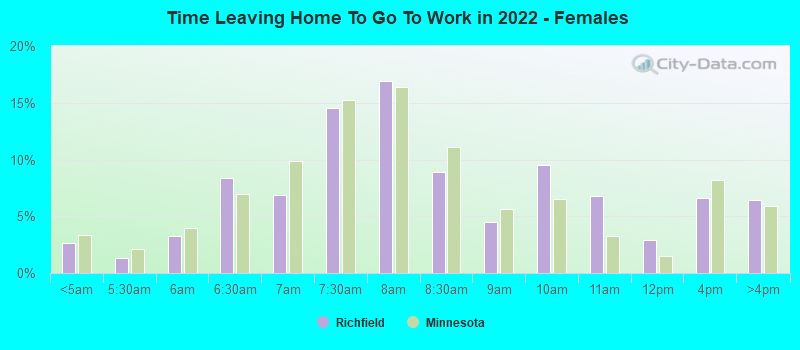
12:00 a.m. to 4:59 a.m. - Females:
| Richfield: | 2.6% (211) |
| Minnesota: | 3.4% (38,267) |
5:00 a.m. to 5:29 a.m. - Females:
| Richfield: | 1.4% (110) |
| Minnesota: | 2.1% (23,779) |
5:30 a.m. to 5:59 a.m. - Females:
| Richfield: | 3.3% (267) |
| Minnesota: | 3.9% (44,639) |
6:00 a.m. to 6:29 a.m. - Females:
| Richfield: | 8.4% (676) |
| Minnesota: | 7.0% (79,398) |
6:30 a.m. to 6:59 a.m. - Females:
| Richfield: | 6.8% (552) |
| Minnesota: | 9.9% (112,667) |
7:00 a.m. to 7:29 a.m. - Females:
| Richfield: | 14.5% (1,172) |
| Minnesota: | 15.2% (172,960) |
7:30 a.m. to 7:59 a.m. - Females:
| Richfield: | 16.9% (1,365) |
| Minnesota: | 16.4% (185,939) |
8:00 a.m. to 8:29 a.m. - Females:
| Richfield: | 8.9% (721) |
| Minnesota: | 11.1% (126,544) |
8:30 a.m. to 8:59 a.m. - Females:
| Richfield: | 4.5% (359) |
| Minnesota: | 5.6% (63,762) |
9:00 a.m. to 9:59 a.m. - Females:
| Richfield: | 9.5% (765) |
| Minnesota: | 6.5% (73,923) |
10:00 a.m. to 10:59 a.m. - Females:
| Richfield: | 6.8% (549) |
| Minnesota: | 3.3% (37,465) |
11:00 a.m. to 11:59 a.m. - Females:
| Richfield: | 2.9% (236) |
| Minnesota: | 1.5% (17,289) |
12:00 p.m. to 3:59 p.m. - Females:
| Richfield: | 6.6% (533) |
| Minnesota: | 8.2% (93,074) |
4:00 p.m. to 11:59 p.m. - Females:
| Richfield: | 6.4% (518) |
| Minnesota: | 5.9% (67,401) |
Travel time to work
Percentage of workers working in this county: 78.3%
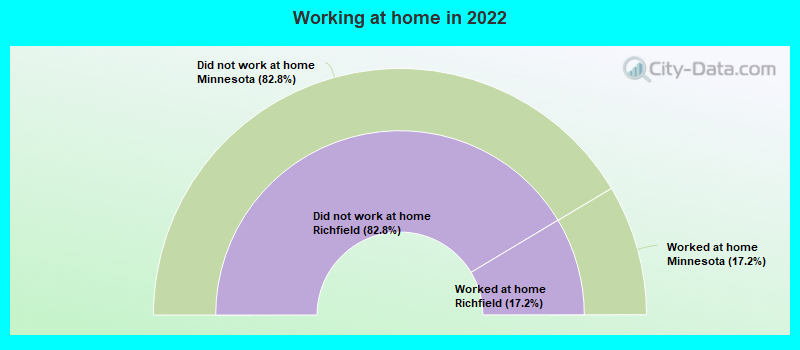
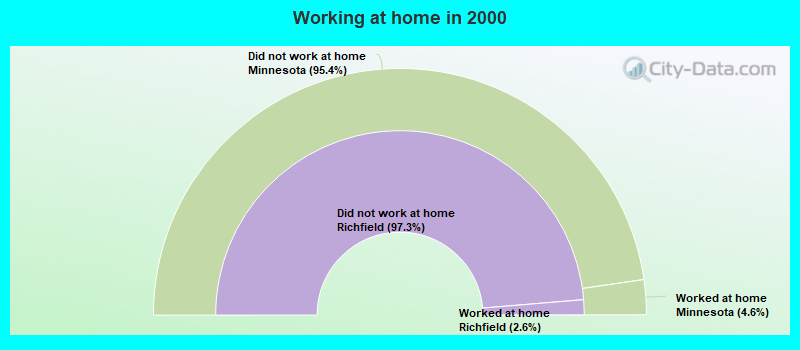
Number of people working at home: 2,720 (13.3% of all workers)
Daytime population change due to commuting: -8,261 (-24.0%)
Workers who live and work in this city: 2,514 (13.1%)
Number of people working at home: 2,720 (13.3% of all workers)
Daytime population change due to commuting: -8,261 (-24.0%)
Workers who live and work in this city: 2,514 (13.1%)
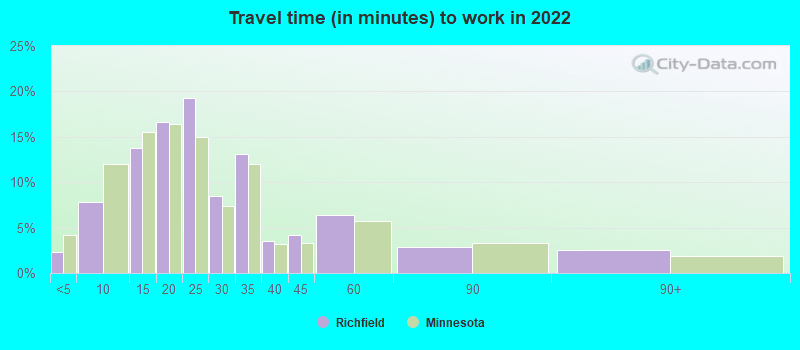
Less than 5 minutes:
| Richfield: | 2.3% (320) |
| Minnesota: | 4.2% (103,861) |
5 to 9 minutes:
| Richfield: | 7.8% (1,083) |
| Minnesota: | 12.0% (295,785) |
10 to 14 minutes:
| Richfield: | 13.8% (1,924) |
| Minnesota: | 15.5% (380,826) |
15 to 19 minutes:
| Richfield: | 16.6% (2,315) |
| Minnesota: | 16.5% (404,549) |
20 to 24 minutes:
| Richfield: | 19.3% (2,690) |
| Minnesota: | 15.0% (367,833) |
25 to 29 minutes:
| Richfield: | 8.4% (1,175) |
| Minnesota: | 7.4% (182,328) |
30 to 34 minutes:
| Richfield: | 13.1% (1,824) |
| Minnesota: | 12.0% (294,767) |
35 to 39 minutes:
| Richfield: | 3.5% (494) |
| Minnesota: | 3.1% (77,358) |
40 to 44 minutes:
| Richfield: | 4.2% (586) |
| Minnesota: | 3.4% (82,472) |
45 to 59 minutes:
| Richfield: | 6.4% (896) |
| Minnesota: | 5.7% (139,792) |
60 to 89 minutes:
| Richfield: | 2.9% (398) |
| Minnesota: | 3.3% (81,373) |
90 or more minutes:
| Richfield: | 2.6% (356) |
| Minnesota: | 1.9% (47,134) |
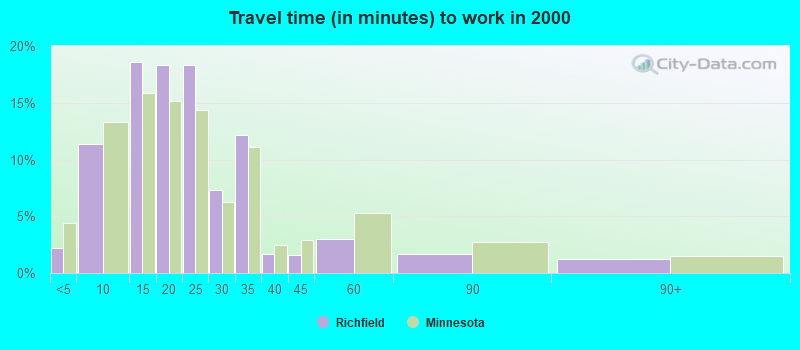
Less than 5 minutes:
| Richfield: | 2.2% (431) |
| Minnesota: | 4.4% (112,704) |
5 to 9 minutes:
| Richfield: | 11.4% (2,183) |
| Minnesota: | 13.3% (338,699) |
10 to 14 minutes:
| Richfield: | 18.5% (3,559) |
| Minnesota: | 15.9% (403,004) |
15 to 19 minutes:
| Richfield: | 18.3% (3,514) |
| Minnesota: | 15.1% (384,560) |
20 to 24 minutes:
| Richfield: | 18.3% (3,511) |
| Minnesota: | 14.4% (365,773) |
25 to 29 minutes:
| Richfield: | 7.3% (1,406) |
| Minnesota: | 6.2% (158,419) |
30 to 34 minutes:
| Richfield: | 12.1% (2,325) |
| Minnesota: | 11.1% (282,272) |
35 to 39 minutes:
| Richfield: | 1.7% (321) |
| Minnesota: | 2.5% (63,572) |
40 to 44 minutes:
| Richfield: | 1.6% (301) |
| Minnesota: | 2.9% (74,188) |
45 to 59 minutes:
| Richfield: | 3.0% (569) |
| Minnesota: | 5.3% (133,528) |
60 to 89 minutes:
| Richfield: | 1.6% (316) |
| Minnesota: | 2.7% (69,503) |
90 or more minutes:
| Richfield: | 1.3% (242) |
| Minnesota: | 1.5% (38,735) |
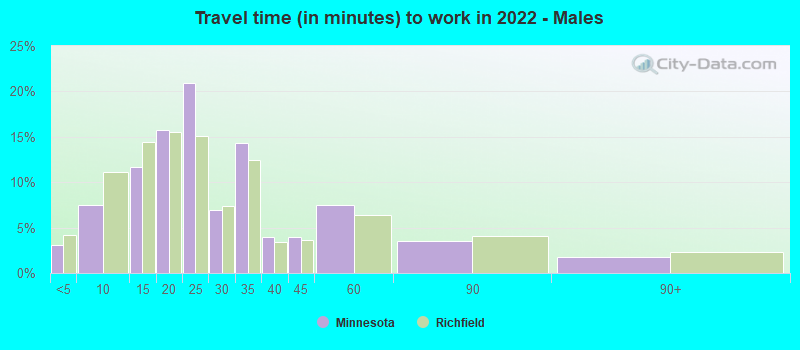
Less than 5 minutes - Males:
| Richfield: | 3.0% (227) |
| Minnesota: | 4.1% (54,466) |
5 to 9 minutes - Males:
| Richfield: | 7.4% (556) |
| Minnesota: | 11.1% (146,289) |
10 to 14 minutes - Males:
| Richfield: | 11.7% (874) |
| Minnesota: | 14.4% (189,693) |
15 to 19 minutes - Males:
| Richfield: | 15.7% (1,174) |
| Minnesota: | 15.5% (204,410) |
20 to 24 minutes - Males:
| Richfield: | 20.9% (1,565) |
| Minnesota: | 15.1% (199,117) |
25 to 29 minutes - Males:
| Richfield: | 6.9% (515) |
| Minnesota: | 7.3% (96,577) |
30 to 34 minutes - Males:
| Richfield: | 14.3% (1,070) |
| Minnesota: | 12.5% (163,847) |
35 to 39 minutes - Males:
| Richfield: | 4.0% (296) |
| Minnesota: | 3.4% (44,588) |
40 to 44 minutes - Males:
| Richfield: | 4.0% (300) |
| Minnesota: | 3.6% (47,517) |
45 to 59 minutes - Males:
| Richfield: | 7.5% (563) |
| Minnesota: | 6.4% (83,892) |
60 to 89 minutes - Males:
| Richfield: | 3.5% (260) |
| Minnesota: | 4.1% (53,961) |
90 or more minutes - Males:
| Richfield: | 1.8% (131) |
| Minnesota: | 2.4% (31,003) |
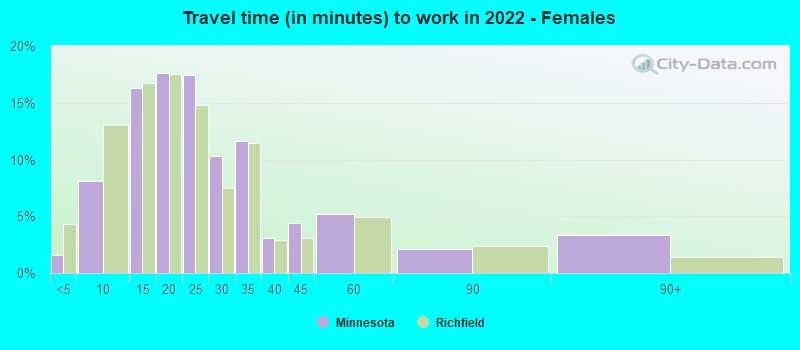
Less than 5 minutes - Females:
| Richfield: | 1.6% (104) |
| Minnesota: | 4.3% (49,395) |
5 to 9 minutes - Females:
| Richfield: | 8.1% (521) |
| Minnesota: | 13.1% (149,496) |
10 to 14 minutes - Females:
| Richfield: | 16.3% (1,053) |
| Minnesota: | 16.7% (191,133) |
15 to 19 minutes - Females:
| Richfield: | 17.7% (1,141) |
| Minnesota: | 17.5% (200,139) |
20 to 24 minutes - Females:
| Richfield: | 17.5% (1,129) |
| Minnesota: | 14.8% (168,716) |
25 to 29 minutes - Females:
| Richfield: | 10.3% (665) |
| Minnesota: | 7.5% (85,751) |
30 to 34 minutes - Females:
| Richfield: | 11.6% (751) |
| Minnesota: | 11.5% (130,920) |
35 to 39 minutes - Females:
| Richfield: | 3.1% (199) |
| Minnesota: | 2.9% (32,770) |
40 to 44 minutes - Females:
| Richfield: | 4.4% (285) |
| Minnesota: | 3.1% (34,955) |
45 to 59 minutes - Females:
| Richfield: | 5.2% (335) |
| Minnesota: | 4.9% (55,900) |
60 to 89 minutes - Females:
| Richfield: | 2.1% (139) |
| Minnesota: | 2.4% (27,412) |
90 or more minutes - Females:
| Richfield: | 3.3% (215) |
| Minnesota: | 1.4% (16,131) |
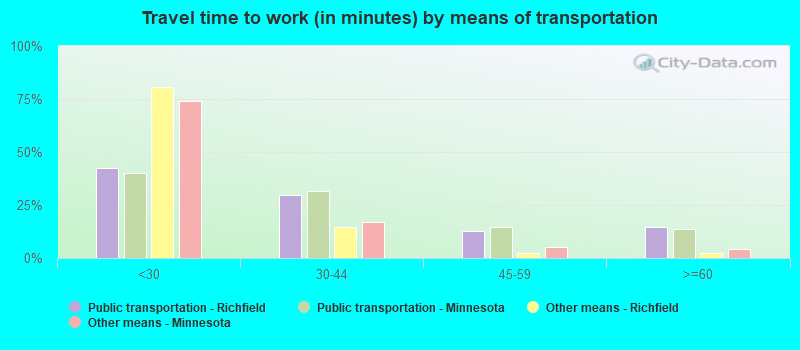
Means of transportation to work
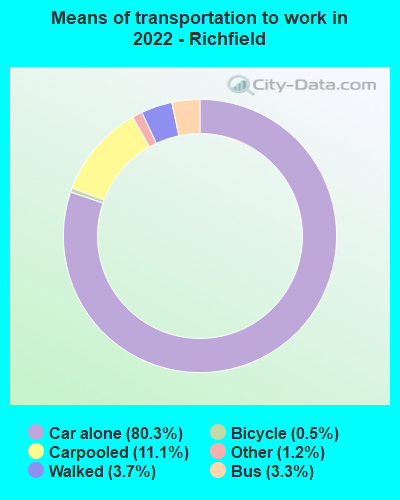
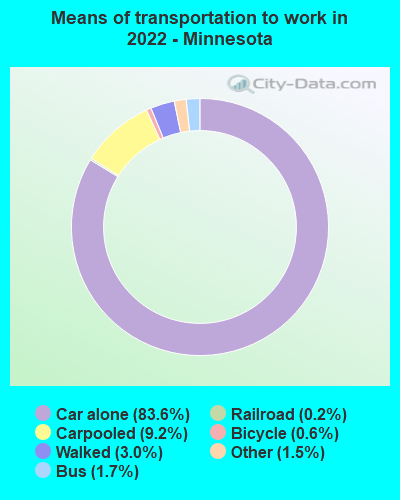
Drove car alone:
| Richfield: | 80.3% (11,844) |
| Minnesota: | 83.6% (951,223) |
Carpooled:
| Richfield: | 11.1% (1,635) |
| Minnesota: | 9.2% (113,324) |
Bus:
| Richfield: | 3.3% (488) |
| Minnesota: | 1.7% (17,615) |
Bicycle:
| Richfield: | 0.5% (73) |
| Minnesota: | 0.6% (4,411) |
Walked:
| Richfield: | 3.7% (541) |
| Minnesota: | 3.0% (35,804) |
Other means:
| Richfield: | 1.2% (175) |
| Minnesota: | 1.5% (16,136) |
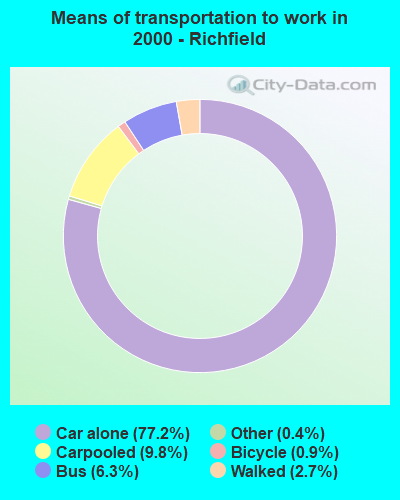
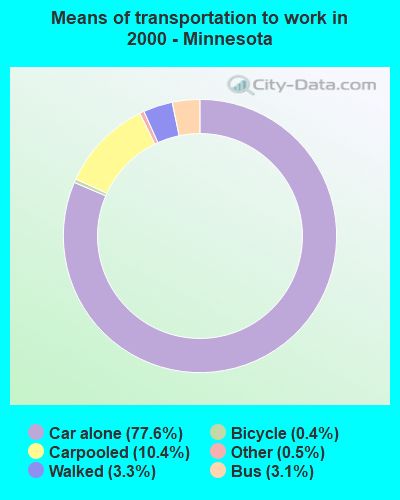
Drove car alone:
| Richfield: | 77.2% (14,813) |
| Minnesota: | 77.6% (1,971,668) |
Carpooled:
| Richfield: | 9.8% (1,882) |
| Minnesota: | 10.4% (264,690) |
Bus or trolley bus:
| Richfield: | 6.3% (1,207) |
| Minnesota: | 3.1% (78,691) |
Taxicab:
| Richfield: | 0.1% (17) |
| Minnesota: | 0.1% (1,792) |
Motorcycle:
| Richfield: | 0.0% (3) |
| Minnesota: | 0.1% (1,347) |
Bicycle:
| Richfield: | 0.9% (172) |
| Minnesota: | 0.4% (10,096) |
Walked:
| Richfield: | 2.7% (512) |
| Minnesota: | 3.3% (84,148) |
Other means:
| Richfield: | 0.4% (72) |
| Minnesota: | 0.5% (11,732) |
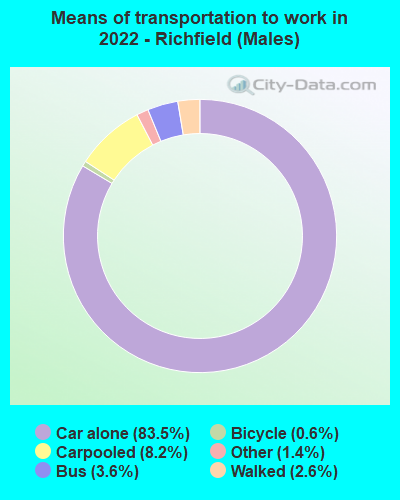

Drove car alone - Males:
| Richfield: | 83.5% (6,576) |
| Minnesota: | 84.0% (951,223) |
Carpooled - Males:
| Richfield: | 8.2% (645) |
| Minnesota: | 8.7% (113,324) |
Bus - Males:
| Richfield: | 3.6% (285) |
| Minnesota: | 1.8% (17,615) |
Bicycle - Males:
| Richfield: | 0.6% (51) |
| Minnesota: | 0.7% (4,411) |
Walked - Males:
| Richfield: | 2.6% (207) |
| Minnesota: | 3.0% (35,804) |
Other means - Males:
| Richfield: | 1.4% (108) |
| Minnesota: | 1.7% (16,136) |
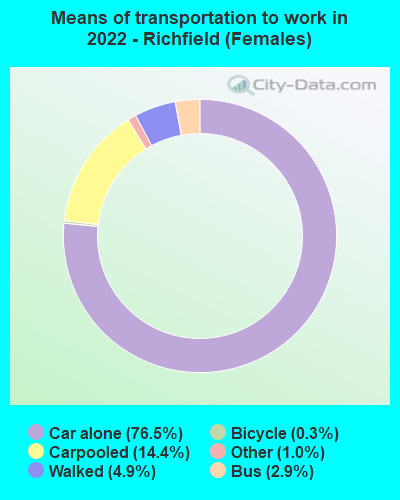

Drove car alone - Females:
| Richfield: | 76.5% (5,270) |
| Minnesota: | 83.2% (951,223) |
Carpooled - Females:
| Richfield: | 14.4% (989) |
| Minnesota: | 9.9% (113,324) |
Bus - Females:
| Richfield: | 2.9% (203) |
| Minnesota: | 1.5% (17,615) |
Bicycle - Females:
| Richfield: | 0.3% (22) |
| Minnesota: | 0.4% (4,411) |
Walked - Females:
| Richfield: | 4.9% (334) |
| Minnesota: | 3.1% (35,804) |
Other means - Females:
| Richfield: | 1.0% (67) |
| Minnesota: | 1.4% (16,136) |
Private vehicle occupancy
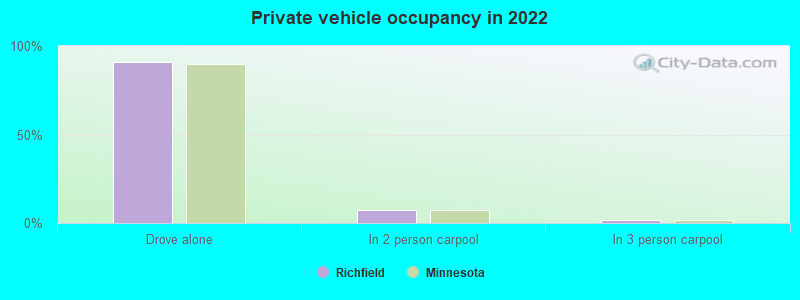
Drove alone:
| Richfield: | 90.9% (13,236) |
| Minnesota: | 90.0% (2,050,351) |
In 2 person carpool:
| Richfield: | 7.1% (1,031) |
| Minnesota: | 7.3% (166,995) |
In 3 person carpool:
| Richfield: | 1.8% (269) |
| Minnesota: | 1.6% (35,947) |
In 4 person carpool:
| Richfield: | 0.2% (26) |
| Minnesota: | 0.6% (14,494) |
In 5-6 person carpool:
| Richfield: | 0.0% (4) |
| Minnesota: | 0.3% (7,468) |
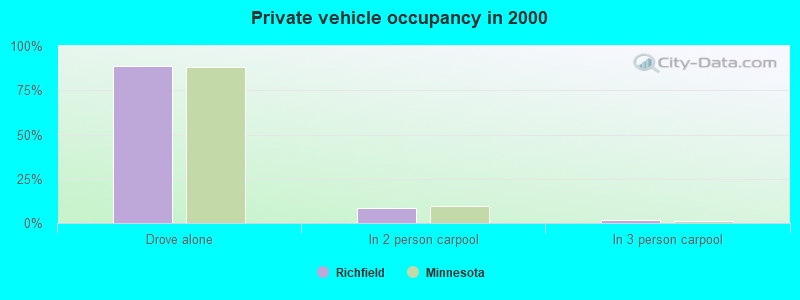
Drove alone:
| Richfield: | 88.7% (14,813) |
| Minnesota: | 88.2% (1,971,668) |
In 2 person carpool:
| Richfield: | 8.4% (1,401) |
| Minnesota: | 9.6% (215,251) |
In 3 person carpool:
| Richfield: | 1.5% (254) |
| Minnesota: | 1.4% (31,043) |
In 4 person carpool:
| Richfield: | 0.2% (41) |
| Minnesota: | 0.5% (10,144) |
In 5-6 person carpool:
| Richfield: | 0.6% (99) |
| Minnesota: | 0.2% (4,827) |
In 7+ person carpool:
| Richfield: | 0.5% (87) |
| Minnesota: | 0.2% (3,425) |
Class of workers
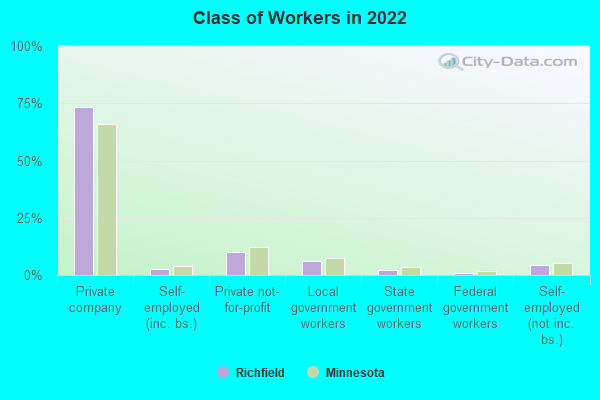
Employee of private company:
| Richfield: | 73.4% (15,134) |
| Minnesota: | 65.9% (1,982,190) |
Self-employed in own incorporated business:
| Richfield: | 2.7% (553) |
| Minnesota: | 4.0% (119,417) |
Private not-for-profit wage and salary workers:
| Richfield: | 10.3% (2,113) |
| Minnesota: | 12.1% (364,175) |
Local government workers:
| Richfield: | 6.0% (1,234) |
| Minnesota: | 7.5% (226,630) |
State government workers:
| Richfield: | 2.3% (476) |
| Minnesota: | 3.4% (102,331) |
Federal government workers:
| Richfield: | 1.1% (224) |
| Minnesota: | 1.6% (48,213) |
Self-employed workers in own not incorporated business:
| Richfield: | 4.2% (865) |
| Minnesota: | 5.3% (160,154) |
Unpaid family workers:
| Richfield: | 0.1% (12) |
| Minnesota: | 0.2% (5,517) |
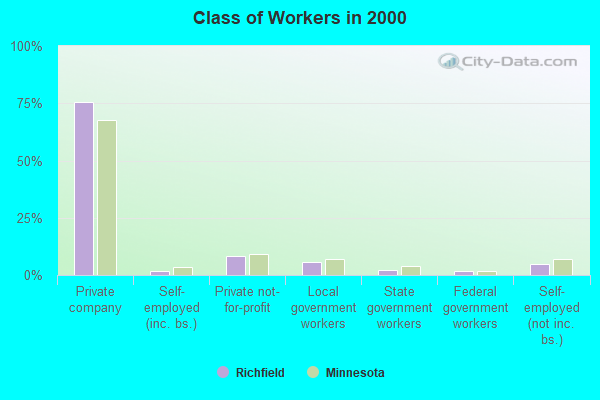
Employee of private company:
| Richfield: | 75.6% (14,705) |
| Minnesota: | 67.7% (1,747,303) |
Self-employed in own incorporated business:
| Richfield: | 2.0% (380) |
| Minnesota: | 3.3% (85,391) |
Private not-for-profit wage and salary workers:
| Richfield: | 8.4% (1,630) |
| Minnesota: | 9.4% (241,738) |
Local government workers:
| Richfield: | 5.5% (1,076) |
| Minnesota: | 6.8% (175,282) |
State government workers:
| Richfield: | 2.2% (426) |
| Minnesota: | 4.0% (101,959) |
Federal government workers:
| Richfield: | 1.7% (329) |
| Minnesota: | 1.6% (41,691) |
Self-employed workers in own not incorporated business:
| Richfield: | 4.6% (899) |
| Minnesota: | 6.9% (178,586) |
Unpaid family workers:
| Richfield: | 0.0% (4) |
| Minnesota: | 0.3% (8,096) |
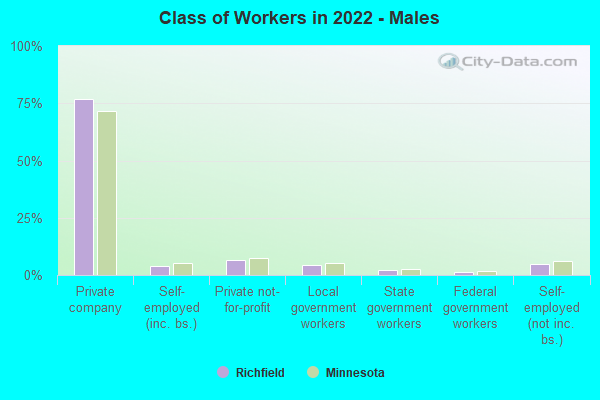
Employee of private company - Males:
| Richfield: | 77.0% (8,313) |
| Minnesota: | 71.5% (1,128,925) |
Self-employed in own incorporated business - Males:
| Richfield: | 3.9% (421) |
| Minnesota: | 5.0% (79,524) |
Private not-for-profit wage and salary workers - Males:
| Richfield: | 6.4% (687) |
| Minnesota: | 7.4% (117,071) |
Local government workers - Males:
| Richfield: | 4.3% (467) |
| Minnesota: | 5.3% (83,941) |
State government workers - Males:
| Richfield: | 2.4% (255) |
| Minnesota: | 2.8% (44,695) |
Federal government workers - Males:
| Richfield: | 1.4% (147) |
| Minnesota: | 1.6% (25,848) |
Self-employed workers in own not incorporated business - Males:
| Richfield: | 4.6% (497) |
| Minnesota: | 6.0% (94,953) |
Unpaid family workers - Males:
| Richfield: | 0.1% (12) |
| Minnesota: | 0.2% (3,045) |
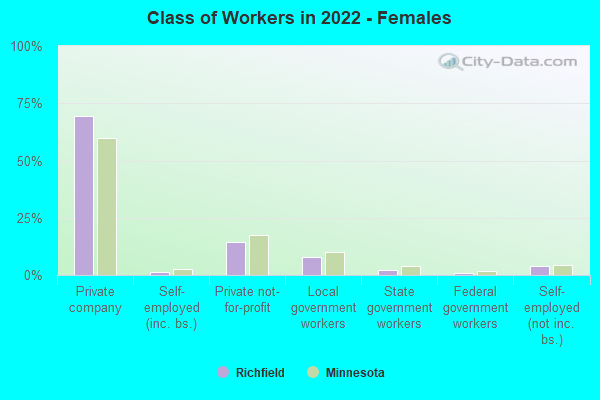
Employee of private company - Females:
| Richfield: | 69.5% (6,821) |
| Minnesota: | 59.6% (853,265) |
Self-employed in own incorporated business - Females:
| Richfield: | 1.3% (132) |
| Minnesota: | 2.8% (39,893) |
Private not-for-profit wage and salary workers - Females:
| Richfield: | 14.5% (1,426) |
| Minnesota: | 17.3% (247,104) |
Local government workers - Females:
| Richfield: | 7.8% (767) |
| Minnesota: | 10.0% (142,689) |
State government workers - Females:
| Richfield: | 2.2% (220) |
| Minnesota: | 4.0% (57,636) |
Federal government workers - Females:
| Richfield: | 0.8% (77) |
| Minnesota: | 1.6% (22,365) |
Self-employed workers in own not incorporated business - Females:
| Richfield: | 3.8% (368) |
| Minnesota: | 4.6% (65,201) |