Work and Jobs in Richland, Texas (TX) Detailed Stats
Occupations, Industries, Unemployment, Workers, Commute
Settings
X


Recent posts about work in Richland, Texas on our local forum with over 2,400,000 registered users:
 | Million Dollar Question - Buy or Wait? 2022 Edition (620 replies) |
| Anyone know how much these jobs pay? (0 replies) |
| North Richland Hills? Vs Flower Mound (3 replies) |
| Fort Worth houses (41 replies) |
| Housing options for my low income senior mom. (11 replies) |
| Looking around DFW for retirement (7 replies) |
Latest news about work in Richland, TX collected exclusively by city-data.com from local newspapers, TV, and radio stations
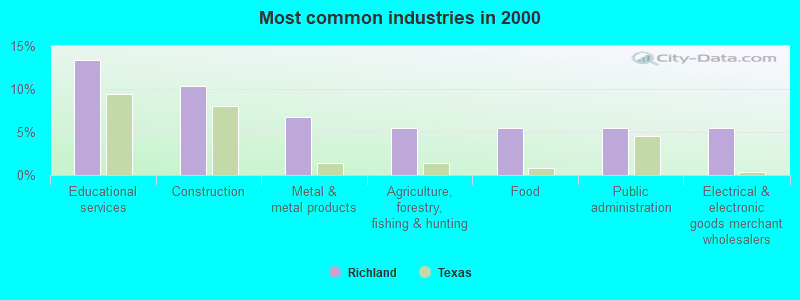
The most common industries in Richland are: Educational services (13.4% of civilian employees), Construction (10.4% of civilian employees), Metal & metal products (6.7% of civilian employees). 73.2% of workers work in Navarro County and 4.7% of all workers work at home. 68.5% of workers are employees of private companies, which is about the same as the rate of 69.6% across the entire state of Texas.
Whole page based on the data from 2000 / 2022 when the population of Richland, Texas was 291 / 315
Whole page based on the data from 2000 / 2022 when the population of Richland, Texas was 291 / 315
Most common industries
Most common industries | |||
|---|---|---|---|
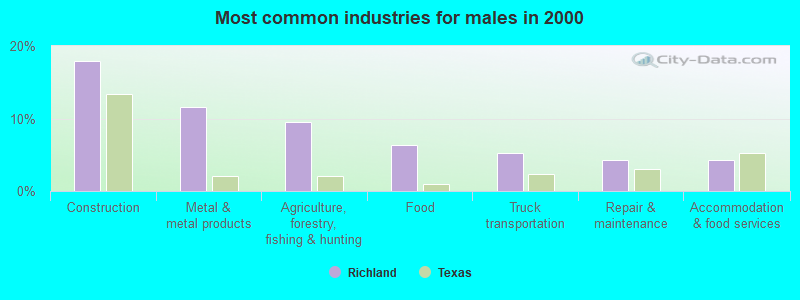
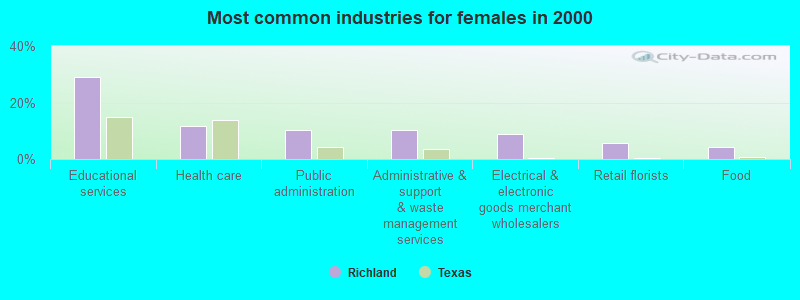
Industry | All | Males | Females |
| Educational services | 13.4% (22) | 2.1% (2) | 29.0% (20) |
| Construction | 10.4% (17) | 17.9% (17) | 0.0% (0) |
| Metal and metal products | 6.7% (11) | 11.6% (11) | 0.0% (0) |
| Agriculture, forestry, fishing and hunting | 5.5% (9) | 9.5% (9) | 0.0% (0) |
| Food | 5.5% (9) | 6.3% (6) | 4.3% (3) |
| Public administration | 5.5% (9) | 2.1% (2) | 10.1% (7) |
| Electrical and electronic goods merchant wholesalers | 5.5% (9) | 3.2% (3) | 8.7% (6) |
| Health care | 4.9% (8) | 0.0% (0) | 11.6% (8) |
| Administrative and support and waste management services | 4.3% (7) | 0.0% (0) | 10.1% (7) |
| Accommodation and food services | 3.7% (6) | 4.2% (4) | 2.9% (2) |
| Truck transportation | 3.0% (5) | 5.3% (5) | 0.0% (0) |
| Finance and insurance | 3.0% (5) | 2.1% (2) | 4.3% (3) |
| Repair and maintenance | 2.4% (4) | 4.2% (4) | 0.0% (0) |
| Paper | 2.4% (4) | 2.1% (2) | 2.9% (2) |
| Retail florists | 2.4% (4) | 0.0% (0) | 5.8% (4) |
| Mining, quarrying, and oil and gas extraction | 1.8% (3) | 3.2% (3) | 0.0% (0) |
| Petroleum and coal products | 1.8% (3) | 3.2% (3) | 0.0% (0) |
| U. S. Postal service | 1.8% (3) | 0.0% (0) | 4.3% (3) |
| Real estate and rental and leasing | 1.8% (3) | 3.2% (3) | 0.0% (0) |
| Motor vehicle and parts dealers | 1.8% (3) | 3.2% (3) | 0.0% (0) |
| Department and other general merchandise stores | 1.2% (2) | 0.0% (0) | 2.9% (2) |
| Chemicals | 1.2% (2) | 2.1% (2) | 0.0% (0) |
| Plastics and rubber products | 1.2% (2) | 2.1% (2) | 0.0% (0) |
| Clothing and accessories, including shoe, stores | 1.2% (2) | 2.1% (2) | 0.0% (0) |
| Used merchandise, gift, novelty, and souvenir, and other miscellaneous stores | 1.2% (2) | 0.0% (0) | 2.9% (2) |
| Furniture and home furnishings, and household appliance stores | 1.2% (2) | 2.1% (2) | 0.0% (0) |
| Utilities | 1.2% (2) | 2.1% (2) | 0.0% (0) |
| Data processing, libraries, and other information services | 1.2% (2) | 2.1% (2) | 0.0% (0) |
| Arts, entertainment, and recreation | 1.2% (2) | 2.1% (2) | 0.0% (0) |
| Transportation equipment | 0.6% (1) | 1.1% (1) | 0.0% (0) |
| Food and beverage stores | 0.6% (1) | 1.1% (1) | 0.0% (0) |
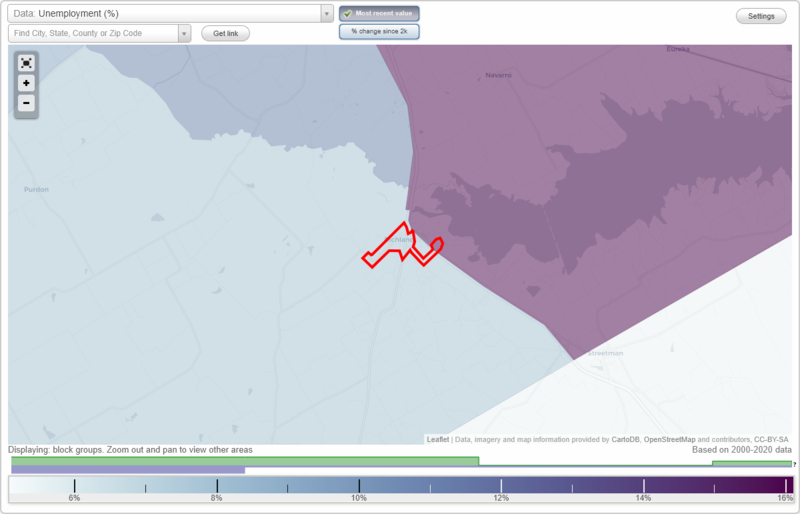
Unemployment in Richland
- Unemployment by race in 2022
- Unemployment rate for White non-Hispanic residents
- 3.3%Males
- Unemployment by race in 2000
- Unemployment rate for White non-Hispanic residents
- 2.3%Males
- 2.9%Females
Time leaving home to go to work
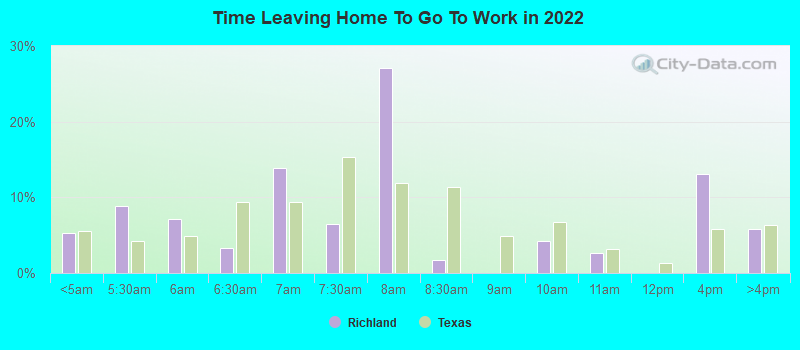
12:00 a.m. to 4:59 a.m.:
| Richland: | 5.3% (6) |
| Texas: | 5.5% (678,264) |
5:00 a.m. to 5:29 a.m.:
| Richland: | 8.8% (11) |
| Texas: | 4.3% (525,841) |
5:30 a.m. to 5:59 a.m.:
| Richland: | 7.2% (9) |
| Texas: | 4.9% (603,953) |
6:00 a.m. to 6:29 a.m.:
| Richland: | 3.3% (4) |
| Texas: | 9.4% (1,155,020) |
6:30 a.m. to 6:59 a.m.:
| Richland: | 13.9% (17) |
| Texas: | 9.3% (1,152,822) |
7:00 a.m. to 7:29 a.m.:
| Richland: | 6.5% (8) |
| Texas: | 15.3% (1,885,477) |
7:30 a.m. to 7:59 a.m.:
| Richland: | 27.1% (33) |
| Texas: | 11.9% (1,469,628) |
8:00 a.m. to 8:29 a.m.:
| Richland: | 1.7% (2) |
| Texas: | 11.3% (1,400,175) |
9:00 a.m. to 9:59 a.m.:
| Richland: | 4.2% (5) |
| Texas: | 6.7% (829,367) |
10:00 a.m. to 10:59 a.m.:
| Richland: | 2.6% (3) |
| Texas: | 3.2% (390,354) |
12:00 p.m. to 3:59 p.m.:
| Richland: | 13.1% (16) |
| Texas: | 5.8% (720,594) |
4:00 p.m. to 11:59 p.m.:
| Richland: | 5.8% (7) |
| Texas: | 6.3% (777,072) |
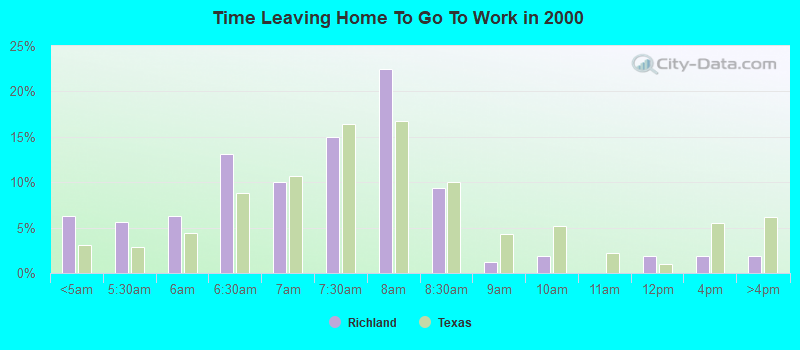
<5am:
| Richland: | 6.2% (10) |
| Texas: | 3.1% (281,361) |
5:30am:
| Richland: | 5.6% (9) |
| Texas: | 2.9% (262,060) |
6am:
| Richland: | 6.2% (10) |
| Texas: | 4.4% (403,423) |
6:30am:
| Richland: | 13.1% (21) |
| Texas: | 8.8% (808,876) |
7am:
| Richland: | 10.0% (16) |
| Texas: | 10.7% (976,557) |
7:30am:
| Richland: | 15.0% (24) |
| Texas: | 16.4% (1,500,904) |
8am:
| Richland: | 22.5% (36) |
| Texas: | 16.8% (1,536,308) |
8:30am:
| Richland: | 9.4% (15) |
| Texas: | 10.0% (913,601) |
9am:
| Richland: | 1.2% (2) |
| Texas: | 4.4% (398,656) |
10am:
| Richland: | 1.9% (3) |
| Texas: | 5.2% (472,592) |
12pm:
| Richland: | 1.9% (3) |
| Texas: | 0.9% (86,997) |
4pm:
| Richland: | 1.9% (3) |
| Texas: | 5.5% (503,565) |
>4pm:
| Richland: | 1.9% (3) |
| Texas: | 6.1% (563,107) |
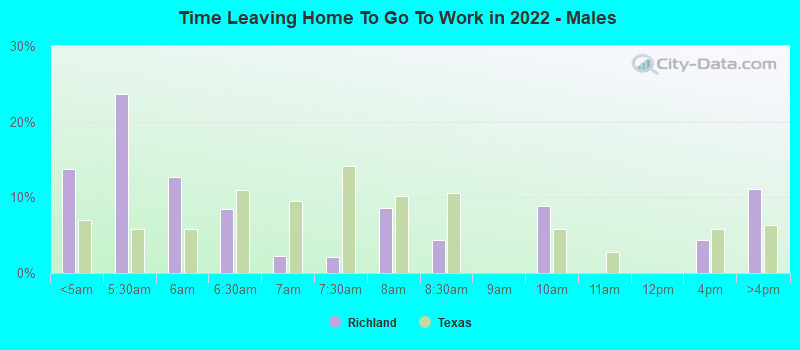
12:00 a.m. to 4:59 a.m. - Males:
| Richland: | 13.7% (6) |
| Texas: | 7.0% (477,284) |
5:00 a.m. to 5:29 a.m. - Males:
| Richland: | 23.7% (11) |
| Texas: | 5.8% (394,876) |
5:30 a.m. to 5:59 a.m. - Males:
| Richland: | 12.6% (6) |
| Texas: | 5.9% (402,788) |
6:00 a.m. to 6:29 a.m. - Males:
| Richland: | 8.5% (4) |
| Texas: | 10.9% (751,118) |
6:30 a.m. to 6:59 a.m. - Males:
| Richland: | 2.2% (1) |
| Texas: | 9.5% (652,306) |
7:00 a.m. to 7:29 a.m. - Males:
| Richland: | 2.1% (1) |
| Texas: | 14.1% (970,598) |
7:30 a.m. to 7:59 a.m. - Males:
| Richland: | 8.6% (4) |
| Texas: | 10.2% (696,429) |
8:00 a.m. to 8:29 a.m. - Males:
| Richland: | 4.4% (2) |
| Texas: | 10.6% (729,041) |
9:00 a.m. to 9:59 a.m. - Males:
| Richland: | 8.8% (4) |
| Texas: | 5.8% (401,071) |
12:00 p.m. to 3:59 p.m. - Males:
| Richland: | 4.4% (2) |
| Texas: | 5.8% (397,795) |
4:00 p.m. to 11:59 p.m. - Males:
| Richland: | 11.1% (5) |
| Texas: | 6.4% (435,950) |

5:30 a.m. to 5:59 a.m. - Females:
| Richland: | 3.8% (3) |
| Texas: | 3.7% (201,165) |
6:30 a.m. to 6:59 a.m. - Females:
| Richland: | 20.5% (16) |
| Texas: | 9.1% (500,516) |
7:00 a.m. to 7:29 a.m. - Females:
| Richland: | 9.3% (7) |
| Texas: | 16.7% (914,879) |
7:30 a.m. to 7:59 a.m. - Females:
| Richland: | 38.5% (29) |
| Texas: | 14.1% (773,199) |
9:00 a.m. to 9:59 a.m. - Females:
| Richland: | 1.4% (1) |
| Texas: | 7.8% (428,296) |
10:00 a.m. to 10:59 a.m. - Females:
| Richland: | 4.2% (3) |
| Texas: | 3.7% (203,885) |
12:00 p.m. to 3:59 p.m. - Females:
| Richland: | 18.0% (14) |
| Texas: | 5.9% (322,799) |
4:00 p.m. to 11:59 p.m. - Females:
| Richland: | 2.6% (2) |
| Texas: | 6.2% (341,122) |
Travel time to work
Percentage of workers working in this county: 73.2%
Number of people working at home: 6 (4.7% of all workers)
Number of people working at home: 6 (4.7% of all workers)
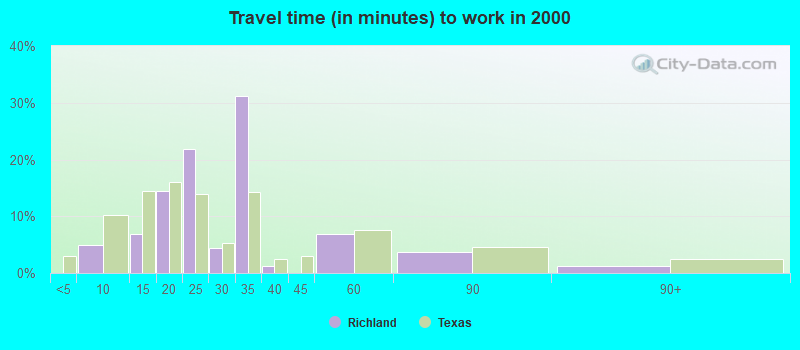
5 to 9 minutes:
| Richland: | 5.0% (8) |
| Texas: | 10.3% (942,891) |
10 to 14 minutes:
| Richland: | 6.9% (11) |
| Texas: | 14.4% (1,317,555) |
15 to 19 minutes:
| Richland: | 14.4% (23) |
| Texas: | 16.0% (1,467,945) |
20 to 24 minutes:
| Richland: | 21.9% (35) |
| Texas: | 13.9% (1,276,781) |
25 to 29 minutes:
| Richland: | 4.4% (7) |
| Texas: | 5.3% (482,838) |
30 to 34 minutes:
| Richland: | 31.2% (50) |
| Texas: | 14.3% (1,309,699) |
35 to 39 minutes:
| Richland: | 1.2% (2) |
| Texas: | 2.4% (219,873) |
45 to 59 minutes:
| Richland: | 6.9% (11) |
| Texas: | 7.6% (692,006) |
60 to 89 minutes:
| Richland: | 3.8% (6) |
| Texas: | 4.6% (418,905) |
90 or more minutes:
| Richland: | 1.2% (2) |
| Texas: | 2.4% (218,800) |
Means of transportation to work
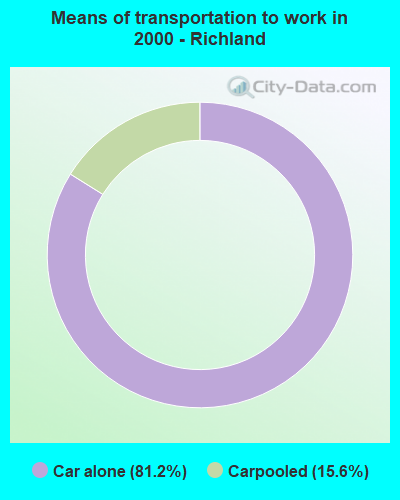

Drove car alone:
| Richland: | 81.2% (130) |
| Texas: | 77.7% (7,115,590) |
Carpooled:
| Richland: | 15.6% (25) |
| Texas: | 14.5% (1,326,012) |
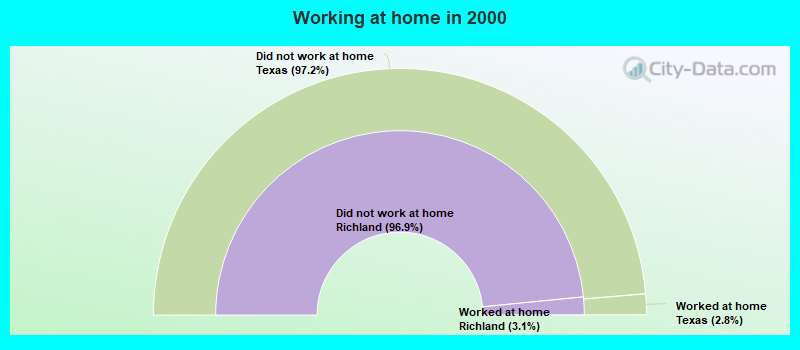
Private vehicle occupancy
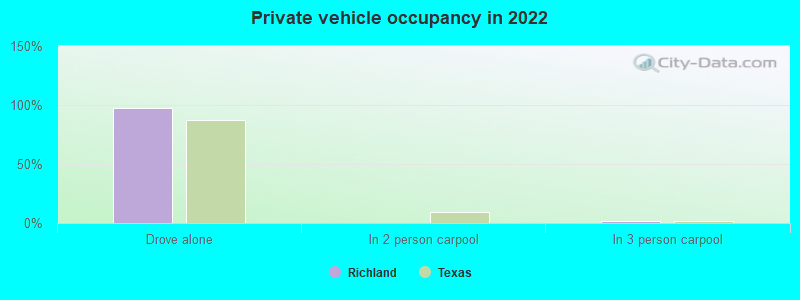
Drove alone:
| Richland: | 97.2% (112) |
| Texas: | 87.6% (10,283,021) |
In 3 person carpool:
| Richland: | 2.0% (2) |
| Texas: | 2.1% (244,139) |
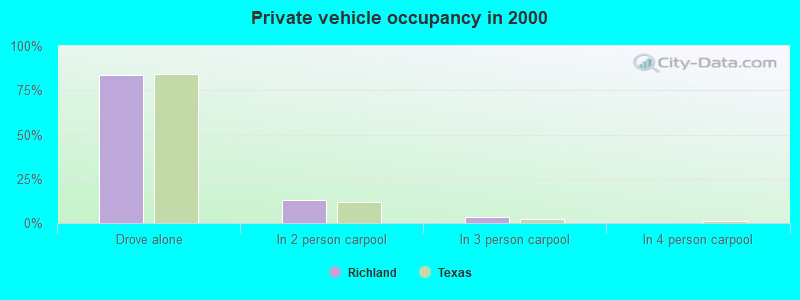
Drove alone:
| Richland: | 83.9% (130) |
| Texas: | 84.3% (7,115,590) |
In 2 person carpool:
| Richland: | 12.9% (20) |
| Texas: | 11.6% (982,994) |
In 3 person carpool:
| Richland: | 3.2% (5) |
| Texas: | 2.4% (201,602) |
Class of workers
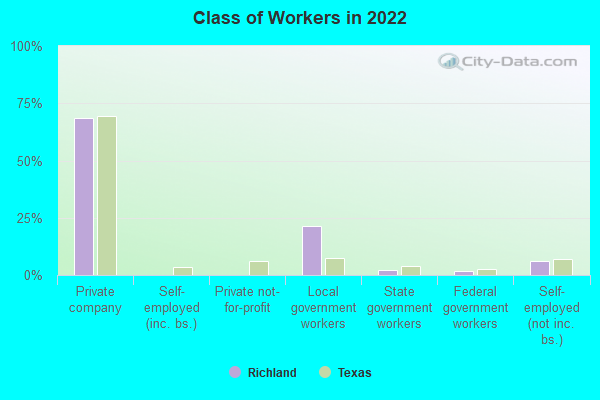
Employee of private company:
| Richland: | 68.5% (91) |
| Texas: | 69.6% (10,139,666) |
Local government workers:
| Richland: | 21.3% (28) |
| Texas: | 7.6% (1,109,799) |
State government workers:
| Richland: | 2.4% (3) |
| Texas: | 3.8% (558,618) |
Federal government workers:
| Richland: | 1.6% (2) |
| Texas: | 2.5% (357,298) |
Self-employed workers in own not incorporated business:
| Richland: | 6.3% (8) |
| Texas: | 6.8% (998,270) |
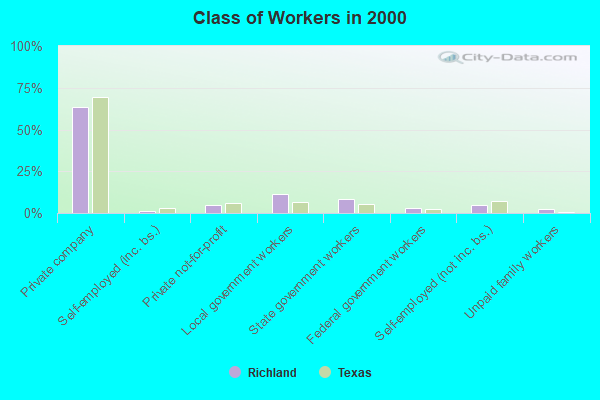
Employee of private company:
| Richland: | 63.4% (104) |
| Texas: | 69.6% (6,425,274) |
Self-employed in own incorporated business:
| Richland: | 1.2% (2) |
| Texas: | 2.7% (250,864) |
Private not-for-profit wage and salary workers:
| Richland: | 4.9% (8) |
| Texas: | 5.7% (526,631) |
Local government workers:
| Richland: | 11.6% (19) |
| Texas: | 6.6% (608,479) |
State government workers:
| Richland: | 8.5% (14) |
| Texas: | 5.4% (501,082) |
Federal government workers:
| Richland: | 3.0% (5) |
| Texas: | 2.6% (237,177) |
Self-employed workers in own not incorporated business:
| Richland: | 4.9% (8) |
| Texas: | 7.1% (653,527) |
Unpaid family workers:
| Richland: | 2.4% (4) |
| Texas: | 0.3% (31,338) |
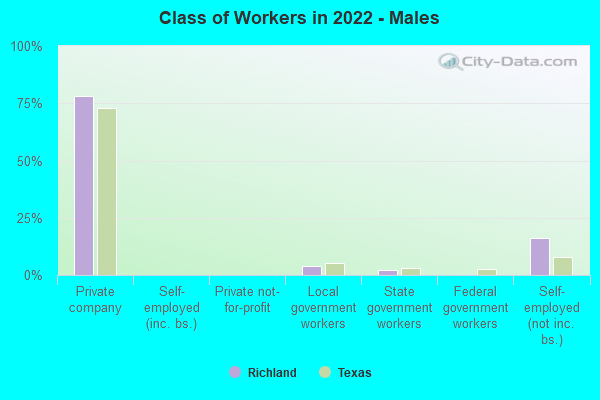
Employee of private company - Males:
| Richland: | 78.0% (41) |
| Texas: | 73.1% (5,788,450) |
Local government workers - Males:
| Richland: | 4.0% (2) |
| Texas: | 5.1% (405,467) |
State government workers - Males:
| Richland: | 2.0% (1) |
| Texas: | 3.0% (236,706) |
Self-employed workers in own not incorporated business - Males:
| Richland: | 16.0% (8) |
| Texas: | 7.7% (609,246) |
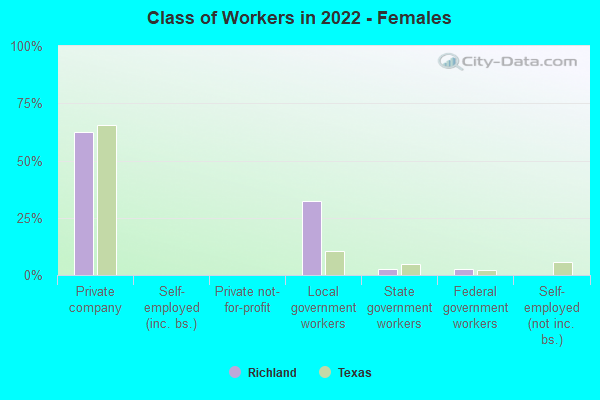
Employee of private company - Females:
| Richland: | 62.3% (50) |
| Texas: | 65.4% (4,351,216) |
Local government workers - Females:
| Richland: | 32.5% (26) |
| Texas: | 10.6% (704,332) |
State government workers - Females:
| Richland: | 2.6% (2) |
| Texas: | 4.8% (321,912) |
Federal government workers - Females:
| Richland: | 2.6% (2) |
| Texas: | 2.2% (145,669) |