Work and Jobs in Roaring Springs, Texas (TX) Detailed Stats
Occupations, Industries, Unemployment, Workers, Commute
Settings
X


Recent posts about work in Roaring Springs, Texas on our local forum with over 2,400,000 registered users:
 | Apartments in Fort Worth (9 replies) |
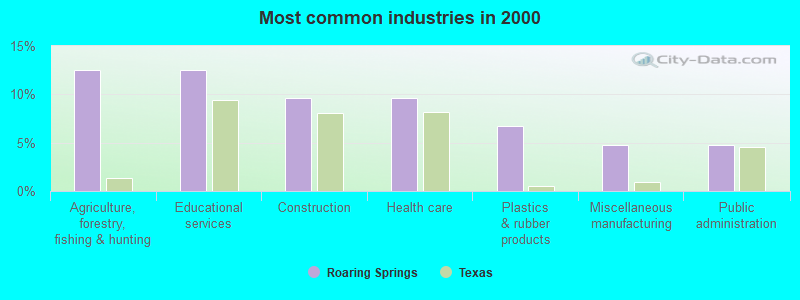
The most common industries in Roaring Springs are: Agriculture, forestry, fishing & hunting (12.5% of civilian employees), Educational services (12.5% of civilian employees), Construction (9.6% of civilian employees). 79.7% of workers work in Motley County and 5.1% of all workers work at home. 59.7% of workers are employees of private companies, which is 16.5% less than the rate of 69.6% across the entire state of Texas.
Whole page based on the data from 2000 / 2022 when the population of Roaring Springs, Texas was 265 / 200
Whole page based on the data from 2000 / 2022 when the population of Roaring Springs, Texas was 265 / 200
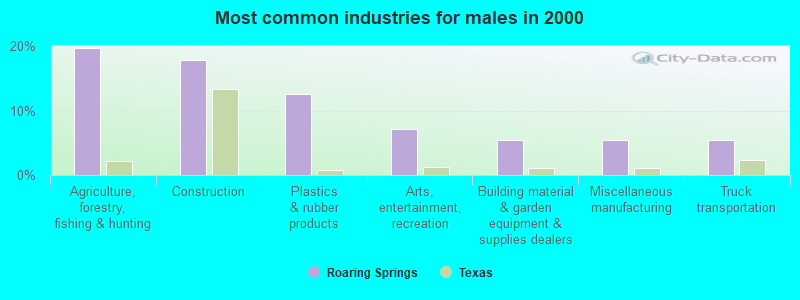
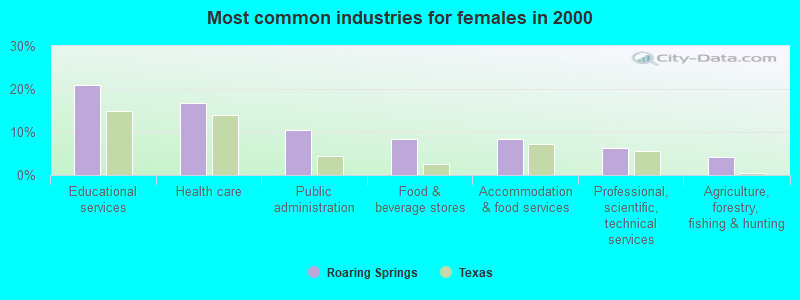
Most common industries
Most common industries | |||
|---|---|---|---|
Industry | All | Males | Females |
| Agriculture, forestry, fishing and hunting | 12.5% (13) | 19.6% (11) | 4.2% (2) |
| Educational services | 12.5% (13) | 5.4% (3) | 20.8% (10) |
| Construction | 9.6% (10) | 17.9% (10) | 0.0% (0) |
| Health care | 9.6% (10) | 3.6% (2) | 16.7% (8) |
| Plastics and rubber products | 6.7% (7) | 12.5% (7) | 0.0% (0) |
| Miscellaneous manufacturing | 4.8% (5) | 5.4% (3) | 4.2% (2) |
| Public administration | 4.8% (5) | 0.0% (0) | 10.4% (5) |
| Food and beverage stores | 3.8% (4) | 0.0% (0) | 8.3% (4) |
| Accommodation and food services | 3.8% (4) | 0.0% (0) | 8.3% (4) |
| Arts, entertainment, and recreation | 3.8% (4) | 7.1% (4) | 0.0% (0) |
| U. S. Postal service | 3.8% (4) | 3.6% (2) | 4.2% (2) |
| Building material and garden equipment and supplies dealers | 2.9% (3) | 5.4% (3) | 0.0% (0) |
| Professional, scientific, and technical services | 2.9% (3) | 0.0% (0) | 6.2% (3) |
| Truck transportation | 2.9% (3) | 5.4% (3) | 0.0% (0) |
| Furniture and home furnishings, and household appliance stores | 1.9% (2) | 3.6% (2) | 0.0% (0) |
| Food | 1.9% (2) | 0.0% (0) | 4.2% (2) |
| Department and other general merchandise stores | 1.9% (2) | 0.0% (0) | 4.2% (2) |
| Gasoline stations | 1.9% (2) | 3.6% (2) | 0.0% (0) |
| Publishing, and motion picture and sound recording industries | 1.9% (2) | 3.6% (2) | 0.0% (0) |
| Administrative and support and waste management services | 1.9% (2) | 0.0% (0) | 4.2% (2) |
| Repair and maintenance | 1.9% (2) | 0.0% (0) | 4.2% (2) |
| Religious, grantmaking, civic, professional, and similar organizations | 1.9% (2) | 3.6% (2) | 0.0% (0) |
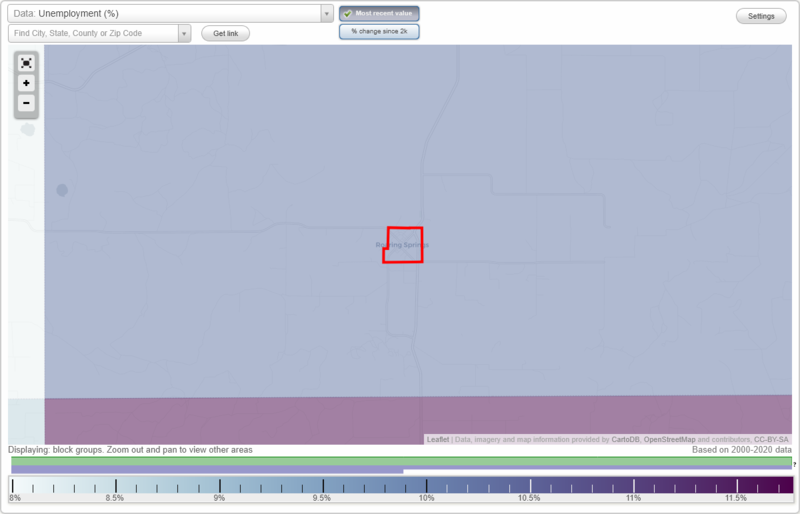
Unemployment in Roaring Springs
- Unemployment by race in 2000
- Unemployment rate for White non-Hispanic residents
- 5.3%Males
Time leaving home to go to work
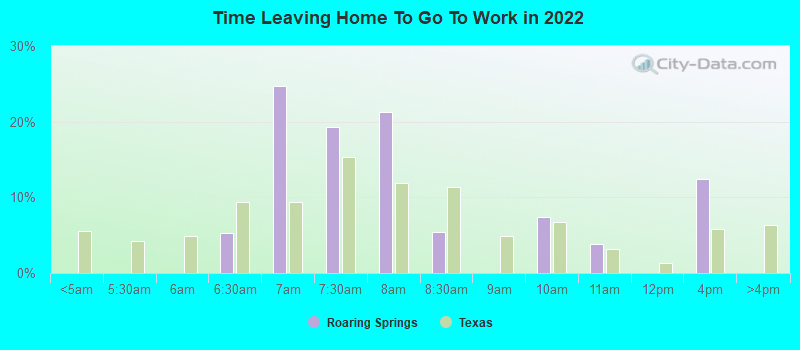
6:00 a.m. to 6:29 a.m.:
| Roaring Springs: | 5.3% (3) |
| Texas: | 9.4% (1,155,020) |
6:30 a.m. to 6:59 a.m.:
| Roaring Springs: | 24.7% (14) |
| Texas: | 9.3% (1,152,822) |
7:00 a.m. to 7:29 a.m.:
| Roaring Springs: | 19.3% (11) |
| Texas: | 15.3% (1,885,477) |
7:30 a.m. to 7:59 a.m.:
| Roaring Springs: | 21.3% (12) |
| Texas: | 11.9% (1,469,628) |
8:00 a.m. to 8:29 a.m.:
| Roaring Springs: | 5.5% (3) |
| Texas: | 11.3% (1,400,175) |
9:00 a.m. to 9:59 a.m.:
| Roaring Springs: | 7.3% (4) |
| Texas: | 6.7% (829,367) |
10:00 a.m. to 10:59 a.m.:
| Roaring Springs: | 3.8% (2) |
| Texas: | 3.2% (390,354) |
12:00 p.m. to 3:59 p.m.:
| Roaring Springs: | 12.4% (7) |
| Texas: | 5.8% (720,594) |
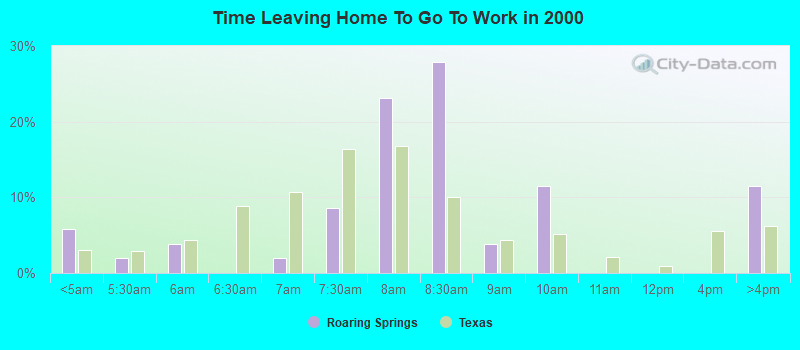
<5am:
| Roaring Springs: | 5.8% (6) |
| Texas: | 3.1% (281,361) |
5:30am:
| Roaring Springs: | 1.9% (2) |
| Texas: | 2.9% (262,060) |
6am:
| Roaring Springs: | 3.8% (4) |
| Texas: | 4.4% (403,423) |
7am:
| Roaring Springs: | 1.9% (2) |
| Texas: | 10.7% (976,557) |
7:30am:
| Roaring Springs: | 8.7% (9) |
| Texas: | 16.4% (1,500,904) |
8am:
| Roaring Springs: | 23.1% (24) |
| Texas: | 16.8% (1,536,308) |
8:30am:
| Roaring Springs: | 27.9% (29) |
| Texas: | 10.0% (913,601) |
9am:
| Roaring Springs: | 3.8% (4) |
| Texas: | 4.4% (398,656) |
10am:
| Roaring Springs: | 11.5% (12) |
| Texas: | 5.2% (472,592) |
>4pm:
| Roaring Springs: | 11.5% (12) |
| Texas: | 6.1% (563,107) |
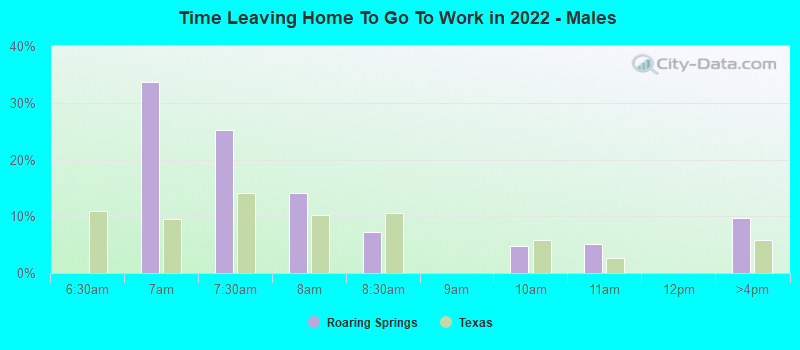
6:30 a.m. to 6:59 a.m. - Males:
| Roaring Springs: | 33.6% (14) |
| Texas: | 9.5% (652,306) |
7:00 a.m. to 7:29 a.m. - Males:
| Roaring Springs: | 25.3% (11) |
| Texas: | 14.1% (970,598) |
7:30 a.m. to 7:59 a.m. - Males:
| Roaring Springs: | 14.1% (6) |
| Texas: | 10.2% (696,429) |
8:00 a.m. to 8:29 a.m. - Males:
| Roaring Springs: | 7.2% (3) |
| Texas: | 10.6% (729,041) |
9:00 a.m. to 9:59 a.m. - Males:
| Roaring Springs: | 4.8% (2) |
| Texas: | 5.8% (401,071) |
10:00 a.m. to 10:59 a.m. - Males:
| Roaring Springs: | 5.1% (2) |
| Texas: | 2.7% (186,469) |
12:00 p.m. to 3:59 p.m. - Males:
| Roaring Springs: | 9.7% (4) |
| Texas: | 5.8% (397,795) |
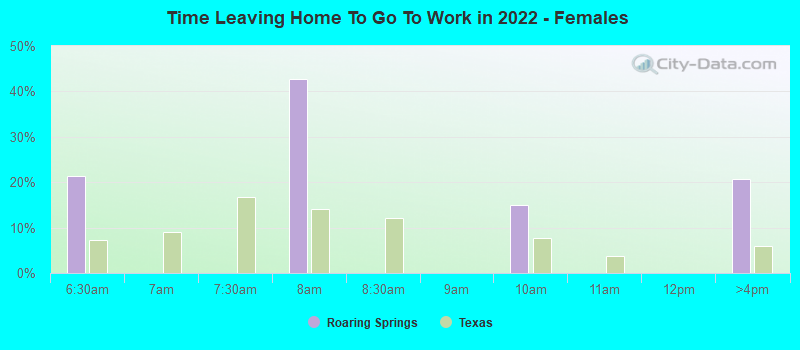
6:00 a.m. to 6:29 a.m. - Females:
| Roaring Springs: | 21.3% (3) |
| Texas: | 7.4% (403,902) |
7:30 a.m. to 7:59 a.m. - Females:
| Roaring Springs: | 42.7% (6) |
| Texas: | 14.1% (773,199) |
9:00 a.m. to 9:59 a.m. - Females:
| Roaring Springs: | 14.9% (2) |
| Texas: | 7.8% (428,296) |
12:00 p.m. to 3:59 p.m. - Females:
| Roaring Springs: | 20.6% (3) |
| Texas: | 5.9% (322,799) |
Travel time to work
Percentage of workers working in this county: 79.7%
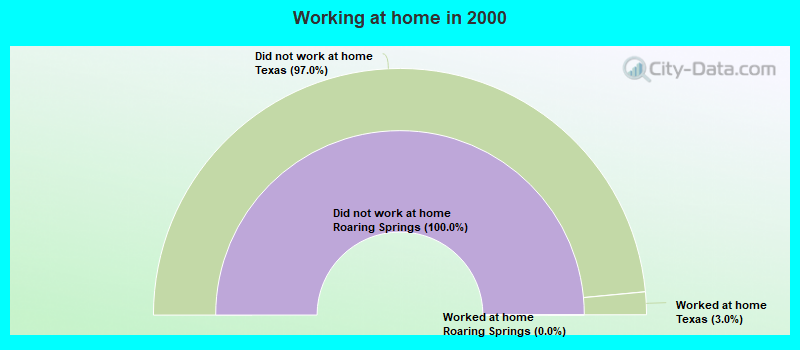
Number of people working at home: 3 (5.1% of all workers)
Number of people working at home: 3 (5.1% of all workers)
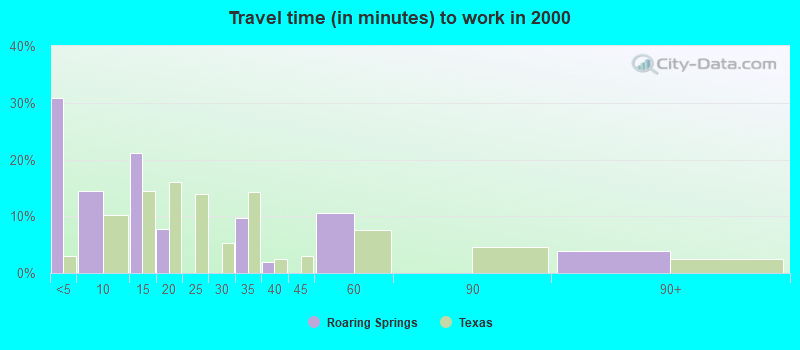
Less than 5 minutes:
| Roaring Springs: | 30.8% (32) |
| Texas: | 3.0% (277,642) |
5 to 9 minutes:
| Roaring Springs: | 14.4% (15) |
| Texas: | 10.3% (942,891) |
10 to 14 minutes:
| Roaring Springs: | 21.2% (22) |
| Texas: | 14.4% (1,317,555) |
15 to 19 minutes:
| Roaring Springs: | 7.7% (8) |
| Texas: | 16.0% (1,467,945) |
30 to 34 minutes:
| Roaring Springs: | 9.6% (10) |
| Texas: | 14.3% (1,309,699) |
35 to 39 minutes:
| Roaring Springs: | 1.9% (2) |
| Texas: | 2.4% (219,873) |
45 to 59 minutes:
| Roaring Springs: | 10.6% (11) |
| Texas: | 7.6% (692,006) |
90 or more minutes:
| Roaring Springs: | 3.8% (4) |
| Texas: | 2.4% (218,800) |
Means of transportation to work
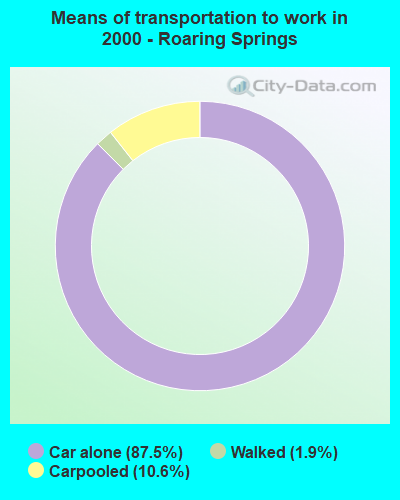

Drove car alone:
| Roaring Springs: | 87.5% (91) |
| Texas: | 77.7% (7,115,590) |
Carpooled:
| Roaring Springs: | 10.6% (11) |
| Texas: | 14.5% (1,326,012) |
Walked:
| Roaring Springs: | 1.9% (2) |
| Texas: | 1.9% (173,670) |
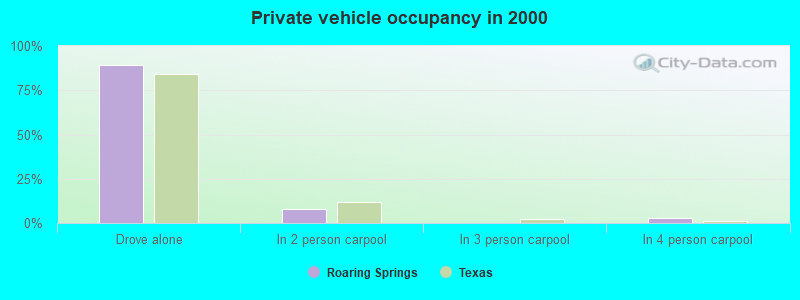
Private vehicle occupancy
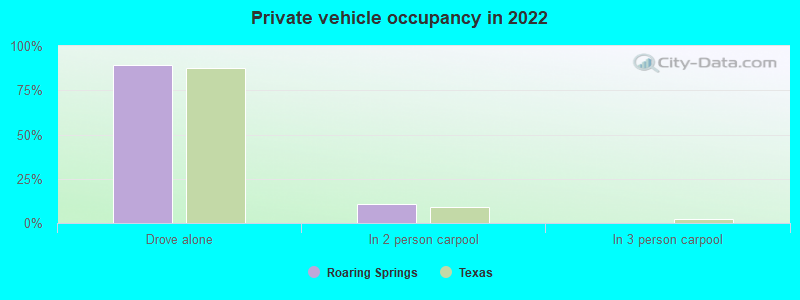
Drove alone:
| Roaring Springs: | 89.3% (46) |
| Texas: | 87.6% (10,283,021) |
In 2 person carpool:
| Roaring Springs: | 10.5% (5) |
| Texas: | 9.0% (1,052,595) |
Drove alone:
| Roaring Springs: | 89.2% (91) |
| Texas: | 84.3% (7,115,590) |
In 2 person carpool:
| Roaring Springs: | 7.8% (8) |
| Texas: | 11.6% (982,994) |
In 4 person carpool:
| Roaring Springs: | 2.9% (3) |
| Texas: | 1.0% (83,518) |
Class of workers
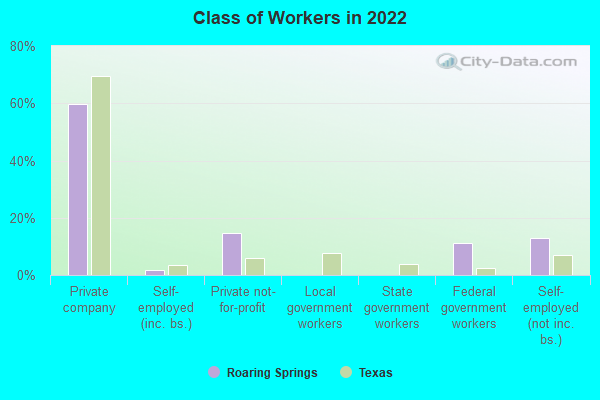
Employee of private company:
| Roaring Springs: | 59.7% (39) |
| Texas: | 69.6% (10,139,666) |
Self-employed in own incorporated business:
| Roaring Springs: | 1.6% (1) |
| Texas: | 3.5% (516,446) |
Private not-for-profit wage and salary workers:
| Roaring Springs: | 14.5% (9) |
| Texas: | 6.0% (870,454) |
Federal government workers:
| Roaring Springs: | 11.3% (7) |
| Texas: | 2.5% (357,298) |
Self-employed workers in own not incorporated business:
| Roaring Springs: | 12.9% (8) |
| Texas: | 6.8% (998,270) |
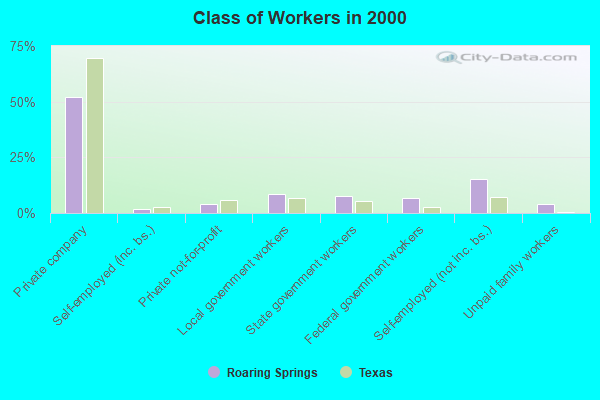
Employee of private company:
| Roaring Springs: | 51.9% (54) |
| Texas: | 69.6% (6,425,274) |
Self-employed in own incorporated business:
| Roaring Springs: | 1.9% (2) |
| Texas: | 2.7% (250,864) |
Private not-for-profit wage and salary workers:
| Roaring Springs: | 3.8% (4) |
| Texas: | 5.7% (526,631) |
Local government workers:
| Roaring Springs: | 8.7% (9) |
| Texas: | 6.6% (608,479) |
State government workers:
| Roaring Springs: | 7.7% (8) |
| Texas: | 5.4% (501,082) |
Federal government workers:
| Roaring Springs: | 6.7% (7) |
| Texas: | 2.6% (237,177) |
Self-employed workers in own not incorporated business:
| Roaring Springs: | 15.4% (16) |
| Texas: | 7.1% (653,527) |
Unpaid family workers:
| Roaring Springs: | 3.8% (4) |
| Texas: | 0.3% (31,338) |
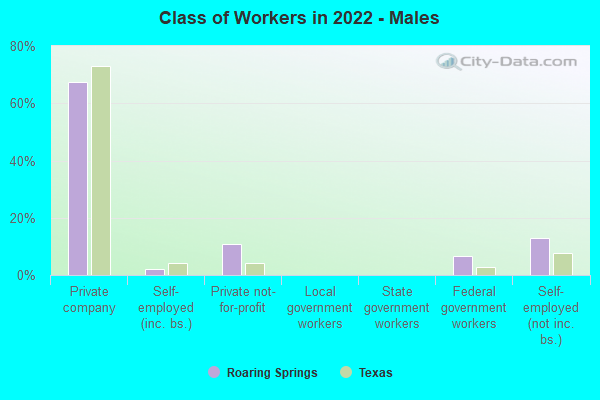
Employee of private company - Males:
| Roaring Springs: | 67.4% (32) |
| Texas: | 73.1% (5,788,450) |
Self-employed in own incorporated business - Males:
| Roaring Springs: | 2.2% (1) |
| Texas: | 4.2% (332,655) |
Private not-for-profit wage and salary workers - Males:
| Roaring Springs: | 10.9% (5) |
| Texas: | 4.1% (323,476) |
Federal government workers - Males:
| Roaring Springs: | 6.5% (3) |
| Texas: | 2.7% (211,629) |
Self-employed workers in own not incorporated business - Males:
| Roaring Springs: | 13.0% (6) |
| Texas: | 7.7% (609,246) |
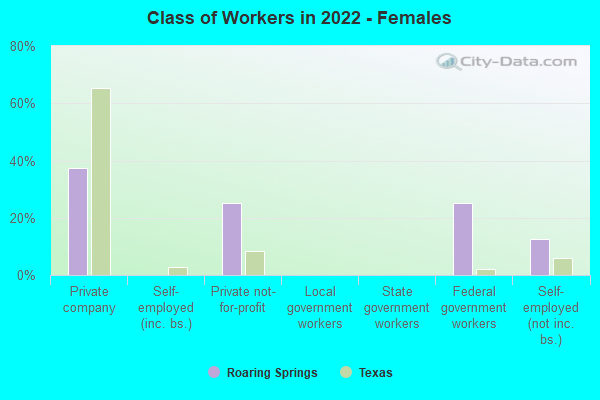
Employee of private company - Females:
| Roaring Springs: | 37.5% (6) |
| Texas: | 65.4% (4,351,216) |
Private not-for-profit wage and salary workers - Females:
| Roaring Springs: | 25.0% (4) |
| Texas: | 8.2% (546,978) |
Federal government workers - Females:
| Roaring Springs: | 25.0% (4) |
| Texas: | 2.2% (145,669) |
Self-employed workers in own not incorporated business - Females:
| Roaring Springs: | 12.5% (2) |
| Texas: | 5.8% (389,024) |