Work and Jobs in Rush, New York (NY) Detailed Stats
Occupations, Industries, Unemployment, Workers, Commute

Recent posts about work in Rush, New York on our local forum with over 2,400,000 registered users:
 | Rochester-Boom or Bust (724 replies) |
| Bullish or Bearish on the City of Rochester? (75 replies) |
| Can you help me pick a new work location/area to live? (16 replies) |
| I want to settle in Rochester. Would like some help/insight. (30 replies) |
| Amazon HQ2 back in play? (21 replies) |
| is half this city unsafe to live? (20 replies) |
Latest news about work in Rush, NY collected exclusively by city-data.com from local newspapers, TV, and radio stations
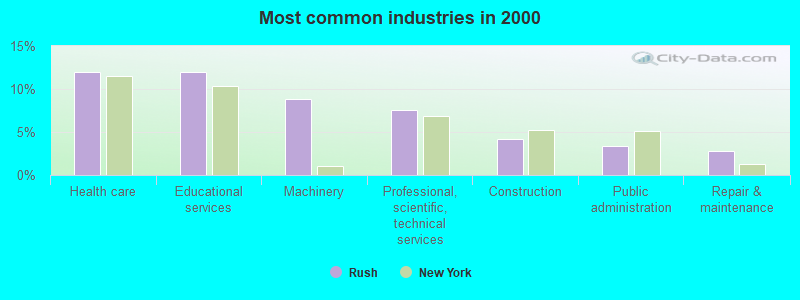
The most common industries in Rush are: Health care (12.0% of civilian employees), Educational services (12.0% of civilian employees), Machinery (8.8% of civilian employees). 64.9% of workers are employees of private companies, which is about the same as the rate of 63.7% across the entire state of New York.
Most common industries
Most common industries | |||
|---|---|---|---|
Industry | All | Males | Females |
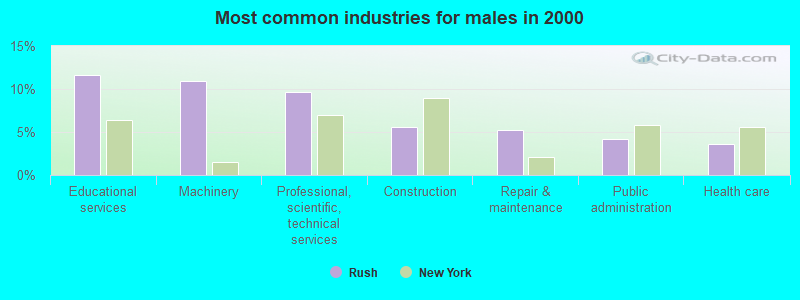
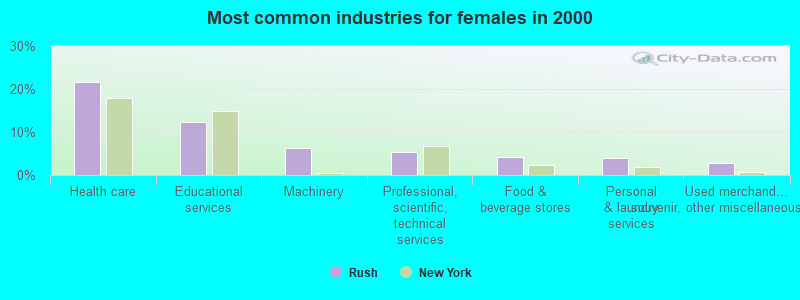
| Health care | 12.0% (221) | 3.6% (35) | 21.5% (186) |
| Educational services | 12.0% (220) | 11.6% (113) | 12.4% (107) |
| Machinery | 8.8% (162) | 11.0% (107) | 6.4% (55) |
| Professional, scientific, and technical services | 7.6% (140) | 9.6% (94) | 5.3% (46) |
| Construction | 4.2% (77) | 5.5% (54) | 2.7% (23) |
| Public administration | 3.4% (62) | 4.2% (41) | 2.4% (21) |
| Repair and maintenance | 2.8% (51) | 5.2% (51) | 0.0% (0) |
| Food and beverage stores | 2.6% (47) | 1.0% (10) | 4.3% (37) |
| U. S. Postal service | 2.4% (45) | 2.7% (26) | 2.2% (19) |
| Administrative and support and waste management services | 2.3% (42) | 2.4% (23) | 2.2% (19) |
| Metal and metal products | 2.3% (42) | 3.2% (31) | 1.3% (11) |
| Accommodation and food services | 2.1% (38) | 1.9% (19) | 2.2% (19) |
| Truck transportation | 2.0% (37) | 3.1% (30) | 0.8% (7) |
| Religious, grantmaking, civic, professional, and similar organizations | 2.0% (36) | 2.0% (20) | 1.9% (16) |
| Personal and laundry services | 1.9% (35) | 0.0% (0) | 4.1% (35) |
| Used merchandise, gift, novelty, and souvenir, and other miscellaneous stores | 1.8% (33) | 0.8% (8) | 2.9% (25) |
| Finance and insurance | 1.7% (32) | 2.8% (27) | 0.6% (5) |
| Professional and commercial equipment and supplies merchant wholesalers | 1.5% (28) | 2.9% (28) | 0.0% (0) |
| Building material and garden equipment and supplies dealers | 1.5% (28) | 1.7% (17) | 1.3% (11) |
| Miscellaneous manufacturing | 1.4% (25) | 0.6% (6) | 2.2% (19) |
| Data processing, libraries, and other information services | 1.3% (24) | 1.5% (15) | 1.0% (9) |
| Utilities | 1.3% (24) | 1.6% (16) | 0.9% (8) |
| Other transportation, and support activities, and couriers | 1.3% (24) | 1.6% (16) | 0.9% (8) |
| Electrical and electronic goods merchant wholesalers | 1.2% (23) | 0.9% (9) | 1.6% (14) |
| Social assistance | 1.2% (23) | 0.4% (4) | 2.2% (19) |
| Chemicals | 1.0% (19) | 1.2% (12) | 0.8% (7) |
| Department and other general merchandise stores | 1.0% (19) | 0.6% (6) | 1.5% (13) |
| Food | 1.0% (19) | 1.1% (11) | 0.9% (8) |
| Real estate and rental and leasing | 1.0% (19) | 1.1% (11) | 0.9% (8) |
| Clothing and accessories, including shoe, stores | 1.0% (18) | 1.5% (15) | 0.3% (3) |
| Plastics and rubber products | 0.8% (15) | 0.0% (0) | 1.7% (15) |
| Arts, entertainment, and recreation | 0.8% (15) | 0.6% (6) | 1.0% (9) |
| Machinery, equipment, and supplies merchant wholesalers | 0.8% (15) | 0.8% (8) | 0.8% (7) |
| Agriculture, forestry, fishing and hunting | 0.8% (14) | 1.4% (14) | 0.0% (0) |
| Publishing, and motion picture and sound recording industries | 0.8% (14) | 1.4% (14) | 0.0% (0) |
| Paper and paper products merchant wholesalers | 0.7% (13) | 0.0% (0) | 1.5% (13) |
| Computer and electronic products | 0.7% (12) | 0.7% (7) | 0.6% (5) |
| Paper | 0.6% (11) | 0.7% (7) | 0.5% (4) |
| Printing and related support activities | 0.6% (11) | 0.6% (6) | 0.6% (5) |
| Sporting goods, camera, and hobby and toy stores | 0.6% (11) | 0.6% (6) | 0.6% (5) |
| Transportation equipment | 0.5% (10) | 1.0% (10) | 0.0% (0) |
| Music stores | 0.4% (8) | 0.8% (8) | 0.0% (0) |
| Petroleum and petroleum products merchant wholesalers | 0.4% (7) | 0.7% (7) | 0.0% (0) |
| Groceries and related products merchant wholesalers | 0.4% (7) | 0.7% (7) | 0.0% (0) |
| Office supplies and stationery stores | 0.3% (6) | 0.6% (6) | 0.0% (0) |
| Jewelry, luggage, and leather goods stores | 0.3% (6) | 0.0% (0) | 0.7% (6) |
| Motor vehicle and parts dealers | 0.3% (6) | 0.6% (6) | 0.0% (0) |
| Other direct selling establishments | 0.3% (6) | 0.0% (0) | 0.7% (6) |
| Rail transportation | 0.3% (6) | 0.6% (6) | 0.0% (0) |
| Broadcasting and telecommunications | 0.3% (6) | 0.0% (0) | 0.7% (6) |
| Furniture and home furnishings, and household appliance stores | 0.3% (5) | 0.0% (0) | 0.6% (5) |
| Pharmacies and drug stores | 0.3% (5) | 0.0% (0) | 0.6% (5) |
| Air transportation | 0.3% (5) | 0.0% (0) | 0.6% (5) |
| Warehousing and storage | 0.3% (5) | 0.0% (0) | 0.6% (5) |
| Miscellaneous durable goods merchant wholesalers | 0.3% (5) | 0.0% (0) | 0.6% (5) |
| Gasoline stations | 0.2% (3) | 0.3% (3) | 0.0% (0) |
Unemployment in Rush
- Unemployment by race in 2000
- Unemployment rate for White non-Hispanic residents
- 3.2%Males
- 1.4%Females
Time leaving home to go to work
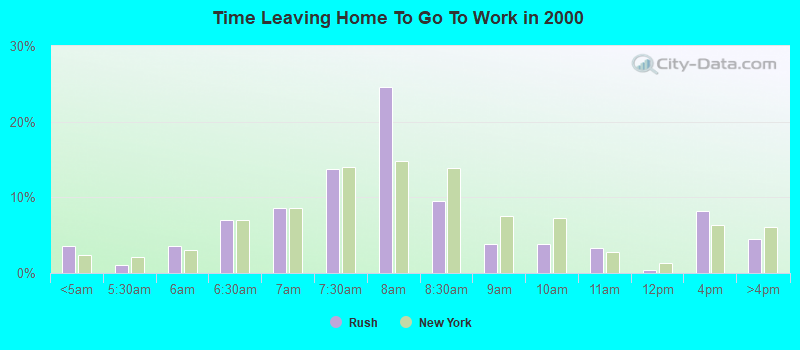
<5am:
| Rush: | 3.5% (63) |
| New York: | 2.4% (194,562) |
5:30am:
| Rush: | 1.0% (18) |
| New York: | 2.1% (174,328) |
6am:
| Rush: | 3.5% (63) |
| New York: | 3.1% (253,826) |
6:30am:
| Rush: | 7.0% (124) |
| New York: | 7.0% (573,349) |
7am:
| Rush: | 8.6% (153) |
| New York: | 8.6% (706,982) |
7:30am:
| Rush: | 13.7% (245) |
| New York: | 14.0% (1,147,579) |
8am:
| Rush: | 24.6% (438) |
| New York: | 14.8% (1,213,706) |
8:30am:
| Rush: | 9.5% (169) |
| New York: | 13.9% (1,144,298) |
9am:
| Rush: | 3.9% (69) |
| New York: | 7.5% (614,475) |
10am:
| Rush: | 3.8% (68) |
| New York: | 7.2% (593,377) |
11am:
| Rush: | 3.4% (60) |
| New York: | 2.7% (224,011) |
12pm:
| Rush: | 0.3% (6) |
| New York: | 1.3% (105,049) |
4pm:
| Rush: | 8.1% (145) |
| New York: | 6.3% (517,309) |
>4pm:
| Rush: | 4.5% (80) |
| New York: | 6.1% (501,196) |
Travel time to work
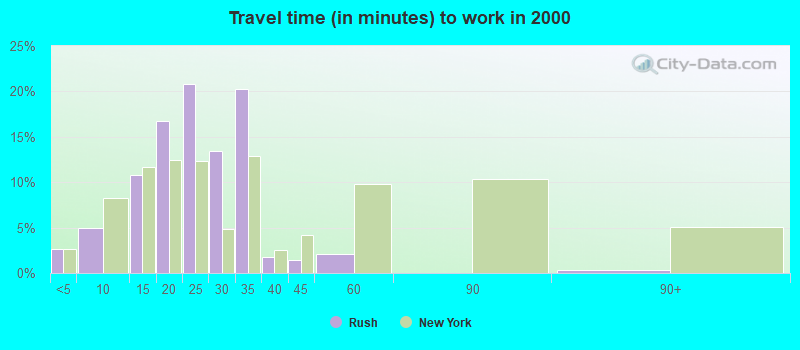
Less than 5 minutes:
| Rush: | 2.6% (47) |
| New York: | 2.7% (219,036) |
5 to 9 minutes:
| Rush: | 5.0% (89) |
| New York: | 8.3% (680,270) |
10 to 14 minutes:
| Rush: | 10.8% (193) |
| New York: | 11.6% (956,590) |
15 to 19 minutes:
| Rush: | 16.8% (299) |
| New York: | 12.4% (1,020,084) |
20 to 24 minutes:
| Rush: | 20.8% (371) |
| New York: | 12.3% (1,013,757) |
25 to 29 minutes:
| Rush: | 13.5% (240) |
| New York: | 4.9% (399,384) |
30 to 34 minutes:
| Rush: | 20.2% (361) |
| New York: | 12.9% (1,058,688) |
35 to 39 minutes:
| Rush: | 1.8% (32) |
| New York: | 2.5% (203,722) |
40 to 44 minutes:
| Rush: | 1.5% (26) |
| New York: | 4.1% (340,311) |
45 to 59 minutes:
| Rush: | 2.1% (38) |
| New York: | 9.8% (806,556) |
90 or more minutes:
| Rush: | 0.3% (5) |
| New York: | 5.1% (417,464) |
Means of transportation to work
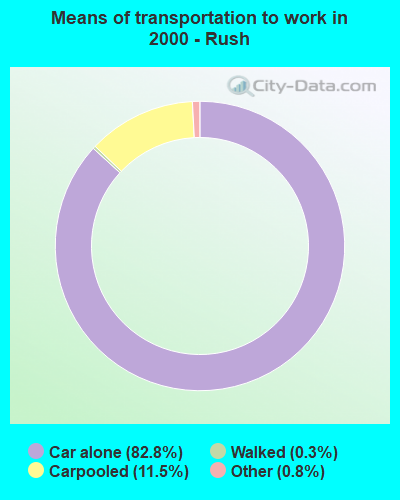

Drove car alone:
| Rush: | 82.8% (1,477) |
| New York: | 56.3% (4,620,178) |
Carpooled:
| Rush: | 11.5% (205) |
| New York: | 9.2% (756,918) |
Walked:
| Rush: | 0.3% (5) |
| New York: | 6.2% (511,721) |
Other means:
| Rush: | 0.8% (14) |
| New York: | 0.5% (40,375) |
Private vehicle occupancy
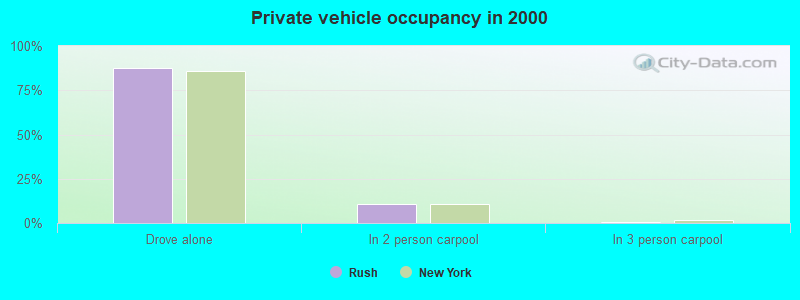
Drove alone:
| Rush: | 87.8% (1,477) |
| New York: | 85.9% (4,620,178) |
In 2 person carpool:
| Rush: | 10.5% (177) |
| New York: | 11.0% (590,255) |
In 3 person carpool:
| Rush: | 0.5% (8) |
| New York: | 1.8% (96,470) |
In 4 person carpool:
| Rush: | 0.7% (11) |
| New York: | 0.7% (36,112) |
In 5-6 person carpool:
| Rush: | 0.5% (9) |
| New York: | 0.3% (16,644) |
Class of workers
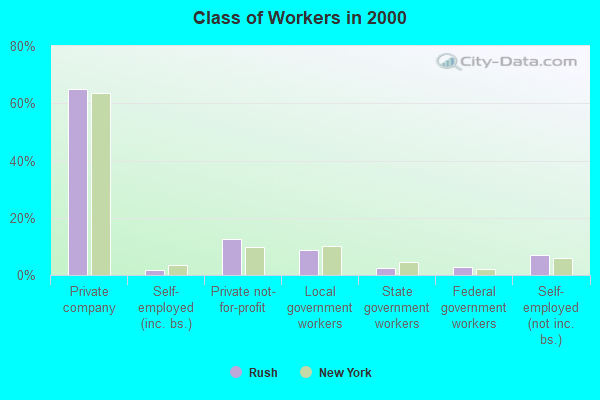
Employee of private company:
| Rush: | 64.9% (1,194) |
| New York: | 63.7% (5,340,134) |
Self-employed in own incorporated business:
| Rush: | 1.8% (33) |
| New York: | 3.4% (283,619) |
Private not-for-profit wage and salary workers:
| Rush: | 12.4% (229) |
| New York: | 9.7% (810,356) |
Local government workers:
| Rush: | 8.8% (161) |
| New York: | 10.2% (858,120) |
State government workers:
| Rush: | 2.5% (46) |
| New York: | 4.6% (383,673) |
Federal government workers:
| Rush: | 2.8% (51) |
| New York: | 2.2% (185,100) |
Self-employed workers in own not incorporated business:
| Rush: | 6.8% (126) |
| New York: | 6.0% (501,068) |

Employee of private company - Males:
| Rush: | 67.0% (654) |
| New York: | 66.2% (2,902,064) |
Self-employed in own incorporated business - Males:
| Rush: | 1.8% (18) |
| New York: | 4.9% (215,651) |
Private not-for-profit wage and salary workers - Males:
| Rush: | 7.4% (72) |
| New York: | 6.3% (277,787) |
Local government workers - Males:
| Rush: | 9.7% (95) |
| New York: | 8.7% (380,426) |
State government workers - Males:
| Rush: | 2.8% (27) |
| New York: | 4.1% (181,784) |
Federal government workers - Males:
| Rush: | 2.7% (26) |
| New York: | 2.3% (102,647) |
Self-employed workers in own not incorporated business - Males:
| Rush: | 8.6% (84) |
| New York: | 7.1% (312,497) |
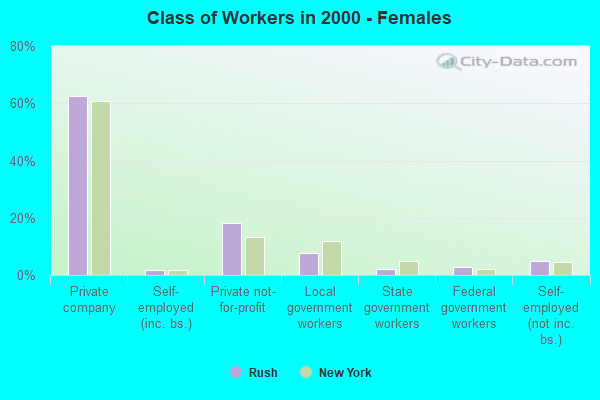
Employee of private company - Females:
| Rush: | 62.5% (540) |
| New York: | 60.9% (2,438,070) |
Self-employed in own incorporated business - Females:
| Rush: | 1.7% (15) |
| New York: | 1.7% (67,968) |
Private not-for-profit wage and salary workers - Females:
| Rush: | 18.2% (157) |
| New York: | 13.3% (532,569) |
Local government workers - Females:
| Rush: | 7.6% (66) |
| New York: | 11.9% (477,694) |
State government workers - Females:
| Rush: | 2.2% (19) |
| New York: | 5.0% (201,889) |
Federal government workers - Females:
| Rush: | 2.9% (25) |
| New York: | 2.1% (82,453) |
Self-employed workers in own not incorporated business - Females:
| Rush: | 4.9% (42) |
| New York: | 4.7% (188,571) |