Work and Jobs in San Luis Obispo, California (CA) Detailed Stats
Occupations, Industries, Unemployment, Workers, Commute
Settings
X


Recent posts about work in San Luis Obispo, California on our local forum with over 2,400,000 registered users:

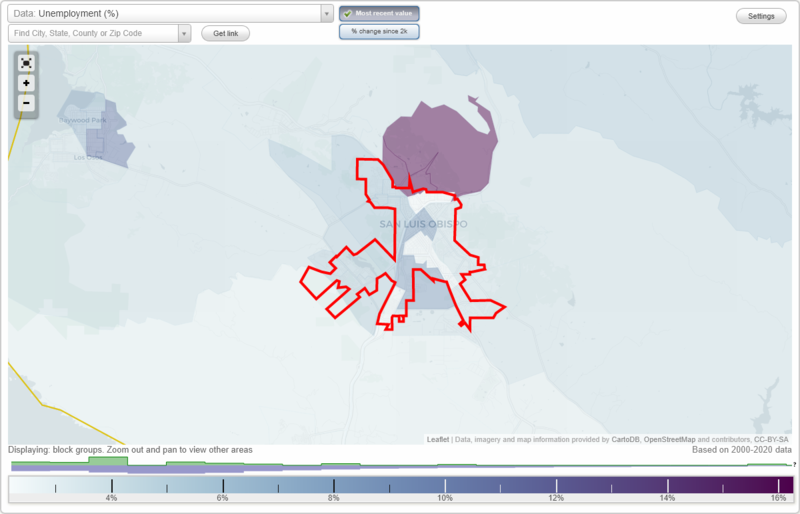
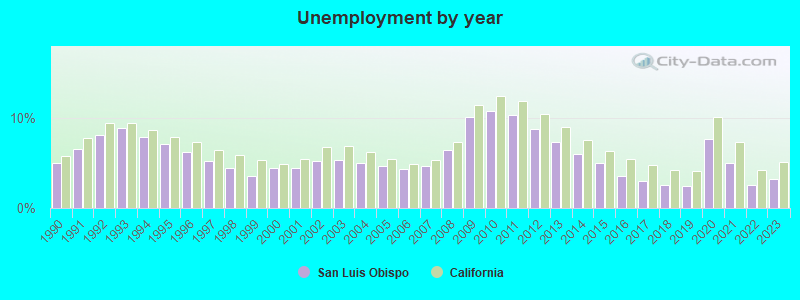
The unemployment rate in 2023 in San Luis Obispo, CA was 3.2%, which was 59.4% less than the unemployment rate of 5.1% across the entire state of California. Compared to the unemployment rate of 7.3% in 2013, this represents a decrease of 128.1%. The most common industries in San Luis Obispo are: Educational services (14.7% of civilian employees), Accommodation & food services (13.6% of civilian employees), Professional, scientific, technical services (8.2% of civilian employees). 94.4% of workers work in San Luis Obispo County and 14.0% of all workers work at home. 63.3% of workers are employees of private companies, which is 5.1% less than the rate of 66.5% across the entire state of California.
Whole page based on the data from 2000 / 2022 when the population of San Luis Obispo, California was 44,174 / 47,580
Whole page based on the data from 2000 / 2022 when the population of San Luis Obispo, California was 44,174 / 47,580
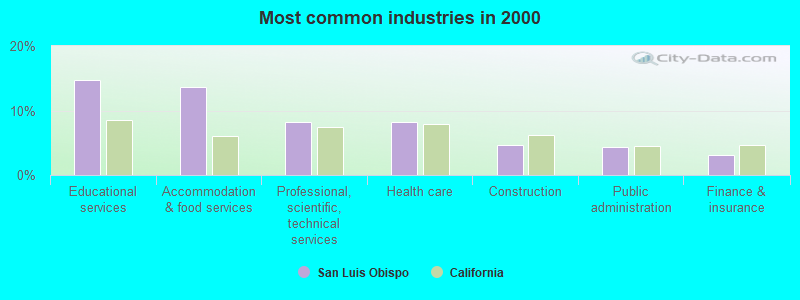
Most common industries
Most common industries | |||
|---|---|---|---|
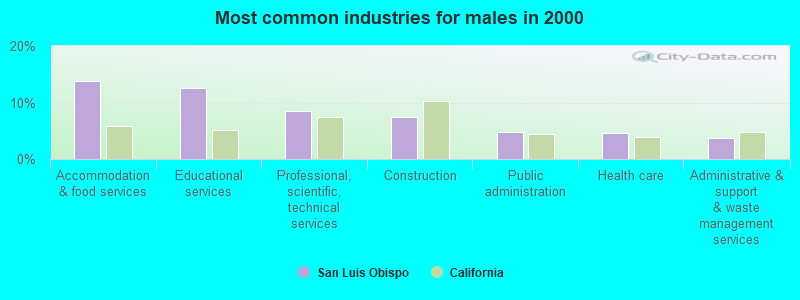
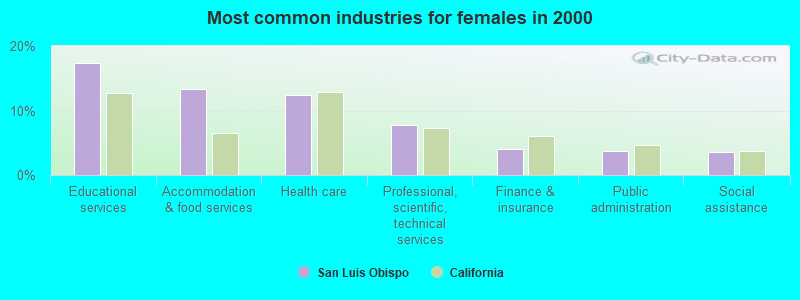
Industry | All | Males | Females |
| Educational services | 14.7% (3,245) | 12.5% (1,506) | 17.3% (1,739) |
| Accommodation and food services | 13.6% (3,005) | 13.8% (1,658) | 13.4% (1,347) |
| Professional, scientific, and technical services | 8.2% (1,806) | 8.5% (1,021) | 7.8% (785) |
| Health care | 8.2% (1,801) | 4.6% (552) | 12.4% (1,249) |
| Construction | 4.7% (1,036) | 7.4% (893) | 1.4% (143) |
| Public administration | 4.3% (953) | 4.8% (581) | 3.7% (372) |
| Finance and insurance | 3.1% (689) | 2.3% (278) | 4.1% (411) |
| Administrative and support and waste management services | 2.9% (632) | 3.6% (437) | 1.9% (195) |
| Real estate and rental and leasing | 2.5% (552) | 2.7% (320) | 2.3% (232) |
| Arts, entertainment, and recreation | 2.2% (490) | 2.0% (238) | 2.5% (252) |
| Food and beverage stores | 2.1% (467) | 2.6% (316) | 1.5% (151) |
| Social assistance | 1.9% (421) | 0.5% (58) | 3.6% (363) |
| Religious, grantmaking, civic, professional, and similar organizations | 1.6% (351) | 1.0% (123) | 2.3% (228) |
| Utilities | 1.6% (350) | 2.6% (311) | 0.4% (39) |
| Repair and maintenance | 1.5% (339) | 2.2% (263) | 0.8% (76) |
| Publishing, and motion picture and sound recording industries | 1.4% (318) | 1.4% (172) | 1.5% (146) |
| Data processing, libraries, and other information services | 1.3% (292) | 1.7% (200) | 0.9% (92) |
| Broadcasting and telecommunications | 1.3% (287) | 1.6% (192) | 0.9% (95) |
| Computer and electronic products | 1.1% (252) | 1.6% (192) | 0.6% (60) |
| Personal and laundry services | 1.1% (235) | 0.5% (56) | 1.8% (179) |
| Sporting goods, camera, and hobby and toy stores | 1.0% (230) | 1.2% (149) | 0.8% (81) |
| Miscellaneous manufacturing | 1.0% (227) | 1.1% (136) | 0.9% (91) |
| Department and other general merchandise stores | 1.0% (221) | 0.5% (57) | 1.6% (164) |
| Motor vehicle and parts dealers | 1.0% (216) | 1.5% (176) | 0.4% (40) |
| Radio, TV, and computer stores | 1.0% (211) | 1.2% (149) | 0.6% (62) |
| Building material and garden equipment and supplies dealers | 0.9% (196) | 0.9% (108) | 0.9% (88) |
| Agriculture, forestry, fishing and hunting | 0.9% (195) | 1.4% (173) | 0.2% (22) |
| Clothing and accessories, including shoe, stores | 0.8% (184) | 0.3% (34) | 1.5% (150) |
| Book stores and news dealers | 0.7% (164) | 0.9% (110) | 0.5% (54) |
| Printing and related support activities | 0.7% (152) | 0.9% (109) | 0.4% (43) |
| Used merchandise, gift, novelty, and souvenir, and other miscellaneous stores | 0.7% (152) | 0.4% (53) | 1.0% (99) |
| Other direct selling establishments | 0.6% (141) | 0.3% (32) | 1.1% (109) |
| Health and personal care, except drug, stores | 0.6% (130) | 0.3% (37) | 0.9% (93) |
| Other transportation, and support activities, and couriers | 0.6% (126) | 0.6% (67) | 0.6% (59) |
| Food | 0.5% (120) | 0.6% (78) | 0.4% (42) |
| Pharmacies and drug stores | 0.5% (118) | 0.4% (53) | 0.6% (65) |
| Beverage and tobacco products | 0.5% (115) | 0.7% (84) | 0.3% (31) |
| Private households | 0.5% (107) | 0.2% (19) | 0.9% (88) |
| Furniture and home furnishings, and household appliance stores | 0.4% (97) | 0.5% (60) | 0.4% (37) |
| U. S. Postal service | 0.4% (96) | 0.5% (64) | 0.3% (32) |
| Electronic shopping and mail-order houses | 0.4% (93) | 0.6% (78) | 0.1% (15) |
| Air transportation | 0.4% (83) | 0.4% (49) | 0.3% (34) |
| Groceries and related products merchant wholesalers | 0.3% (73) | 0.4% (53) | 0.2% (20) |
| Miscellaneous nondurable goods merchant wholesalers | 0.3% (69) | 0.5% (59) | 0.1% (10) |
| Transportation equipment | 0.3% (63) | 0.5% (55) | 0.1% (8) |
| Professional and commercial equipment and supplies merchant wholesalers | 0.3% (59) | 0.4% (44) | 0.1% (15) |
| Music stores | 0.3% (59) | 0.4% (43) | 0.2% (16) |
| Machinery | 0.3% (57) | 0.3% (32) | 0.2% (25) |
| Gasoline stations | 0.2% (55) | 0.3% (42) | 0.1% (13) |
| Truck transportation | 0.2% (53) | 0.4% (46) | 0.1% (7) |
| Metal and metal products | 0.2% (51) | 0.4% (43) | 0.1% (8) |
| Plastics and rubber products | 0.2% (46) | 0.2% (21) | 0.2% (25) |
| Office supplies and stationery stores | 0.2% (42) | 0.2% (30) | 0.1% (12) |
| Miscellaneous durable goods merchant wholesalers | 0.2% (40) | 0.3% (32) | 0.1% (8) |
| Apparel | 0.2% (40) | 0.1% (9) | 0.3% (31) |
| Rail transportation | 0.2% (36) | 0.3% (36) | 0.0% (0) |
| Electrical and electronic goods merchant wholesalers | 0.2% (34) | 0.3% (34) | 0.0% (0) |
| Jewelry, luggage, and leather goods stores | 0.1% (33) | 0.1% (10) | 0.2% (23) |
| Furniture and related product manufacturing | 0.1% (29) | 0.2% (22) | 0.1% (7) |
| Wood products | 0.1% (28) | 0.2% (20) | 0.1% (8) |
| Apparel, fabrics, and notions merchant wholesalers | 0.1% (26) | 0.0% (0) | 0.3% (26) |
| Textile mills and textile products | 0.1% (26) | 0.0% (5) | 0.2% (21) |
| Chemicals | 0.1% (26) | 0.1% (16) | 0.1% (10) |
| Vending machine operators | 0.1% (25) | 0.2% (25) | 0.0% (0) |
| Retail florists | 0.1% (23) | 0.0% (0) | 0.2% (23) |
| Nonmetallic mineral products | 0.1% (23) | 0.2% (23) | 0.0% (0) |
| Drugs, sundries, and chemical and allied products merchant wholesalers | 0.1% (21) | 0.1% (15) | 0.1% (6) |
Unemployment in San Luis Obispo
- Unemployment by race in 2022
- Unemployment rate for White non-Hispanic residents
- 4.7%Males
- 7.6%Females
- Unemployment rate for Asian residents
- 2.3%Males
- 8.2%Females
- Unemployment rate for other race residents
- 20.3%Males
- 8.8%Females
- Unemployment rate for two or more race residents
- 5.6%Males
- Unemployment rate for Hispanic or Latino residents
- 6.6%Males
- 3.0%Females
- Unemployment by race in 2000
- Unemployment rate for White non-Hispanic residents
- 7.5%Males
- 6.4%Females
- Unemployment rate for Black residents
- 20.6%Males
- 22.2%Females
- Unemployment rate for American Indian and Alaska Native residents
- 27.4%Males
- Unemployment rate for Asian residents
- 9.0%Males
- 14.7%Females
- Unemployment rate for other race residents
- 7.1%Males
- 7.3%Females
- Unemployment rate for two or more race residents
- 3.3%Males
- 14.4%Females
- Unemployment rate for Hispanic or Latino residents
- 6.4%Males
- 6.3%Females
Unemployment in 2023:
| San Luis Obispo: | 3.2% |
| California: | 5.1% |
Unemployment in 2022:
| San Luis Obispo: | 2.6% |
| California: | 4.2% |
Unemployment in 2021:
| San Luis Obispo: | 5.0% |
| California: | 7.3% |
Unemployment in 2020:
| San Luis Obispo: | 7.7% |
| California: | 10.1% |
Unemployment in 2019:
| San Luis Obispo: | 2.5% |
| California: | 4.1% |
Unemployment in 2018:
| San Luis Obispo: | 2.6% |
| California: | 4.2% |
Unemployment in 2017:
| San Luis Obispo: | 3.0% |
| California: | 4.8% |
Unemployment in 2016:
| San Luis Obispo: | 3.6% |
| California: | 5.5% |
Unemployment in 2015:
| San Luis Obispo: | 5.0% |
| California: | 6.3% |
Unemployment in 2014:
| San Luis Obispo: | 6.0% |
| California: | 7.6% |
Unemployment in 2013:
| San Luis Obispo: | 7.3% |
| California: | 9.0% |
Unemployment in 2012:
| San Luis Obispo: | 8.8% |
| California: | 10.5% |
Unemployment in 2011:
| San Luis Obispo: | 10.3% |
| California: | 11.9% |
Unemployment in 2010:
| San Luis Obispo: | 10.8% |
| California: | 12.5% |
Unemployment in 2009:
| San Luis Obispo: | 10.1% |
| California: | 11.5% |
Unemployment in 2008:
| San Luis Obispo: | 6.4% |
| California: | 7.3% |
Unemployment in 2007:
| San Luis Obispo: | 4.7% |
| California: | 5.3% |
Unemployment in 2006:
| San Luis Obispo: | 4.3% |
| California: | 4.9% |
Unemployment in 2005:
| San Luis Obispo: | 4.7% |
| California: | 5.4% |
Unemployment in 2004:
| San Luis Obispo: | 5.0% |
| California: | 6.2% |
Unemployment in 2003:
| San Luis Obispo: | 5.3% |
| California: | 6.9% |
Unemployment in 2002:
| San Luis Obispo: | 5.2% |
| California: | 6.8% |
Unemployment in 2001:
| San Luis Obispo: | 4.5% |
| California: | 5.5% |
Unemployment in 2000:
| San Luis Obispo: | 4.4% |
| California: | 4.9% |
Unemployment in 1999:
| San Luis Obispo: | 3.6% |
| California: | 5.3% |
Unemployment in 1998:
| San Luis Obispo: | 4.5% |
| California: | 5.9% |
Unemployment in 1997:
| San Luis Obispo: | 5.2% |
| California: | 6.4% |
Unemployment in 1996:
| San Luis Obispo: | 6.2% |
| California: | 7.3% |
Unemployment in 1995:
| San Luis Obispo: | 7.1% |
| California: | 7.9% |
Unemployment in 1994:
| San Luis Obispo: | 7.9% |
| California: | 8.7% |
Unemployment in 1993:
| San Luis Obispo: | 8.9% |
| California: | 9.5% |
Unemployment in 1992:
| San Luis Obispo: | 8.1% |
| California: | 9.4% |
Unemployment in 1991:
| San Luis Obispo: | 6.6% |
| California: | 7.8% |
Unemployment in 1990:
| San Luis Obispo: | 5.0% |
| California: | 5.8% |
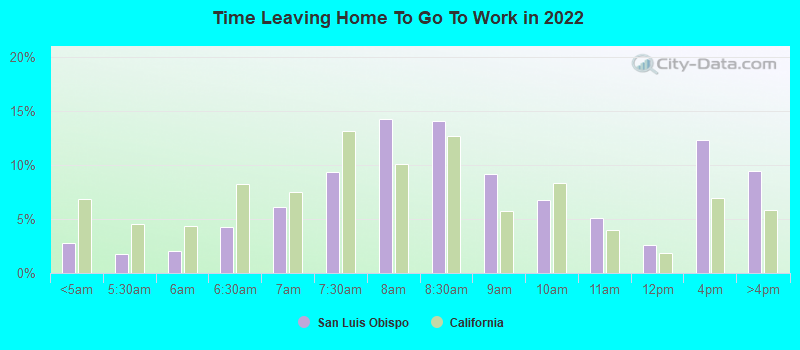
Time leaving home to go to work
12:00 a.m. to 4:59 a.m.:
| San Luis Obispo: | 2.7% (564) |
| California: | 6.8% (1,050,902) |
5:00 a.m. to 5:29 a.m.:
| San Luis Obispo: | 1.8% (363) |
| California: | 4.5% (692,772) |
5:30 a.m. to 5:59 a.m.:
| San Luis Obispo: | 2.0% (420) |
| California: | 4.3% (665,475) |
6:00 a.m. to 6:29 a.m.:
| San Luis Obispo: | 4.3% (881) |
| California: | 8.3% (1,273,588) |
6:30 a.m. to 6:59 a.m.:
| San Luis Obispo: | 6.1% (1,269) |
| California: | 7.5% (1,156,338) |
7:00 a.m. to 7:29 a.m.:
| San Luis Obispo: | 9.4% (1,935) |
| California: | 13.2% (2,027,702) |
7:30 a.m. to 7:59 a.m.:
| San Luis Obispo: | 14.2% (2,938) |
| California: | 10.1% (1,550,402) |
8:00 a.m. to 8:29 a.m.:
| San Luis Obispo: | 14.0% (2,899) |
| California: | 12.7% (1,953,986) |
8:30 a.m. to 8:59 a.m.:
| San Luis Obispo: | 9.2% (1,896) |
| California: | 5.8% (890,950) |
9:00 a.m. to 9:59 a.m.:
| San Luis Obispo: | 6.7% (1,388) |
| California: | 8.4% (1,288,499) |
10:00 a.m. to 10:59 a.m.:
| San Luis Obispo: | 5.1% (1,044) |
| California: | 4.0% (613,193) |
11:00 a.m. to 11:59 a.m.:
| San Luis Obispo: | 2.5% (526) |
| California: | 1.8% (280,975) |
12:00 p.m. to 3:59 p.m.:
| San Luis Obispo: | 12.3% (2,536) |
| California: | 7.0% (1,075,505) |
4:00 p.m. to 11:59 p.m.:
| San Luis Obispo: | 9.4% (1,950) |
| California: | 5.8% (891,240) |
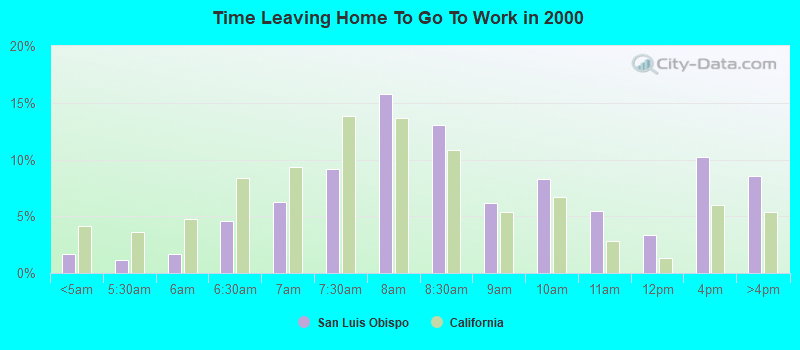
<5am:
| San Luis Obispo: | 1.7% (369) |
| California: | 4.2% (606,086) |
5:30am:
| San Luis Obispo: | 1.2% (252) |
| California: | 3.6% (523,209) |
6am:
| San Luis Obispo: | 1.6% (354) |
| California: | 4.8% (692,256) |
6:30am:
| San Luis Obispo: | 4.6% (996) |
| California: | 8.4% (1,216,867) |
7am:
| San Luis Obispo: | 6.3% (1,359) |
| California: | 9.4% (1,362,830) |
7:30am:
| San Luis Obispo: | 9.1% (1,980) |
| California: | 13.8% (2,006,950) |
8am:
| San Luis Obispo: | 15.8% (3,421) |
| California: | 13.7% (1,986,831) |
8:30am:
| San Luis Obispo: | 13.1% (2,836) |
| California: | 10.9% (1,577,815) |
9am:
| San Luis Obispo: | 6.2% (1,336) |
| California: | 5.4% (778,152) |
10am:
| San Luis Obispo: | 8.3% (1,795) |
| California: | 6.7% (972,355) |
11am:
| San Luis Obispo: | 5.4% (1,178) |
| California: | 2.9% (414,479) |
12pm:
| San Luis Obispo: | 3.3% (723) |
| California: | 1.3% (189,005) |
4pm:
| San Luis Obispo: | 10.2% (2,218) |
| California: | 6.0% (865,284) |
>4pm:
| San Luis Obispo: | 8.6% (1,855) |
| California: | 5.3% (776,167) |
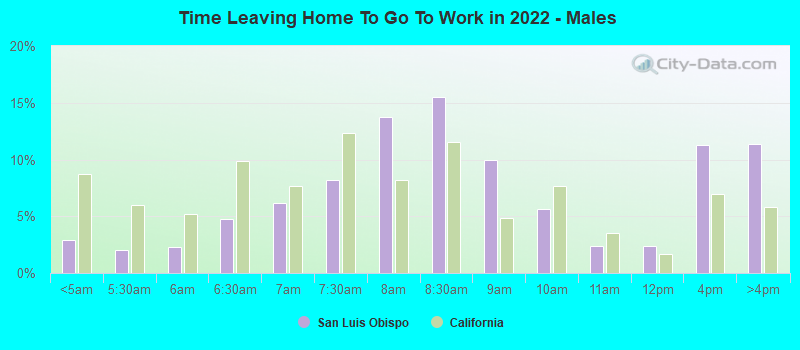
12:00 a.m. to 4:59 a.m. - Males:
| San Luis Obispo: | 2.9% (293) |
| California: | 8.7% (747,612) |
5:00 a.m. to 5:29 a.m. - Males:
| San Luis Obispo: | 2.0% (200) |
| California: | 6.0% (509,420) |
5:30 a.m. to 5:59 a.m. - Males:
| San Luis Obispo: | 2.3% (227) |
| California: | 5.2% (448,269) |
6:00 a.m. to 6:29 a.m. - Males:
| San Luis Obispo: | 4.7% (477) |
| California: | 9.8% (842,941) |
6:30 a.m. to 6:59 a.m. - Males:
| San Luis Obispo: | 6.2% (622) |
| California: | 7.7% (657,557) |
7:00 a.m. to 7:29 a.m. - Males:
| San Luis Obispo: | 8.2% (823) |
| California: | 12.4% (1,058,532) |
7:30 a.m. to 7:59 a.m. - Males:
| San Luis Obispo: | 13.8% (1,383) |
| California: | 8.2% (702,727) |
8:00 a.m. to 8:29 a.m. - Males:
| San Luis Obispo: | 15.5% (1,555) |
| California: | 11.5% (984,538) |
8:30 a.m. to 8:59 a.m. - Males:
| San Luis Obispo: | 10.0% (1,001) |
| California: | 4.8% (414,815) |
9:00 a.m. to 9:59 a.m. - Males:
| San Luis Obispo: | 5.7% (568) |
| California: | 7.7% (655,038) |
10:00 a.m. to 10:59 a.m. - Males:
| San Luis Obispo: | 2.4% (241) |
| California: | 3.5% (301,425) |
11:00 a.m. to 11:59 a.m. - Males:
| San Luis Obispo: | 2.4% (241) |
| California: | 1.7% (141,620) |
12:00 p.m. to 3:59 p.m. - Males:
| San Luis Obispo: | 11.3% (1,135) |
| California: | 7.0% (594,847) |
4:00 p.m. to 11:59 p.m. - Males:
| San Luis Obispo: | 11.4% (1,141) |
| California: | 5.8% (499,471) |
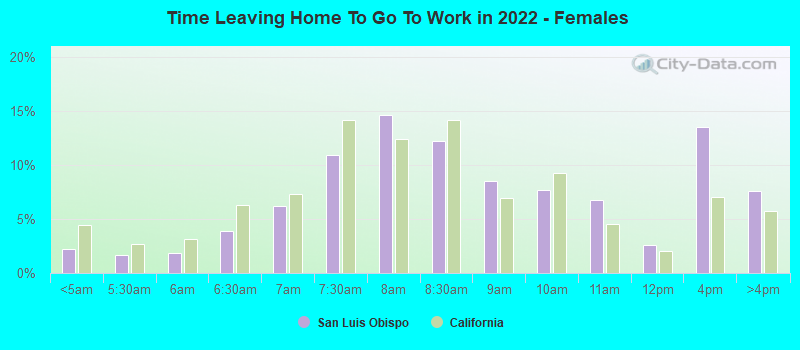
12:00 a.m. to 4:59 a.m. - Females:
| San Luis Obispo: | 2.2% (236) |
| California: | 4.4% (303,290) |
5:00 a.m. to 5:29 a.m. - Females:
| San Luis Obispo: | 1.7% (182) |
| California: | 2.7% (183,352) |
5:30 a.m. to 5:59 a.m. - Females:
| San Luis Obispo: | 1.8% (196) |
| California: | 3.2% (217,206) |
6:00 a.m. to 6:29 a.m. - Females:
| San Luis Obispo: | 3.9% (413) |
| California: | 6.3% (430,647) |
6:30 a.m. to 6:59 a.m. - Females:
| San Luis Obispo: | 6.2% (659) |
| California: | 7.3% (498,781) |
7:00 a.m. to 7:29 a.m. - Females:
| San Luis Obispo: | 10.9% (1,161) |
| California: | 14.1% (969,170) |
7:30 a.m. to 7:59 a.m. - Females:
| San Luis Obispo: | 14.6% (1,562) |
| California: | 12.4% (847,675) |
8:00 a.m. to 8:29 a.m. - Females:
| San Luis Obispo: | 12.2% (1,300) |
| California: | 14.1% (969,448) |
8:30 a.m. to 8:59 a.m. - Females:
| San Luis Obispo: | 8.5% (910) |
| California: | 6.9% (476,135) |
9:00 a.m. to 9:59 a.m. - Females:
| San Luis Obispo: | 7.7% (821) |
| California: | 9.2% (633,461) |
10:00 a.m. to 10:59 a.m. - Females:
| San Luis Obispo: | 6.7% (717) |
| California: | 4.5% (311,768) |
11:00 a.m. to 11:59 a.m. - Females:
| San Luis Obispo: | 2.6% (278) |
| California: | 2.0% (139,355) |
12:00 p.m. to 3:59 p.m. - Females:
| San Luis Obispo: | 13.5% (1,437) |
| California: | 7.0% (480,658) |
4:00 p.m. to 11:59 p.m. - Females:
| San Luis Obispo: | 7.6% (808) |
| California: | 5.7% (391,769) |
Travel time to work
Percentage of workers working in this county: 94.4%
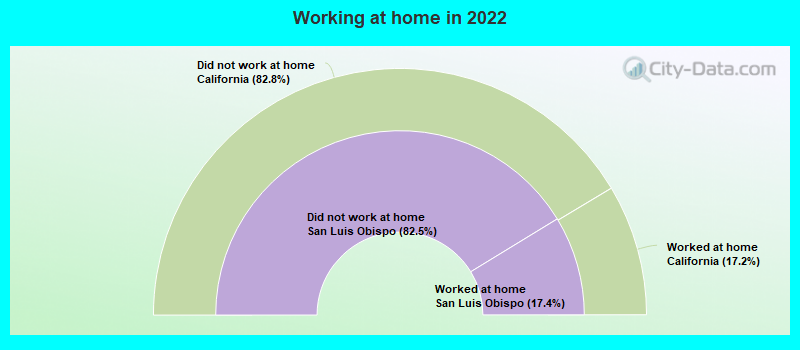
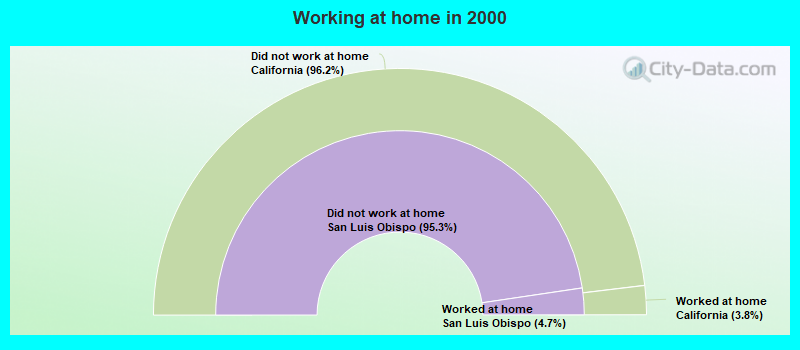
Number of people working at home: 3,494 (14.0% of all workers)
Daytime population change due to commuting: +9,442 (+21.4%)
Workers who live and work in this city: 12,901 (59.5%)
Number of people working at home: 3,494 (14.0% of all workers)
Daytime population change due to commuting: +9,442 (+21.4%)
Workers who live and work in this city: 12,901 (59.5%)
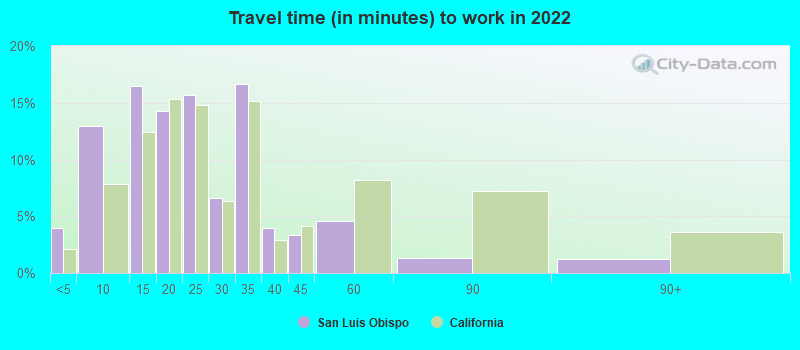
Less than 5 minutes:
| San Luis Obispo: | 3.9% (1,357) |
| California: | 2.1% (323,064) |
5 to 9 minutes:
| San Luis Obispo: | 13.0% (4,481) |
| California: | 7.8% (1,208,682) |
10 to 14 minutes:
| San Luis Obispo: | 16.4% (5,673) |
| California: | 12.4% (1,917,610) |
15 to 19 minutes:
| San Luis Obispo: | 14.3% (4,922) |
| California: | 15.3% (2,367,483) |
20 to 24 minutes:
| San Luis Obispo: | 15.7% (5,402) |
| California: | 14.8% (2,279,693) |
25 to 29 minutes:
| San Luis Obispo: | 6.6% (2,294) |
| California: | 6.4% (981,997) |
30 to 34 minutes:
| San Luis Obispo: | 16.7% (5,746) |
| California: | 15.2% (2,339,223) |
35 to 39 minutes:
| San Luis Obispo: | 3.9% (1,354) |
| California: | 2.9% (453,226) |
40 to 44 minutes:
| San Luis Obispo: | 3.3% (1,142) |
| California: | 4.1% (637,781) |
45 to 59 minutes:
| San Luis Obispo: | 4.6% (1,571) |
| California: | 8.2% (1,259,482) |
60 to 89 minutes:
| San Luis Obispo: | 1.3% (464) |
| California: | 7.2% (1,111,698) |
90 or more minutes:
| San Luis Obispo: | 1.3% (434) |
| California: | 3.6% (552,805) |
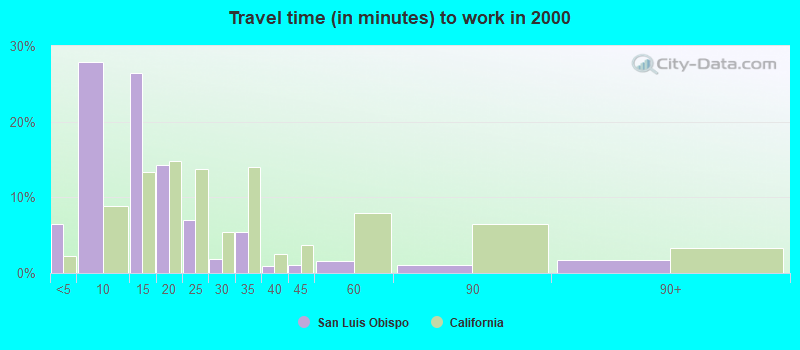
Less than 5 minutes:
| San Luis Obispo: | 6.4% (1,393) |
| California: | 2.2% (324,703) |
5 to 9 minutes:
| San Luis Obispo: | 27.9% (6,039) |
| California: | 8.8% (1,280,443) |
10 to 14 minutes:
| San Luis Obispo: | 26.4% (5,717) |
| California: | 13.3% (1,930,263) |
15 to 19 minutes:
| San Luis Obispo: | 14.3% (3,101) |
| California: | 14.9% (2,157,970) |
20 to 24 minutes:
| San Luis Obispo: | 6.9% (1,505) |
| California: | 13.8% (2,004,060) |
25 to 29 minutes:
| San Luis Obispo: | 1.9% (408) |
| California: | 5.4% (782,241) |
30 to 34 minutes:
| San Luis Obispo: | 5.4% (1,170) |
| California: | 13.9% (2,025,657) |
35 to 39 minutes:
| San Luis Obispo: | 0.9% (196) |
| California: | 2.5% (366,487) |
40 to 44 minutes:
| San Luis Obispo: | 1.0% (221) |
| California: | 3.6% (528,043) |
45 to 59 minutes:
| San Luis Obispo: | 1.5% (331) |
| California: | 7.9% (1,151,598) |
60 to 89 minutes:
| San Luis Obispo: | 1.0% (216) |
| California: | 6.4% (933,123) |
90 or more minutes:
| San Luis Obispo: | 1.7% (375) |
| California: | 3.3% (483,698) |
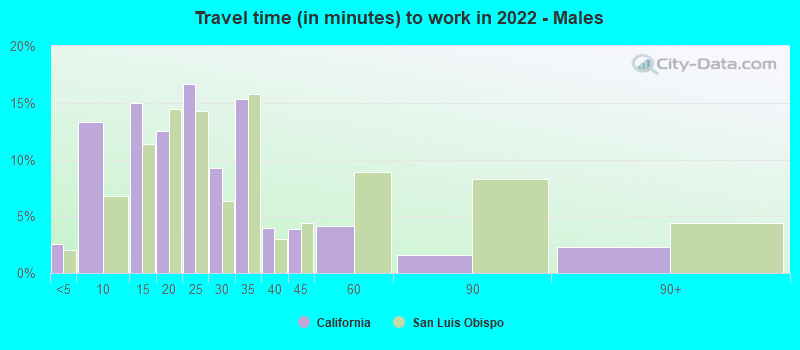
Less than 5 minutes - Males:
| San Luis Obispo: | 2.5% (472) |
| California: | 2.0% (173,603) |
5 to 9 minutes - Males:
| San Luis Obispo: | 13.3% (2,486) |
| California: | 6.8% (580,822) |
10 to 14 minutes - Males:
| San Luis Obispo: | 14.9% (2,794) |
| California: | 11.4% (974,497) |
15 to 19 minutes - Males:
| San Luis Obispo: | 12.5% (2,346) |
| California: | 14.5% (1,239,386) |
20 to 24 minutes - Males:
| San Luis Obispo: | 16.7% (3,123) |
| California: | 14.3% (1,223,429) |
25 to 29 minutes - Males:
| San Luis Obispo: | 9.2% (1,723) |
| California: | 6.4% (545,844) |
30 to 34 minutes - Males:
| San Luis Obispo: | 15.4% (2,873) |
| California: | 15.8% (1,352,210) |
35 to 39 minutes - Males:
| San Luis Obispo: | 4.0% (749) |
| California: | 3.0% (253,732) |
40 to 44 minutes - Males:
| San Luis Obispo: | 3.9% (728) |
| California: | 4.4% (376,144) |
45 to 59 minutes - Males:
| San Luis Obispo: | 4.1% (770) |
| California: | 8.9% (762,659) |
60 to 89 minutes - Males:
| San Luis Obispo: | 1.6% (305) |
| California: | 8.3% (711,394) |
90 or more minutes - Males:
| San Luis Obispo: | 2.3% (428) |
| California: | 4.4% (378,954) |
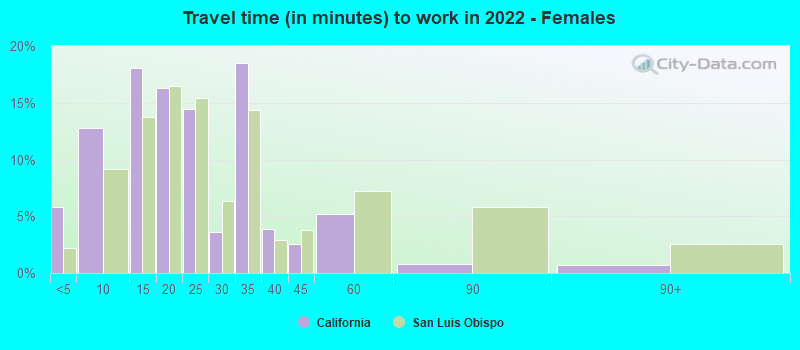
Less than 5 minutes - Females:
| San Luis Obispo: | 5.8% (919) |
| California: | 2.2% (149,461) |
5 to 9 minutes - Females:
| San Luis Obispo: | 12.7% (2,014) |
| California: | 9.2% (627,860) |
10 to 14 minutes - Females:
| San Luis Obispo: | 18.1% (2,856) |
| California: | 13.7% (943,113) |
15 to 19 minutes - Females:
| San Luis Obispo: | 16.3% (2,581) |
| California: | 16.4% (1,128,097) |
20 to 24 minutes - Females:
| San Luis Obispo: | 14.4% (2,278) |
| California: | 15.4% (1,056,264) |
25 to 29 minutes - Females:
| San Luis Obispo: | 3.6% (572) |
| California: | 6.4% (436,153) |
30 to 34 minutes - Females:
| San Luis Obispo: | 18.5% (2,926) |
| California: | 14.4% (987,013) |
35 to 39 minutes - Females:
| San Luis Obispo: | 3.8% (605) |
| California: | 2.9% (199,494) |
40 to 44 minutes - Females:
| San Luis Obispo: | 2.5% (401) |
| California: | 3.8% (261,637) |
45 to 59 minutes - Females:
| San Luis Obispo: | 5.2% (816) |
| California: | 7.2% (496,823) |
60 to 89 minutes - Females:
| San Luis Obispo: | 0.8% (120) |
| California: | 5.8% (400,304) |
90 or more minutes - Females:
| San Luis Obispo: | 0.7% (106) |
| California: | 2.5% (173,851) |
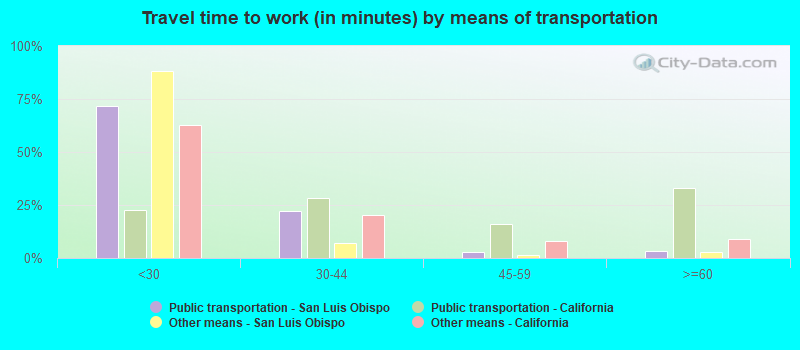
Means of transportation to work
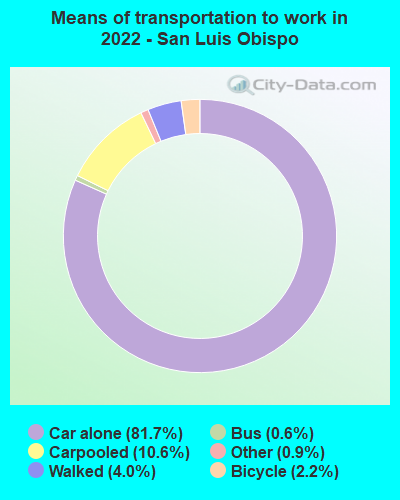

Drove car alone:
| San Luis Obispo: | 81.7% (29,268) |
| California: | 79.1% (5,345,368) |
Carpooled:
| San Luis Obispo: | 10.6% (3,790) |
| California: | 11.9% (878,699) |
Bus:
| San Luis Obispo: | 0.6% (233) |
| California: | 2.2% (170,574) |
Long-distance train or commuter rail:
| San Luis Obispo: | 0.0% (10) |
| California: | 0.2% (16,750) |
Bicycle:
| San Luis Obispo: | 2.2% (793) |
| California: | 0.9% (39,197) |
Walked:
| San Luis Obispo: | 4.0% (1,420) |
| California: | 2.9% (218,374) |
Other means:
| San Luis Obispo: | 0.9% (328) |
| California: | 2.1% (137,489) |
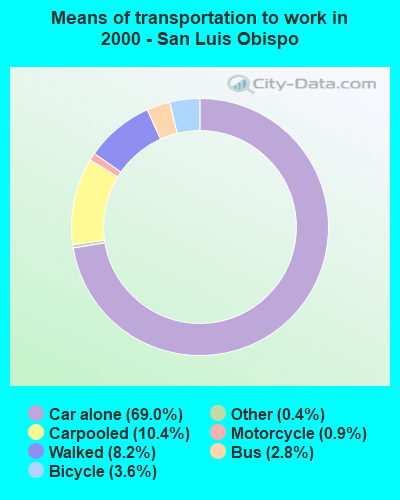

Drove car alone:
| San Luis Obispo: | 69.0% (14,962) |
| California: | 71.8% (10,432,462) |
Carpooled:
| San Luis Obispo: | 10.4% (2,246) |
| California: | 14.5% (2,113,313) |
Bus or trolley bus:
| San Luis Obispo: | 2.8% (607) |
| California: | 3.8% (549,425) |
Ferryboat:
| San Luis Obispo: | 0.0% (6) |
| California: | 0.0% (6,831) |
Taxicab:
| San Luis Obispo: | 0.0% (7) |
| California: | 0.1% (9,890) |
Motorcycle:
| San Luis Obispo: | 0.9% (190) |
| California: | 0.2% (36,262) |
Bicycle:
| San Luis Obispo: | 3.6% (779) |
| California: | 0.8% (120,567) |
Walked:
| San Luis Obispo: | 8.2% (1,781) |
| California: | 2.9% (414,581) |
Other means:
| San Luis Obispo: | 0.4% (94) |
| California: | 0.8% (115,064) |
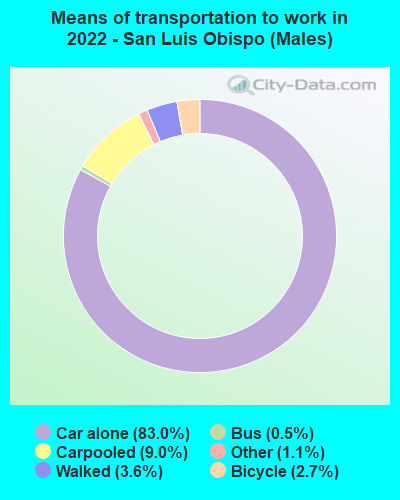

Drove car alone - Males:
| San Luis Obispo: | 83.0% (16,181) |
| California: | 80.0% (5,345,368) |
Carpooled - Males:
| San Luis Obispo: | 9.0% (1,762) |
| California: | 11.1% (878,699) |
Bus - Males:
| San Luis Obispo: | 0.5% (103) |
| California: | 2.0% (170,574) |
Long-distance train or commuter rail - Males:
| San Luis Obispo: | 0.1% (10) |
| California: | 0.2% (16,750) |
Bicycle - Males:
| San Luis Obispo: | 2.7% (534) |
| California: | 1.1% (39,197) |
Walked - Males:
| San Luis Obispo: | 3.6% (702) |
| California: | 2.7% (218,374) |
Other means - Males:
| San Luis Obispo: | 1.1% (215) |
| California: | 2.1% (137,489) |
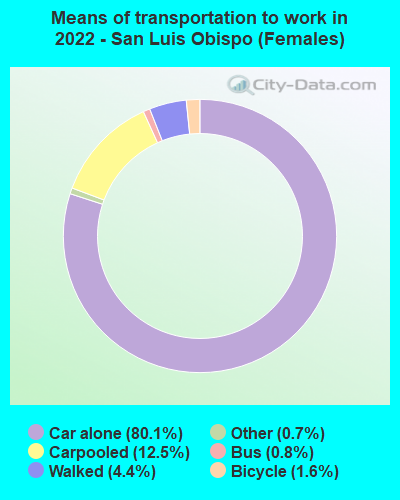

Drove car alone - Females:
| San Luis Obispo: | 80.1% (13,077) |
| California: | 77.9% (5,345,368) |
Carpooled - Females:
| San Luis Obispo: | 12.5% (2,038) |
| California: | 12.8% (878,699) |
Bus - Females:
| San Luis Obispo: | 0.8% (130) |
| California: | 2.5% (170,574) |
Bicycle - Females:
| San Luis Obispo: | 1.6% (256) |
| California: | 0.6% (39,197) |
Walked - Females:
| San Luis Obispo: | 4.4% (720) |
| California: | 3.2% (218,374) |
Other means - Females:
| San Luis Obispo: | 0.7% (112) |
| California: | 2.0% (137,489) |
Private vehicle occupancy
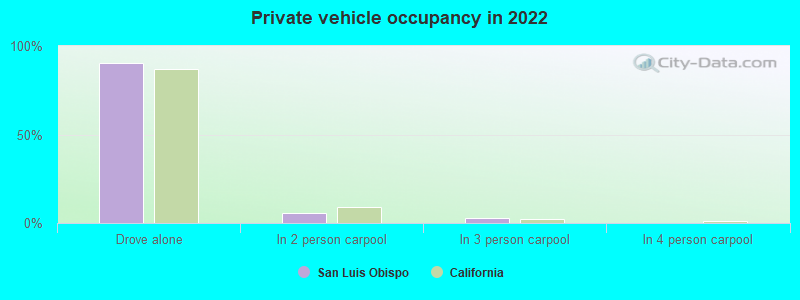
Drove alone:
| San Luis Obispo: | 90.5% (15,797) |
| California: | 86.9% (12,187,486) |
In 2 person carpool:
| San Luis Obispo: | 5.6% (983) |
| California: | 9.2% (1,295,561) |
In 3 person carpool:
| San Luis Obispo: | 2.6% (447) |
| California: | 2.2% (309,969) |
In 4 person carpool:
| San Luis Obispo: | 0.1% (24) |
| California: | 0.9% (126,987) |
In 5-6 person carpool:
| San Luis Obispo: | 0.4% (76) |
| California: | 0.5% (70,825) |
In 7+ person carpool:
| San Luis Obispo: | 0.7% (126) |
| California: | 0.2% (28,258) |
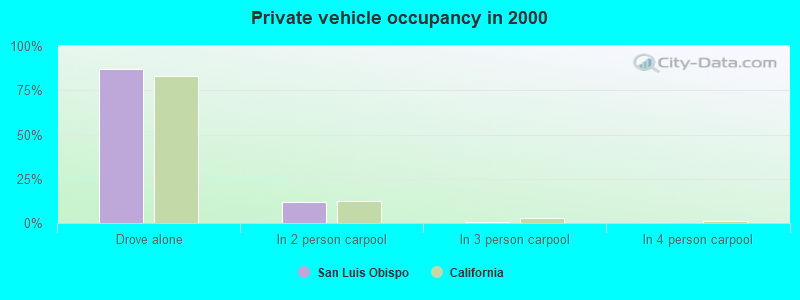
Drove alone:
| San Luis Obispo: | 86.9% (14,962) |
| California: | 83.2% (10,432,462) |
In 2 person carpool:
| San Luis Obispo: | 11.8% (2,038) |
| California: | 12.5% (1,564,905) |
In 3 person carpool:
| San Luis Obispo: | 0.6% (100) |
| California: | 2.6% (330,732) |
In 4 person carpool:
| San Luis Obispo: | 0.2% (41) |
| California: | 1.0% (119,364) |
In 5-6 person carpool:
| San Luis Obispo: | 0.2% (33) |
| California: | 0.5% (57,036) |
In 7+ person carpool:
| San Luis Obispo: | 0.2% (34) |
| California: | 0.3% (41,276) |
Class of workers
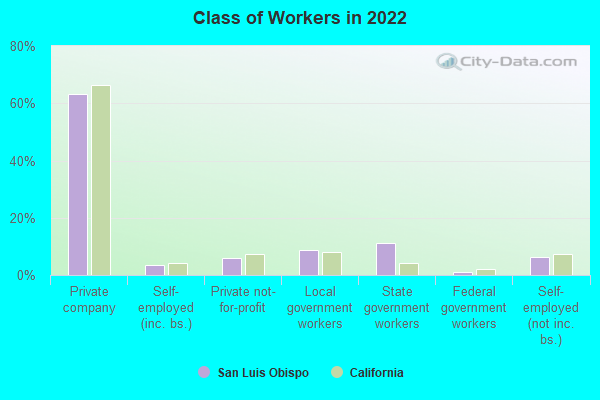
Employee of private company:
| San Luis Obispo: | 63.3% (16,468) |
| California: | 66.5% (12,596,030) |
Self-employed in own incorporated business:
| San Luis Obispo: | 3.4% (878) |
| California: | 4.1% (784,709) |
Private not-for-profit wage and salary workers:
| San Luis Obispo: | 6.1% (1,587) |
| California: | 7.5% (1,417,407) |
Local government workers:
| San Luis Obispo: | 8.8% (2,296) |
| California: | 8.2% (1,547,056) |
State government workers:
| San Luis Obispo: | 11.2% (2,906) |
| California: | 4.1% (780,915) |
Federal government workers:
| San Luis Obispo: | 1.0% (261) |
| California: | 2.0% (369,858) |
Self-employed workers in own not incorporated business:
| San Luis Obispo: | 6.2% (1,606) |
| California: | 7.4% (1,410,735) |
Unpaid family workers:
| San Luis Obispo: | 0.1% (21) |
| California: | 0.2% (36,267) |
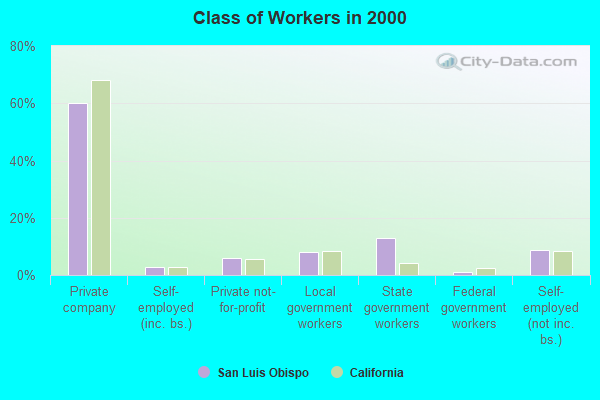
Employee of private company:
| San Luis Obispo: | 60.1% (13,262) |
| California: | 68.0% (10,009,465) |
Self-employed in own incorporated business:
| San Luis Obispo: | 2.9% (638) |
| California: | 2.7% (402,392) |
Private not-for-profit wage and salary workers:
| San Luis Obispo: | 6.0% (1,318) |
| California: | 5.7% (845,536) |
Local government workers:
| San Luis Obispo: | 8.2% (1,808) |
| California: | 8.3% (1,218,764) |
State government workers:
| San Luis Obispo: | 12.8% (2,828) |
| California: | 4.0% (594,953) |
Federal government workers:
| San Luis Obispo: | 1.2% (255) |
| California: | 2.3% (344,354) |
Self-employed workers in own not incorporated business:
| San Luis Obispo: | 8.7% (1,911) |
| California: | 8.5% (1,249,530) |
Unpaid family workers:
| San Luis Obispo: | 0.2% (37) |
| California: | 0.4% (53,934) |
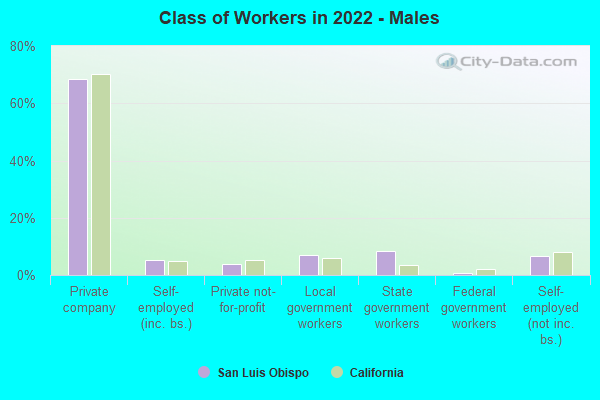
Employee of private company - Males:
| San Luis Obispo: | 68.4% (9,105) |
| California: | 70.3% (7,191,252) |
Self-employed in own incorporated business - Males:
| San Luis Obispo: | 5.2% (694) |
| California: | 4.9% (504,764) |
Private not-for-profit wage and salary workers - Males:
| San Luis Obispo: | 3.8% (505) |
| California: | 5.2% (529,122) |
Local government workers - Males:
| San Luis Obispo: | 6.9% (913) |
| California: | 6.0% (610,331) |
State government workers - Males:
| San Luis Obispo: | 8.2% (1,096) |
| California: | 3.4% (343,636) |
Federal government workers - Males:
| San Luis Obispo: | 0.7% (100) |
| California: | 2.1% (209,874) |
Self-employed workers in own not incorporated business - Males:
| San Luis Obispo: | 6.6% (875) |
| California: | 8.1% (824,359) |
Unpaid family workers - Males:
| San Luis Obispo: | 0.2% (21) |
| California: | 0.2% (17,922) |
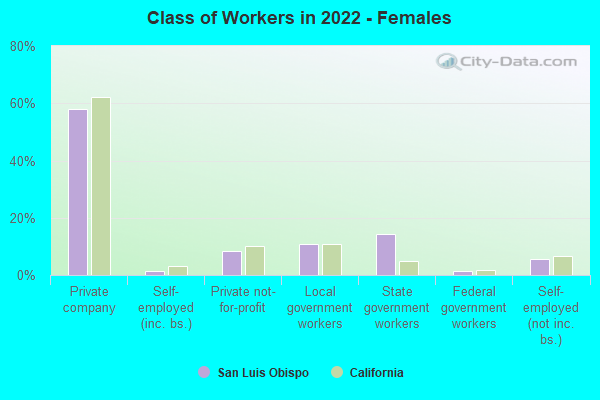
Employee of private company - Females:
| San Luis Obispo: | 57.9% (7,363) |
| California: | 62.0% (5,404,778) |
Self-employed in own incorporated business - Females:
| San Luis Obispo: | 1.5% (185) |
| California: | 3.2% (279,945) |
Private not-for-profit wage and salary workers - Females:
| San Luis Obispo: | 8.5% (1,082) |
| California: | 10.2% (888,285) |
Local government workers - Females:
| San Luis Obispo: | 10.9% (1,383) |
| California: | 10.8% (936,725) |
State government workers - Females:
| San Luis Obispo: | 14.2% (1,811) |
| California: | 5.0% (437,279) |
Federal government workers - Females:
| San Luis Obispo: | 1.3% (161) |
| California: | 1.8% (159,984) |
Self-employed workers in own not incorporated business - Females:
| San Luis Obispo: | 5.7% (731) |
| California: | 6.7% (586,376) |