Work and Jobs in Skidmore, Texas (TX) Detailed Stats
Occupations, Industries, Unemployment, Workers, Commute
Settings
X


Recent posts about work in Skidmore, Texas on our local forum with over 2,400,000 registered users:
 | Gone but not forgotten- Old Corpus Christi (566 replies) |
| Portland light rail's mixed track record (111 replies) |
| SA Most Famous Star's Forgotten (74 replies) |
| Beware Group One (78 replies) |
Latest news about work in Skidmore, TX collected exclusively by city-data.com from local newspapers, TV, and radio stations
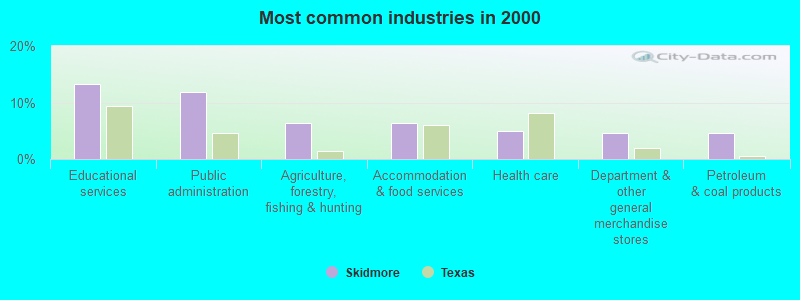
The most common industries in Skidmore are: Educational services (13.3% of civilian employees), Public administration (11.9% of civilian employees), Agriculture, forestry, fishing & hunting (6.4% of civilian employees). 78.8% of workers work in Bee County and 5.5% of all workers work at home. 64.2% of workers are employees of private companies, which is 8.4% less than the rate of 69.6% across the entire state of Texas.
Whole page based on the data from 2000 / 2022 when the population of Skidmore, Texas was 1,013 / 1,199
Whole page based on the data from 2000 / 2022 when the population of Skidmore, Texas was 1,013 / 1,199
Most common industries
Most common industries | |||
|---|---|---|---|
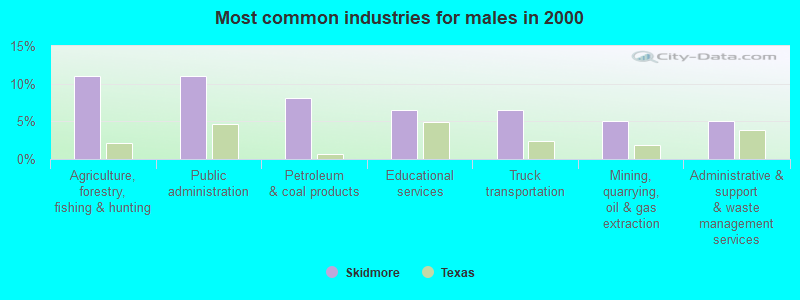
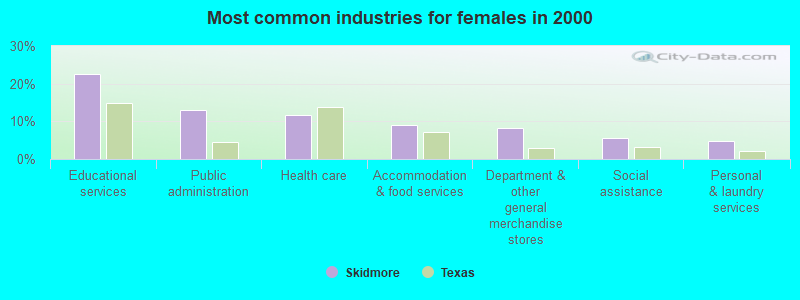
Industry | All | Males | Females |
| Educational services | 13.3% (46) | 6.5% (13) | 22.6% (33) |
| Public administration | 11.9% (41) | 11.1% (22) | 13.0% (19) |
| Agriculture, forestry, fishing and hunting | 6.4% (22) | 11.1% (22) | 0.0% (0) |
| Accommodation and food services | 6.4% (22) | 4.5% (9) | 8.9% (13) |
| Health care | 4.9% (17) | 0.0% (0) | 11.6% (17) |
| Department and other general merchandise stores | 4.6% (16) | 2.0% (4) | 8.2% (12) |
| Petroleum and coal products | 4.6% (16) | 8.0% (16) | 0.0% (0) |
| Repair and maintenance | 3.8% (13) | 4.0% (8) | 3.4% (5) |
| Truck transportation | 3.8% (13) | 6.5% (13) | 0.0% (0) |
| Mining, quarrying, and oil and gas extraction | 2.9% (10) | 5.0% (10) | 0.0% (0) |
| Gasoline stations | 2.9% (10) | 2.5% (5) | 3.4% (5) |
| Administrative and support and waste management services | 2.9% (10) | 5.0% (10) | 0.0% (0) |
| Machinery, equipment, and supplies merchant wholesalers | 2.6% (9) | 4.5% (9) | 0.0% (0) |
| Professional, scientific, and technical services | 2.6% (9) | 2.0% (4) | 3.4% (5) |
| Motor vehicle and parts dealers | 2.6% (9) | 3.0% (6) | 2.1% (3) |
| Construction | 2.3% (8) | 4.0% (8) | 0.0% (0) |
| Apparel | 2.3% (8) | 2.0% (4) | 2.7% (4) |
| Social assistance | 2.3% (8) | 0.0% (0) | 5.5% (8) |
| Machinery | 2.0% (7) | 3.5% (7) | 0.0% (0) |
| Personal and laundry services | 2.0% (7) | 0.0% (0) | 4.8% (7) |
| Religious, grantmaking, civic, professional, and similar organizations | 2.0% (7) | 2.0% (4) | 2.1% (3) |
| Utilities | 1.7% (6) | 3.0% (6) | 0.0% (0) |
| Food and beverage stores | 1.7% (6) | 1.5% (3) | 2.1% (3) |
| Plastics and rubber products | 1.4% (5) | 2.5% (5) | 0.0% (0) |
| Retail florists | 1.4% (5) | 2.5% (5) | 0.0% (0) |
| Real estate and rental and leasing | 1.4% (5) | 0.0% (0) | 3.4% (5) |
| Private households | 1.2% (4) | 0.0% (0) | 2.7% (4) |
| Chemicals | 0.9% (3) | 1.5% (3) | 0.0% (0) |
| Groceries and related products merchant wholesalers | 0.9% (3) | 1.5% (3) | 0.0% (0) |
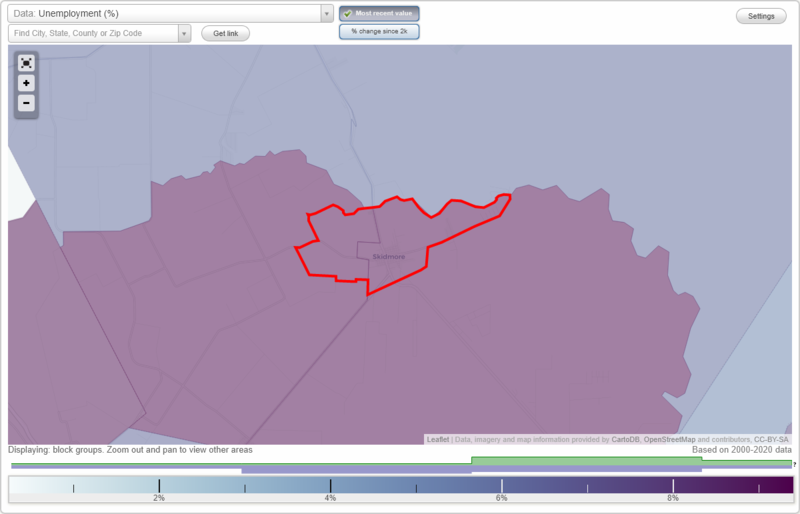
Unemployment in Skidmore
- Unemployment by race in 2022
- Unemployment rate for White non-Hispanic residents
- 2.7%Males
- 5.8%Females
- Unemployment rate for Black residents
- 18.3%Females
- Unemployment rate for Hispanic or Latino residents
- 3.9%Males
- Unemployment by race in 2000
- Unemployment rate for White non-Hispanic residents
- 4.7%Females
- Unemployment rate for two or more race residents
- 44.4%Females
- Unemployment rate for Hispanic or Latino residents
- 12.1%Males
- 18.7%Females
Time leaving home to go to work
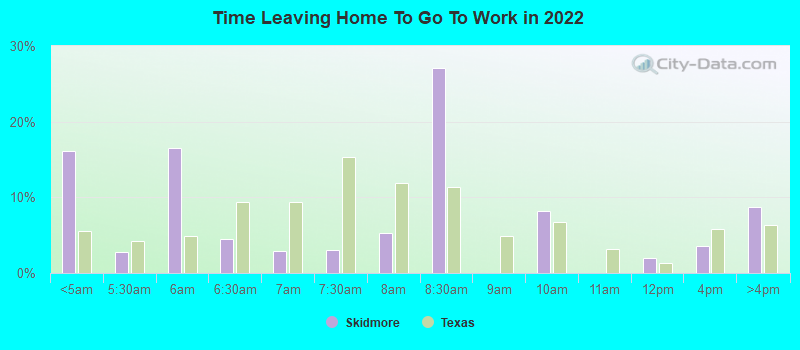
12:00 a.m. to 4:59 a.m.:
| Skidmore: | 16.1% (67) |
| Texas: | 5.5% (678,264) |
5:00 a.m. to 5:29 a.m.:
| Skidmore: | 2.8% (12) |
| Texas: | 4.3% (525,841) |
5:30 a.m. to 5:59 a.m.:
| Skidmore: | 16.5% (69) |
| Texas: | 4.9% (603,953) |
6:00 a.m. to 6:29 a.m.:
| Skidmore: | 4.5% (19) |
| Texas: | 9.4% (1,155,020) |
6:30 a.m. to 6:59 a.m.:
| Skidmore: | 2.9% (12) |
| Texas: | 9.3% (1,152,822) |
7:00 a.m. to 7:29 a.m.:
| Skidmore: | 3.1% (13) |
| Texas: | 15.3% (1,885,477) |
7:30 a.m. to 7:59 a.m.:
| Skidmore: | 5.3% (22) |
| Texas: | 11.9% (1,469,628) |
8:00 a.m. to 8:29 a.m.:
| Skidmore: | 27.0% (113) |
| Texas: | 11.3% (1,400,175) |
9:00 a.m. to 9:59 a.m.:
| Skidmore: | 8.2% (34) |
| Texas: | 6.7% (829,367) |
11:00 a.m. to 11:59 a.m.:
| Skidmore: | 1.9% (8) |
| Texas: | 1.3% (162,330) |
12:00 p.m. to 3:59 p.m.:
| Skidmore: | 3.6% (15) |
| Texas: | 5.8% (720,594) |
4:00 p.m. to 11:59 p.m.:
| Skidmore: | 8.7% (36) |
| Texas: | 6.3% (777,072) |
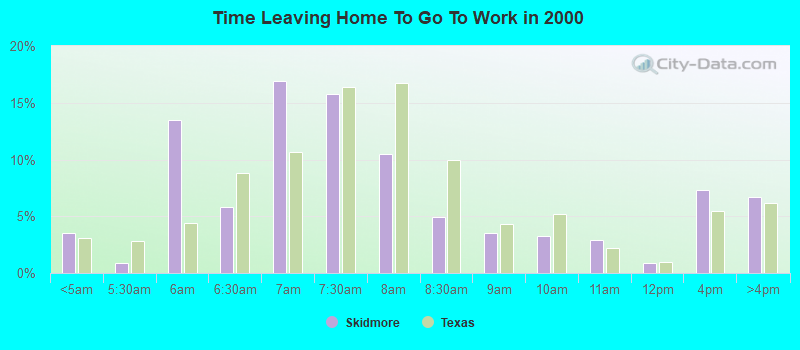
<5am:
| Skidmore: | 3.5% (12) |
| Texas: | 3.1% (281,361) |
5:30am:
| Skidmore: | 0.9% (3) |
| Texas: | 2.9% (262,060) |
6am:
| Skidmore: | 13.5% (46) |
| Texas: | 4.4% (403,423) |
6:30am:
| Skidmore: | 5.8% (20) |
| Texas: | 8.8% (808,876) |
7am:
| Skidmore: | 17.0% (58) |
| Texas: | 10.7% (976,557) |
7:30am:
| Skidmore: | 15.8% (54) |
| Texas: | 16.4% (1,500,904) |
8am:
| Skidmore: | 10.5% (36) |
| Texas: | 16.8% (1,536,308) |
8:30am:
| Skidmore: | 5.0% (17) |
| Texas: | 10.0% (913,601) |
9am:
| Skidmore: | 3.5% (12) |
| Texas: | 4.4% (398,656) |
10am:
| Skidmore: | 3.2% (11) |
| Texas: | 5.2% (472,592) |
11am:
| Skidmore: | 2.9% (10) |
| Texas: | 2.2% (197,844) |
12pm:
| Skidmore: | 0.9% (3) |
| Texas: | 0.9% (86,997) |
4pm:
| Skidmore: | 7.3% (25) |
| Texas: | 5.5% (503,565) |
>4pm:
| Skidmore: | 6.7% (23) |
| Texas: | 6.1% (563,107) |
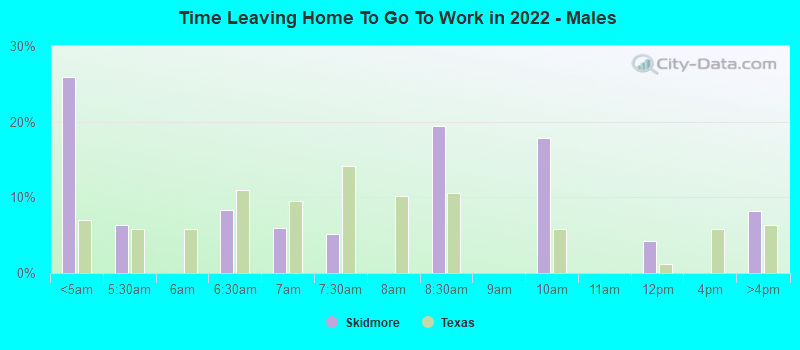
12:00 a.m. to 4:59 a.m. - Males:
| Skidmore: | 25.9% (49) |
| Texas: | 7.0% (477,284) |
5:00 a.m. to 5:29 a.m. - Males:
| Skidmore: | 6.4% (12) |
| Texas: | 5.8% (394,876) |
6:00 a.m. to 6:29 a.m. - Males:
| Skidmore: | 8.4% (16) |
| Texas: | 10.9% (751,118) |
6:30 a.m. to 6:59 a.m. - Males:
| Skidmore: | 5.9% (11) |
| Texas: | 9.5% (652,306) |
7:00 a.m. to 7:29 a.m. - Males:
| Skidmore: | 5.2% (10) |
| Texas: | 14.1% (970,598) |
8:00 a.m. to 8:29 a.m. - Males:
| Skidmore: | 19.4% (37) |
| Texas: | 10.6% (729,041) |
9:00 a.m. to 9:59 a.m. - Males:
| Skidmore: | 17.9% (34) |
| Texas: | 5.8% (401,071) |
11:00 a.m. to 11:59 a.m. - Males:
| Skidmore: | 4.3% (8) |
| Texas: | 1.2% (82,242) |
4:00 p.m. to 11:59 p.m. - Males:
| Skidmore: | 8.2% (16) |
| Texas: | 6.4% (435,950) |
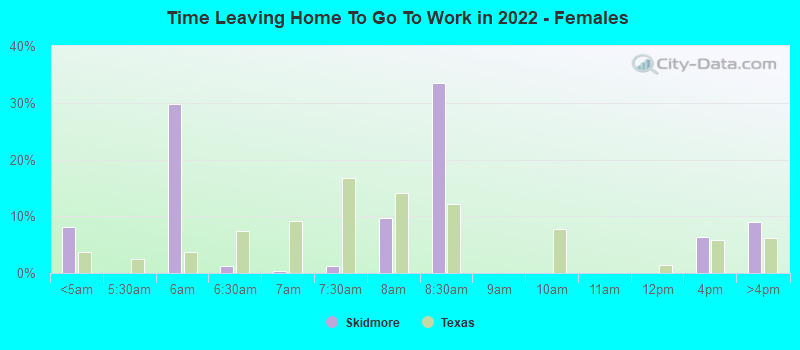
12:00 a.m. to 4:59 a.m. - Females:
| Skidmore: | 8.1% (19) |
| Texas: | 3.7% (200,980) |
5:30 a.m. to 5:59 a.m. - Females:
| Skidmore: | 29.8% (68) |
| Texas: | 3.7% (201,165) |
6:00 a.m. to 6:29 a.m. - Females:
| Skidmore: | 1.3% (3) |
| Texas: | 7.4% (403,902) |
6:30 a.m. to 6:59 a.m. - Females:
| Skidmore: | 0.4% (1) |
| Texas: | 9.1% (500,516) |
7:00 a.m. to 7:29 a.m. - Females:
| Skidmore: | 1.3% (3) |
| Texas: | 16.7% (914,879) |
7:30 a.m. to 7:59 a.m. - Females:
| Skidmore: | 9.7% (22) |
| Texas: | 14.1% (773,199) |
8:00 a.m. to 8:29 a.m. - Females:
| Skidmore: | 33.5% (77) |
| Texas: | 12.2% (671,134) |
12:00 p.m. to 3:59 p.m. - Females:
| Skidmore: | 6.4% (15) |
| Texas: | 5.9% (322,799) |
4:00 p.m. to 11:59 p.m. - Females:
| Skidmore: | 9.0% (21) |
| Texas: | 6.2% (341,122) |
Travel time to work
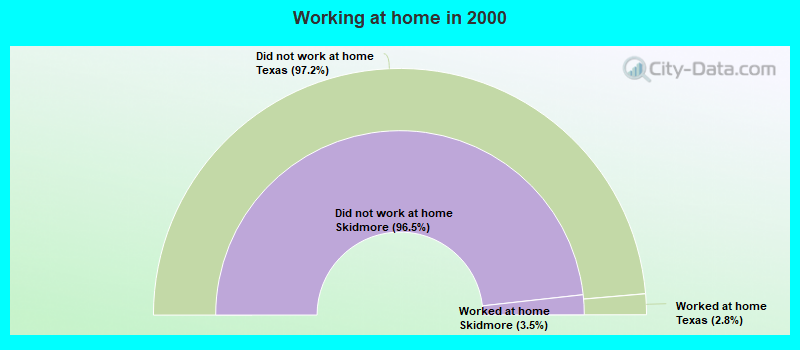
Percentage of workers working in this county: 78.8%
Number of people working at home: 25 (5.5% of all workers)
Number of people working at home: 25 (5.5% of all workers)
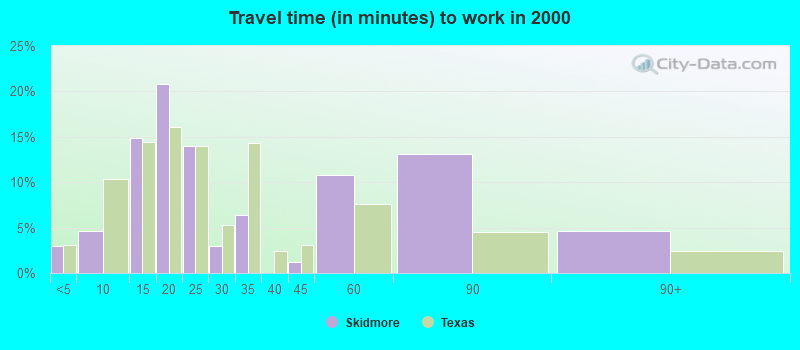
Less than 5 minutes:
| Skidmore: | 2.9% (10) |
| Texas: | 3.0% (277,642) |
5 to 9 minutes:
| Skidmore: | 4.7% (16) |
| Texas: | 10.3% (942,891) |
10 to 14 minutes:
| Skidmore: | 14.9% (51) |
| Texas: | 14.4% (1,317,555) |
15 to 19 minutes:
| Skidmore: | 20.8% (71) |
| Texas: | 16.0% (1,467,945) |
20 to 24 minutes:
| Skidmore: | 14.0% (48) |
| Texas: | 13.9% (1,276,781) |
25 to 29 minutes:
| Skidmore: | 2.9% (10) |
| Texas: | 5.3% (482,838) |
30 to 34 minutes:
| Skidmore: | 6.4% (22) |
| Texas: | 14.3% (1,309,699) |
40 to 44 minutes:
| Skidmore: | 1.2% (4) |
| Texas: | 3.1% (280,916) |
45 to 59 minutes:
| Skidmore: | 10.8% (37) |
| Texas: | 7.6% (692,006) |
60 to 89 minutes:
| Skidmore: | 13.2% (45) |
| Texas: | 4.6% (418,905) |
90 or more minutes:
| Skidmore: | 4.7% (16) |
| Texas: | 2.4% (218,800) |
Means of transportation to work
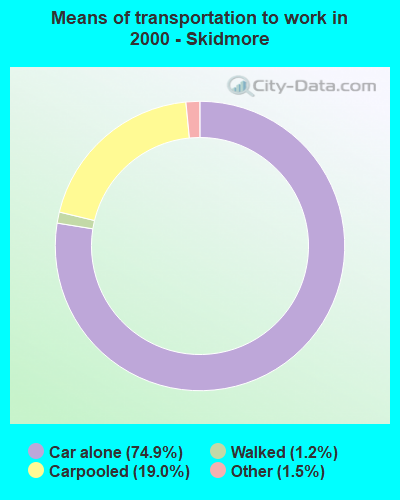

Drove car alone:
| Skidmore: | 74.9% (256) |
| Texas: | 77.7% (7,115,590) |
Carpooled:
| Skidmore: | 19.0% (65) |
| Texas: | 14.5% (1,326,012) |
Walked:
| Skidmore: | 1.2% (4) |
| Texas: | 1.9% (173,670) |
Other means:
| Skidmore: | 1.5% (5) |
| Texas: | 0.9% (86,692) |
Private vehicle occupancy
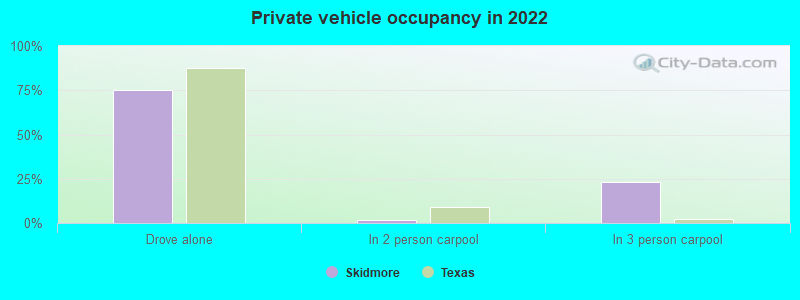
Drove alone:
| Skidmore: | 74.9% (301) |
| Texas: | 87.6% (10,283,021) |
In 2 person carpool:
| Skidmore: | 1.9% (8) |
| Texas: | 9.0% (1,052,595) |
In 3 person carpool:
| Skidmore: | 23.2% (93) |
| Texas: | 2.1% (244,139) |
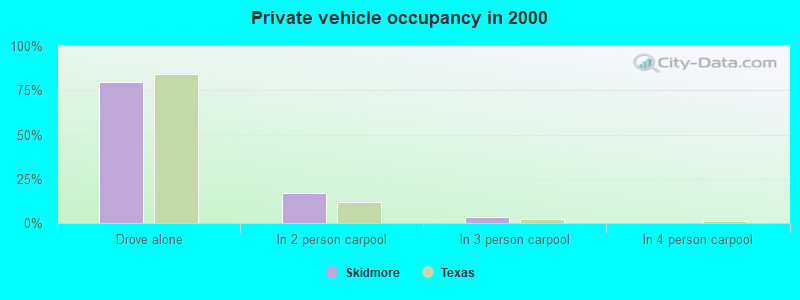
Drove alone:
| Skidmore: | 79.8% (256) |
| Texas: | 84.3% (7,115,590) |
In 2 person carpool:
| Skidmore: | 17.1% (55) |
| Texas: | 11.6% (982,994) |
In 3 person carpool:
| Skidmore: | 3.1% (10) |
| Texas: | 2.4% (201,602) |
Class of workers
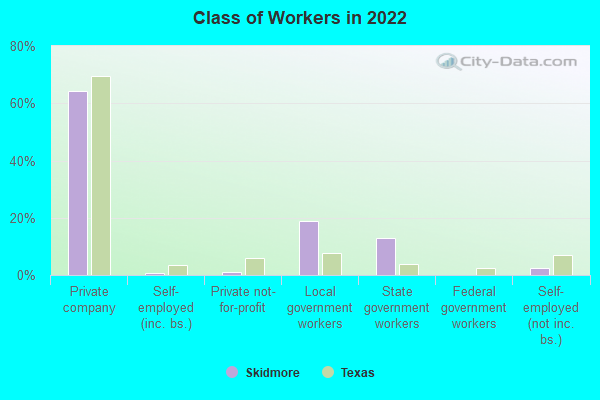
Employee of private company:
| Skidmore: | 64.2% (379) |
| Texas: | 69.6% (10,139,666) |
Self-employed in own incorporated business:
| Skidmore: | 0.7% (4) |
| Texas: | 3.5% (516,446) |
Private not-for-profit wage and salary workers:
| Skidmore: | 0.9% (5) |
| Texas: | 6.0% (870,454) |
Local government workers:
| Skidmore: | 19.0% (112) |
| Texas: | 7.6% (1,109,799) |
State government workers:
| Skidmore: | 12.9% (77) |
| Texas: | 3.8% (558,618) |
Self-employed workers in own not incorporated business:
| Skidmore: | 2.3% (14) |
| Texas: | 6.8% (998,270) |
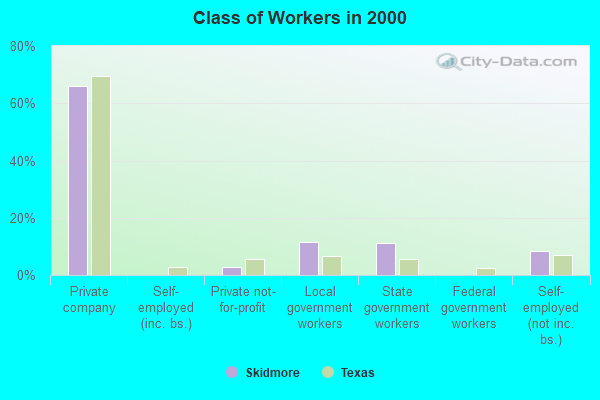
Employee of private company:
| Skidmore: | 66.1% (228) |
| Texas: | 69.6% (6,425,274) |
Private not-for-profit wage and salary workers:
| Skidmore: | 2.9% (10) |
| Texas: | 5.7% (526,631) |
Local government workers:
| Skidmore: | 11.6% (40) |
| Texas: | 6.6% (608,479) |
State government workers:
| Skidmore: | 11.0% (38) |
| Texas: | 5.4% (501,082) |
Self-employed workers in own not incorporated business:
| Skidmore: | 8.4% (29) |
| Texas: | 7.1% (653,527) |
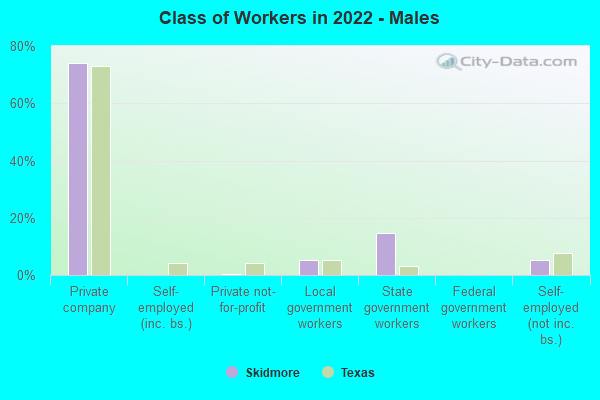
Employee of private company - Males:
| Skidmore: | 74.1% (189) |
| Texas: | 73.1% (5,788,450) |
Private not-for-profit wage and salary workers - Males:
| Skidmore: | 0.4% (1) |
| Texas: | 4.1% (323,476) |
Local government workers - Males:
| Skidmore: | 5.3% (14) |
| Texas: | 5.1% (405,467) |
State government workers - Males:
| Skidmore: | 14.8% (38) |
| Texas: | 3.0% (236,706) |
Self-employed workers in own not incorporated business - Males:
| Skidmore: | 5.3% (14) |
| Texas: | 7.7% (609,246) |
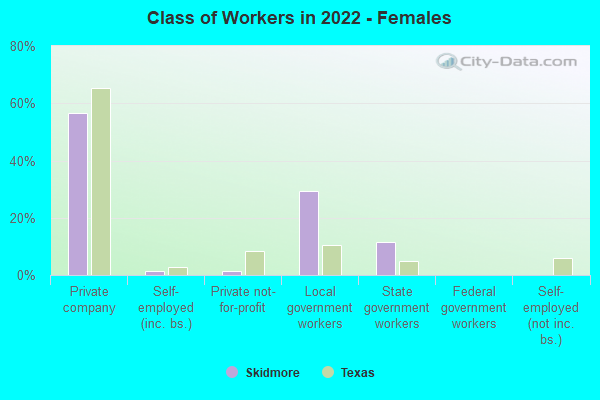
Employee of private company - Females:
| Skidmore: | 56.7% (191) |
| Texas: | 65.4% (4,351,216) |
Self-employed in own incorporated business - Females:
| Skidmore: | 1.2% (4) |
| Texas: | 2.8% (183,791) |
Private not-for-profit wage and salary workers - Females:
| Skidmore: | 1.2% (4) |
| Texas: | 8.2% (546,978) |
Local government workers - Females:
| Skidmore: | 29.3% (99) |
| Texas: | 10.6% (704,332) |
State government workers - Females:
| Skidmore: | 11.5% (39) |
| Texas: | 4.8% (321,912) |