Work and Jobs in St. Clair Shores, Michigan (MI) Detailed Stats
Occupations, Industries, Unemployment, Workers, Commute
Settings
X


Recent posts about work in St. Clair Shores, Michigan on our local forum with over 2,400,000 registered users:
 | Best areas for couple without kids? (35 replies) |
| Are there any jobs in Michigan???!!!!!!!!! (73 replies) |
| Should we return to Michigan? (17 replies) |
| is it worth comprimising walkability in a city? (137 replies) |
| Best Place to Live in Metro Detroit (148 replies) |
| Failure for RTA? (386 replies) |
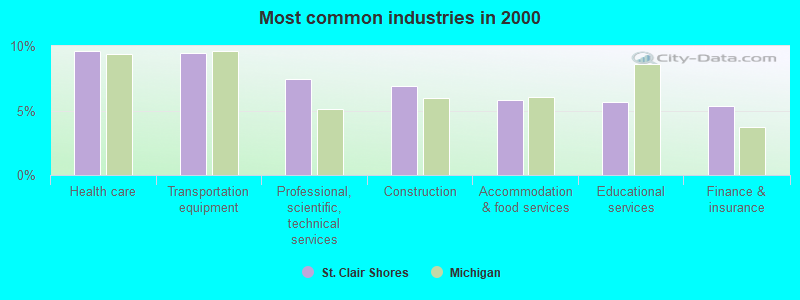
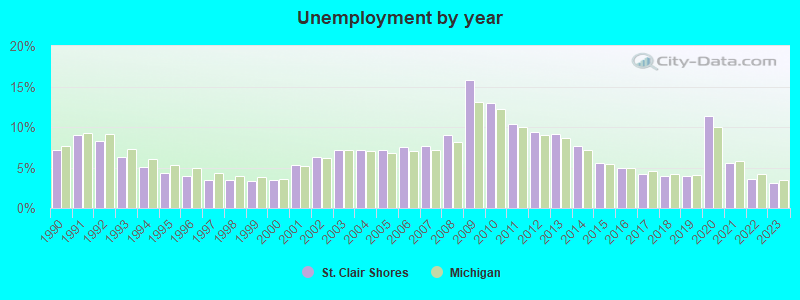
The unemployment rate in 2023 in St. Clair Shores, MI was 3.1%, which was 12.9% less than the unemployment rate of 3.5% across the entire state of Michigan. Compared to the unemployment rate of 9.1% in 2013, this represents a decrease of 193.5%. The most common industries in St. Clair Shores are: Health care (9.6% of civilian employees), Transportation equipment (9.4% of civilian employees), Professional, scientific, technical services (7.4% of civilian employees). 55.2% of workers work in Macomb County and 10.9% of all workers work at home. 74.3% of workers are employees of private companies, which is 6.1% greater than the rate of 69.8% across the entire state of Michigan.
Whole page based on the data from 2000 / 2022 when the population of St. Clair Shores, Michigan was 63,096 / 58,372
Whole page based on the data from 2000 / 2022 when the population of St. Clair Shores, Michigan was 63,096 / 58,372
Most common industries
Most common industries | |||
|---|---|---|---|
Industry | All | Males | Females |
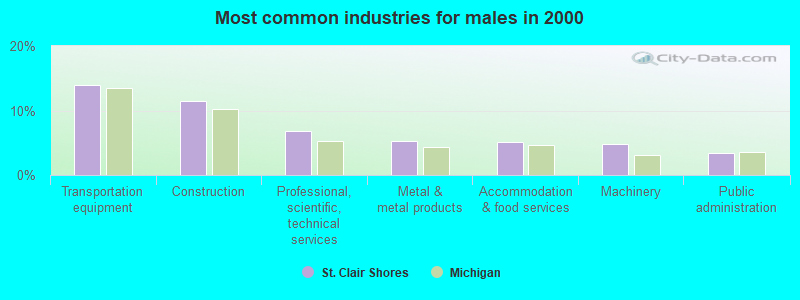
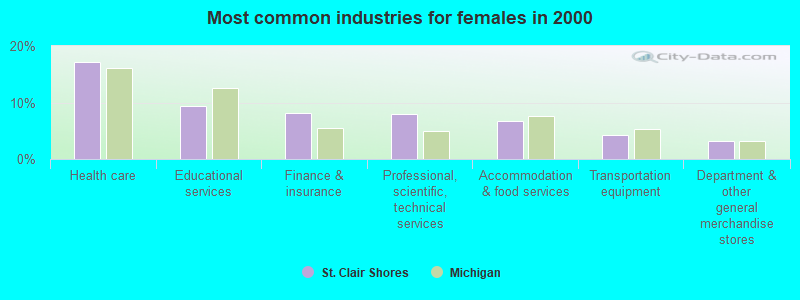
| Health care | 9.6% (2,862) | 3.1% (490) | 17.1% (2,372) |
| Transportation equipment | 9.4% (2,816) | 13.9% (2,234) | 4.2% (582) |
| Professional, scientific, and technical services | 7.4% (2,215) | 6.9% (1,105) | 8.0% (1,110) |
| Construction | 6.9% (2,063) | 11.4% (1,831) | 1.7% (232) |
| Accommodation and food services | 5.8% (1,743) | 5.1% (812) | 6.7% (931) |
| Educational services | 5.7% (1,695) | 2.5% (398) | 9.4% (1,297) |
| Finance and insurance | 5.3% (1,591) | 2.8% (456) | 8.2% (1,135) |
| Metal and metal products | 3.3% (985) | 5.2% (838) | 1.1% (147) |
| Public administration | 3.2% (954) | 3.5% (556) | 2.9% (398) |
| Machinery | 3.1% (915) | 4.9% (779) | 1.0% (136) |
| Administrative and support and waste management services | 2.7% (802) | 2.7% (431) | 2.7% (371) |
| Motor vehicle and parts dealers | 2.1% (634) | 3.0% (482) | 1.1% (152) |
| Real estate and rental and leasing | 1.9% (580) | 1.9% (298) | 2.0% (282) |
| Department and other general merchandise stores | 1.9% (555) | 0.7% (111) | 3.2% (444) |
| Arts, entertainment, and recreation | 1.8% (547) | 1.8% (285) | 1.9% (262) |
| Repair and maintenance | 1.8% (527) | 2.7% (432) | 0.7% (95) |
| Food and beverage stores | 1.6% (488) | 1.6% (251) | 1.7% (237) |
| Personal and laundry services | 1.5% (449) | 1.0% (155) | 2.1% (294) |
| Religious, grantmaking, civic, professional, and similar organizations | 1.4% (425) | 1.0% (159) | 1.9% (266) |
| Social assistance | 1.1% (337) | 0.1% (13) | 2.3% (324) |
| Building material and garden equipment and supplies dealers | 1.1% (328) | 1.3% (216) | 0.8% (112) |
| Publishing, and motion picture and sound recording industries | 1.0% (300) | 0.8% (131) | 1.2% (169) |
| Printing and related support activities | 1.0% (288) | 1.0% (159) | 0.9% (129) |
| Machinery, equipment, and supplies merchant wholesalers | 0.9% (282) | 1.3% (201) | 0.6% (81) |
| Miscellaneous manufacturing | 0.9% (280) | 1.0% (156) | 0.9% (124) |
| Clothing and accessories, including shoe, stores | 0.9% (257) | 0.3% (42) | 1.6% (215) |
| Utilities | 0.9% (255) | 1.2% (187) | 0.5% (68) |
| Plastics and rubber products | 0.8% (253) | 1.1% (179) | 0.5% (74) |
| Broadcasting and telecommunications | 0.8% (225) | 0.9% (138) | 0.6% (87) |
| Truck transportation | 0.7% (222) | 1.2% (185) | 0.3% (37) |
| Radio, TV, and computer stores | 0.7% (212) | 1.0% (156) | 0.4% (56) |
| Pharmacies and drug stores | 0.7% (211) | 0.5% (87) | 0.9% (124) |
| Used merchandise, gift, novelty, and souvenir, and other miscellaneous stores | 0.7% (210) | 0.3% (47) | 1.2% (163) |
| Groceries and related products merchant wholesalers | 0.7% (205) | 1.1% (173) | 0.2% (32) |
| U. S. Postal service | 0.7% (203) | 0.8% (123) | 0.6% (80) |
| Furniture and home furnishings, and household appliance stores | 0.7% (202) | 0.9% (141) | 0.4% (61) |
| Other transportation, and support activities, and couriers | 0.7% (197) | 0.9% (146) | 0.4% (51) |
| Other direct selling establishments | 0.5% (160) | 0.4% (71) | 0.6% (89) |
| Chemicals | 0.5% (146) | 0.6% (101) | 0.3% (45) |
| Sporting goods, camera, and hobby and toy stores | 0.5% (136) | 0.6% (103) | 0.2% (33) |
| Data processing, libraries, and other information services | 0.4% (134) | 0.4% (57) | 0.6% (77) |
| Private households | 0.4% (130) | 0.2% (27) | 0.7% (103) |
| Food | 0.4% (123) | 0.5% (80) | 0.3% (43) |
| Retail florists | 0.4% (121) | 0.1% (13) | 0.8% (108) |
| Electrical and electronic goods merchant wholesalers | 0.4% (117) | 0.5% (75) | 0.3% (42) |
| Motor vehicles, parts and supplies merchant wholesalers | 0.3% (102) | 0.6% (90) | 0.1% (12) |
| Miscellaneous nondurable goods merchant wholesalers | 0.3% (101) | 0.3% (51) | 0.4% (50) |
| Jewelry, luggage, and leather goods stores | 0.3% (88) | 0.0% (8) | 0.6% (80) |
| Furniture and related product manufacturing | 0.3% (84) | 0.4% (61) | 0.2% (23) |
| Electrical equipment, appliances, and components | 0.3% (75) | 0.3% (51) | 0.2% (24) |
| Health and personal care, except drug, stores | 0.3% (75) | 0.1% (19) | 0.4% (56) |
| Textile mills and textile products | 0.2% (62) | 0.1% (11) | 0.4% (51) |
| Computer and electronic products | 0.2% (60) | 0.2% (37) | 0.2% (23) |
| Warehousing and storage | 0.2% (58) | 0.3% (41) | 0.1% (17) |
| Drugs, sundries, and chemical and allied products merchant wholesalers | 0.2% (58) | 0.3% (51) | 0.1% (7) |
| Professional and commercial equipment and supplies merchant wholesalers | 0.2% (58) | 0.3% (52) | 0.0% (6) |
| Office supplies and stationery stores | 0.2% (51) | 0.2% (40) | 0.1% (11) |
| Air transportation | 0.2% (51) | 0.1% (22) | 0.2% (29) |
| Metals and minerals, except petroleum, merchant wholesalers | 0.2% (48) | 0.2% (31) | 0.1% (17) |
| Lumber and other construction materials merchant wholesalers | 0.2% (45) | 0.2% (33) | 0.1% (12) |
| Gasoline stations | 0.1% (42) | 0.1% (11) | 0.2% (31) |
| Hardware, plumbing and heating equipment, and supplies merchant wholesalers | 0.1% (42) | 0.2% (28) | 0.1% (14) |
| Paper | 0.1% (39) | 0.2% (33) | 0.0% (6) |
| Music stores | 0.1% (36) | 0.2% (31) | 0.0% (5) |
| Agriculture, forestry, fishing and hunting | 0.1% (29) | 0.1% (20) | 0.1% (9) |
| Miscellaneous durable goods merchant wholesalers | 0.1% (28) | 0.2% (28) | 0.0% (0) |
| Wood products | 0.1% (27) | 0.2% (27) | 0.0% (0) |
| Nonmetallic mineral products | 0.1% (26) | 0.1% (20) | 0.0% (6) |
| Vending machine operators | 0.1% (19) | 0.1% (19) | 0.0% (0) |
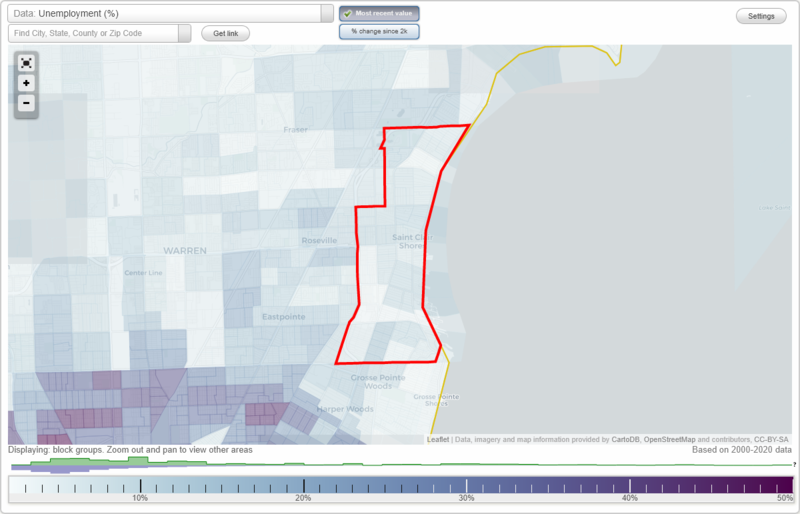
Unemployment in St. Clair Shores
- Unemployment by race in 2022
- Unemployment rate for White non-Hispanic residents
- 2.8%Males
- 3.7%Females
- Unemployment rate for Black residents
- 9.9%Males
- 5.3%Females
- Unemployment rate for two or more race residents
- 5.3%Males
- 0.9%Females
- Unemployment rate for Hispanic or Latino residents
- 3.7%Males
- 1.4%Females
- Unemployment by race in 2000
- Unemployment rate for White non-Hispanic residents
- 4.5%Males
- 4.1%Females
- Unemployment rate for other race residents
- 7.8%Males
- 5.6%Females
- Unemployment rate for two or more race residents
- 17.3%Males
- 8.9%Females
- Unemployment rate for Hispanic or Latino residents
- 8.4%Males
- 3.3%Females
Unemployment in 2023:
| St. Clair Shores: | 3.1% |
| Michigan: | 3.5% |
Unemployment in 2022:
| St. Clair Shores: | 3.6% |
| Michigan: | 4.2% |
Unemployment in 2021:
| St. Clair Shores: | 5.6% |
| Michigan: | 5.8% |
Unemployment in 2020:
| St. Clair Shores: | 11.3% |
| Michigan: | 10.0% |
Unemployment in 2019:
| St. Clair Shores: | 4.0% |
| Michigan: | 4.1% |
Unemployment in 2018:
| St. Clair Shores: | 3.9% |
| Michigan: | 4.2% |
Unemployment in 2017:
| St. Clair Shores: | 4.2% |
| Michigan: | 4.6% |
Unemployment in 2016:
| St. Clair Shores: | 5.0% |
| Michigan: | 5.0% |
Unemployment in 2015:
| St. Clair Shores: | 5.5% |
| Michigan: | 5.4% |
Unemployment in 2014:
| St. Clair Shores: | 7.6% |
| Michigan: | 7.2% |
Unemployment in 2013:
| St. Clair Shores: | 9.1% |
| Michigan: | 8.7% |
Unemployment in 2012:
| St. Clair Shores: | 9.4% |
| Michigan: | 9.0% |
Unemployment in 2011:
| St. Clair Shores: | 10.4% |
| Michigan: | 10.0% |
Unemployment in 2010:
| St. Clair Shores: | 13.0% |
| Michigan: | 12.2% |
Unemployment in 2009:
| St. Clair Shores: | 15.8% |
| Michigan: | 13.1% |
Unemployment in 2008:
| St. Clair Shores: | 9.0% |
| Michigan: | 8.2% |
Unemployment in 2007:
| St. Clair Shores: | 7.6% |
| Michigan: | 7.1% |
Unemployment in 2006:
| St. Clair Shores: | 7.5% |
| Michigan: | 7.0% |
Unemployment in 2005:
| St. Clair Shores: | 7.1% |
| Michigan: | 6.8% |
Unemployment in 2004:
| St. Clair Shores: | 7.2% |
| Michigan: | 7.0% |
Unemployment in 2003:
| St. Clair Shores: | 7.2% |
| Michigan: | 7.1% |
Unemployment in 2002:
| St. Clair Shores: | 6.3% |
| Michigan: | 6.2% |
Unemployment in 2001:
| St. Clair Shores: | 5.3% |
| Michigan: | 5.2% |
Unemployment in 2000:
| St. Clair Shores: | 3.5% |
| Michigan: | 3.6% |
Unemployment in 1999:
| St. Clair Shores: | 3.3% |
| Michigan: | 3.8% |
Unemployment in 1998:
| St. Clair Shores: | 3.4% |
| Michigan: | 4.0% |
Unemployment in 1997:
| St. Clair Shores: | 3.5% |
| Michigan: | 4.3% |
Unemployment in 1996:
| St. Clair Shores: | 4.0% |
| Michigan: | 4.9% |
Unemployment in 1995:
| St. Clair Shores: | 4.3% |
| Michigan: | 5.3% |
Unemployment in 1994:
| St. Clair Shores: | 5.1% |
| Michigan: | 6.1% |
Unemployment in 1993:
| St. Clair Shores: | 6.3% |
| Michigan: | 7.3% |
Unemployment in 1992:
| St. Clair Shores: | 8.3% |
| Michigan: | 9.1% |
Unemployment in 1991:
| St. Clair Shores: | 9.0% |
| Michigan: | 9.3% |
Unemployment in 1990:
| St. Clair Shores: | 7.2% |
| Michigan: | 7.7% |
Time leaving home to go to work
12:00 a.m. to 4:59 a.m.:
| St. Clair Shores: | 4.7% (1,200) |
| Michigan: | 5.3% (217,059) |
5:00 a.m. to 5:29 a.m.:
| St. Clair Shores: | 3.7% (958) |
| Michigan: | 3.8% (153,609) |
5:30 a.m. to 5:59 a.m.:
| St. Clair Shores: | 5.2% (1,332) |
| Michigan: | 5.1% (205,261) |
6:00 a.m. to 6:29 a.m.:
| St. Clair Shores: | 9.4% (2,415) |
| Michigan: | 8.0% (325,839) |
6:30 a.m. to 6:59 a.m.:
| St. Clair Shores: | 7.9% (2,038) |
| Michigan: | 9.1% (371,022) |
7:00 a.m. to 7:29 a.m.:
| St. Clair Shores: | 14.7% (3,792) |
| Michigan: | 12.8% (521,843) |
7:30 a.m. to 7:59 a.m.:
| St. Clair Shores: | 12.9% (3,331) |
| Michigan: | 12.4% (502,248) |
8:00 a.m. to 8:29 a.m.:
| St. Clair Shores: | 12.0% (3,099) |
| Michigan: | 10.8% (438,208) |
8:30 a.m. to 8:59 a.m.:
| St. Clair Shores: | 4.3% (1,105) |
| Michigan: | 5.6% (229,029) |
9:00 a.m. to 9:59 a.m.:
| St. Clair Shores: | 6.3% (1,616) |
| Michigan: | 6.5% (265,944) |
10:00 a.m. to 10:59 a.m.:
| St. Clair Shores: | 3.6% (924) |
| Michigan: | 3.2% (130,748) |
11:00 a.m. to 11:59 a.m.:
| St. Clair Shores: | 1.2% (321) |
| Michigan: | 1.6% (65,426) |
12:00 p.m. to 3:59 p.m.:
| St. Clair Shores: | 7.1% (1,819) |
| Michigan: | 8.5% (343,555) |
4:00 p.m. to 11:59 p.m.:
| St. Clair Shores: | 6.9% (1,770) |
| Michigan: | 7.2% (293,541) |
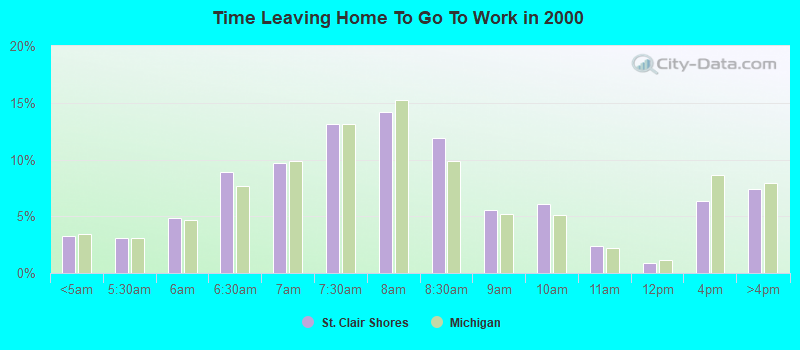
<5am:
| St. Clair Shores: | 3.2% (946) |
| Michigan: | 3.4% (156,327) |
5:30am:
| St. Clair Shores: | 3.1% (904) |
| Michigan: | 3.1% (139,699) |
6am:
| St. Clair Shores: | 4.8% (1,409) |
| Michigan: | 4.7% (211,446) |
6:30am:
| St. Clair Shores: | 8.9% (2,616) |
| Michigan: | 7.7% (349,878) |
7am:
| St. Clair Shores: | 9.7% (2,842) |
| Michigan: | 9.8% (446,636) |
7:30am:
| St. Clair Shores: | 13.1% (3,846) |
| Michigan: | 13.2% (597,402) |
8am:
| St. Clair Shores: | 14.1% (4,140) |
| Michigan: | 15.3% (692,901) |
8:30am:
| St. Clair Shores: | 11.9% (3,492) |
| Michigan: | 9.9% (448,050) |
9am:
| St. Clair Shores: | 5.6% (1,635) |
| Michigan: | 5.2% (235,689) |
10am:
| St. Clair Shores: | 6.1% (1,782) |
| Michigan: | 5.1% (233,210) |
11am:
| St. Clair Shores: | 2.4% (705) |
| Michigan: | 2.2% (98,395) |
12pm:
| St. Clair Shores: | 0.9% (264) |
| Michigan: | 1.1% (50,205) |
4pm:
| St. Clair Shores: | 6.4% (1,864) |
| Michigan: | 8.6% (391,612) |
>4pm:
| St. Clair Shores: | 7.4% (2,154) |
| Michigan: | 8.0% (361,157) |
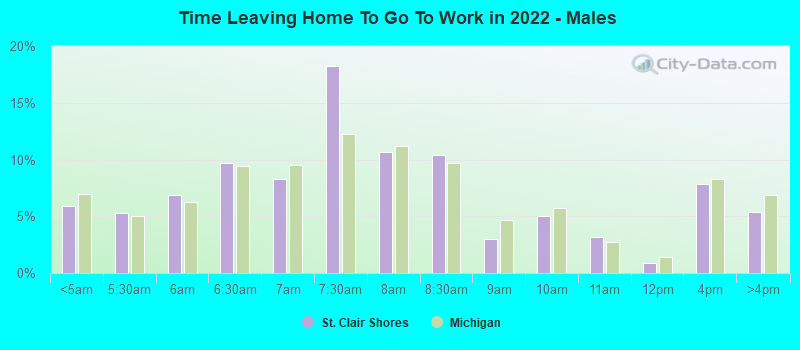
12:00 a.m. to 4:59 a.m. - Males:
| St. Clair Shores: | 5.9% (828) |
| Michigan: | 6.9% (150,486) |
5:00 a.m. to 5:29 a.m. - Males:
| St. Clair Shores: | 5.3% (739) |
| Michigan: | 5.0% (108,967) |
5:30 a.m. to 5:59 a.m. - Males:
| St. Clair Shores: | 6.9% (964) |
| Michigan: | 6.3% (136,770) |
6:00 a.m. to 6:29 a.m. - Males:
| St. Clair Shores: | 9.7% (1,354) |
| Michigan: | 9.5% (205,411) |
6:30 a.m. to 6:59 a.m. - Males:
| St. Clair Shores: | 8.3% (1,154) |
| Michigan: | 9.5% (206,578) |
7:00 a.m. to 7:29 a.m. - Males:
| St. Clair Shores: | 18.2% (2,538) |
| Michigan: | 12.2% (265,994) |
7:30 a.m. to 7:59 a.m. - Males:
| St. Clair Shores: | 10.6% (1,485) |
| Michigan: | 11.2% (242,506) |
8:00 a.m. to 8:29 a.m. - Males:
| St. Clair Shores: | 10.4% (1,452) |
| Michigan: | 9.7% (211,431) |
8:30 a.m. to 8:59 a.m. - Males:
| St. Clair Shores: | 3.0% (414) |
| Michigan: | 4.7% (101,817) |
9:00 a.m. to 9:59 a.m. - Males:
| St. Clair Shores: | 5.0% (702) |
| Michigan: | 5.8% (125,232) |
10:00 a.m. to 10:59 a.m. - Males:
| St. Clair Shores: | 3.2% (445) |
| Michigan: | 2.7% (58,514) |
11:00 a.m. to 11:59 a.m. - Males:
| St. Clair Shores: | 0.8% (117) |
| Michigan: | 1.4% (30,535) |
12:00 p.m. to 3:59 p.m. - Males:
| St. Clair Shores: | 7.8% (1,094) |
| Michigan: | 8.3% (180,250) |
4:00 p.m. to 11:59 p.m. - Males:
| St. Clair Shores: | 5.4% (749) |
| Michigan: | 6.8% (148,394) |
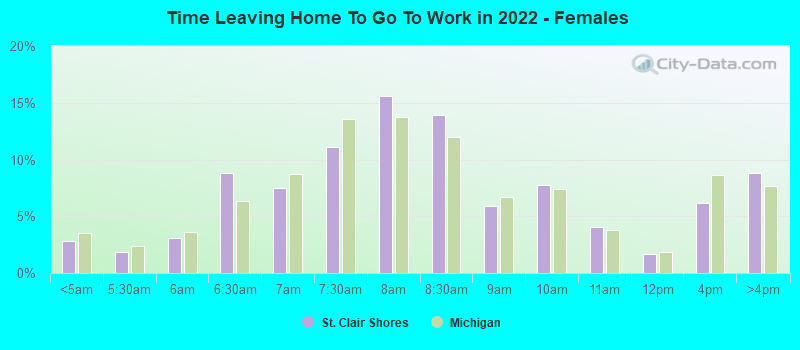
12:00 a.m. to 4:59 a.m. - Females:
| St. Clair Shores: | 2.8% (334) |
| Michigan: | 3.5% (66,573) |
5:00 a.m. to 5:29 a.m. - Females:
| St. Clair Shores: | 1.9% (218) |
| Michigan: | 2.4% (44,642) |
5:30 a.m. to 5:59 a.m. - Females:
| St. Clair Shores: | 3.1% (365) |
| Michigan: | 3.6% (68,491) |
6:00 a.m. to 6:29 a.m. - Females:
| St. Clair Shores: | 8.8% (1,039) |
| Michigan: | 6.4% (120,428) |
6:30 a.m. to 6:59 a.m. - Females:
| St. Clair Shores: | 7.5% (881) |
| Michigan: | 8.7% (164,444) |
7:00 a.m. to 7:29 a.m. - Females:
| St. Clair Shores: | 11.1% (1,313) |
| Michigan: | 13.5% (255,849) |
7:30 a.m. to 7:59 a.m. - Females:
| St. Clair Shores: | 15.6% (1,841) |
| Michigan: | 13.7% (259,742) |
8:00 a.m. to 8:29 a.m. - Females:
| St. Clair Shores: | 13.9% (1,636) |
| Michigan: | 12.0% (226,777) |
8:30 a.m. to 8:59 a.m. - Females:
| St. Clair Shores: | 5.9% (695) |
| Michigan: | 6.7% (127,212) |
9:00 a.m. to 9:59 a.m. - Females:
| St. Clair Shores: | 7.7% (912) |
| Michigan: | 7.4% (140,712) |
10:00 a.m. to 10:59 a.m. - Females:
| St. Clair Shores: | 4.1% (481) |
| Michigan: | 3.8% (72,234) |
11:00 a.m. to 11:59 a.m. - Females:
| St. Clair Shores: | 1.7% (202) |
| Michigan: | 1.8% (34,891) |
12:00 p.m. to 3:59 p.m. - Females:
| St. Clair Shores: | 6.2% (726) |
| Michigan: | 8.6% (163,305) |
4:00 p.m. to 11:59 p.m. - Females:
| St. Clair Shores: | 8.8% (1,040) |
| Michigan: | 7.7% (145,147) |
Travel time to work
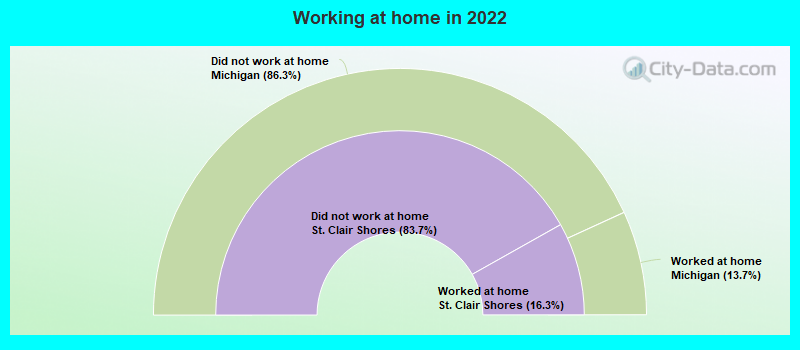
Percentage of workers working in this county: 55.2%
Number of people working at home: 3,322 (10.9% of all workers)
Daytime population change due to commuting: -11,946 (-18.9%)
Workers who live and work in this city: 5,277 (18.0%)
Number of people working at home: 3,322 (10.9% of all workers)
Daytime population change due to commuting: -11,946 (-18.9%)
Workers who live and work in this city: 5,277 (18.0%)
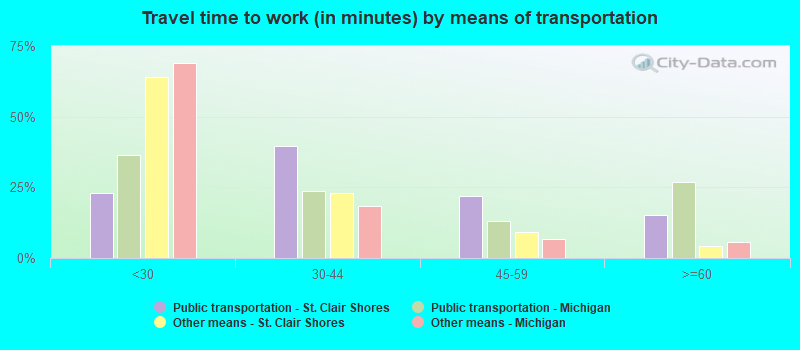
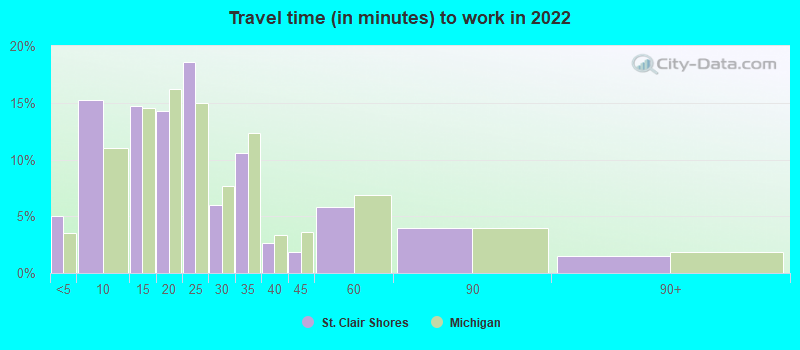
Less than 5 minutes:
| St. Clair Shores: | 5.0% (709) |
| Michigan: | 3.6% (143,584) |
5 to 9 minutes:
| St. Clair Shores: | 15.3% (2,159) |
| Michigan: | 11.0% (442,434) |
10 to 14 minutes:
| St. Clair Shores: | 14.7% (2,080) |
| Michigan: | 14.5% (585,037) |
15 to 19 minutes:
| St. Clair Shores: | 14.3% (2,023) |
| Michigan: | 16.2% (652,002) |
20 to 24 minutes:
| St. Clair Shores: | 18.6% (2,622) |
| Michigan: | 15.0% (604,197) |
25 to 29 minutes:
| St. Clair Shores: | 6.0% (846) |
| Michigan: | 7.7% (309,175) |
30 to 34 minutes:
| St. Clair Shores: | 10.6% (1,491) |
| Michigan: | 12.4% (498,080) |
35 to 39 minutes:
| St. Clair Shores: | 2.7% (379) |
| Michigan: | 3.4% (136,295) |
40 to 44 minutes:
| St. Clair Shores: | 1.9% (267) |
| Michigan: | 3.6% (144,954) |
45 to 59 minutes:
| St. Clair Shores: | 5.8% (818) |
| Michigan: | 6.9% (278,387) |
60 to 89 minutes:
| St. Clair Shores: | 3.9% (556) |
| Michigan: | 4.0% (159,456) |
90 or more minutes:
| St. Clair Shores: | 1.5% (208) |
| Michigan: | 1.9% (76,015) |
Less than 5 minutes:
| St. Clair Shores: | 2.2% (649) |
| Michigan: | 3.5% (158,315) |
5 to 9 minutes:
| St. Clair Shores: | 10.2% (2,990) |
| Michigan: | 11.2% (507,653) |
10 to 14 minutes:
| St. Clair Shores: | 12.5% (3,661) |
| Michigan: | 15.0% (681,990) |
15 to 19 minutes:
| St. Clair Shores: | 14.9% (4,359) |
| Michigan: | 15.6% (708,036) |
20 to 24 minutes:
| St. Clair Shores: | 15.9% (4,664) |
| Michigan: | 14.9% (675,865) |
25 to 29 minutes:
| St. Clair Shores: | 6.4% (1,872) |
| Michigan: | 6.4% (291,938) |
30 to 34 minutes:
| St. Clair Shores: | 14.2% (4,150) |
| Michigan: | 12.0% (546,870) |
35 to 39 minutes:
| St. Clair Shores: | 3.5% (1,033) |
| Michigan: | 2.8% (126,158) |
40 to 44 minutes:
| St. Clair Shores: | 4.8% (1,392) |
| Michigan: | 3.3% (147,930) |
45 to 59 minutes:
| St. Clair Shores: | 9.0% (2,639) |
| Michigan: | 6.7% (304,785) |
60 to 89 minutes:
| St. Clair Shores: | 2.5% (736) |
| Michigan: | 3.8% (171,403) |
90 or more minutes:
| St. Clair Shores: | 1.6% (454) |
| Michigan: | 2.0% (91,664) |
Less than 5 minutes - Males:
| St. Clair Shores: | 6.8% (416) |
| Michigan: | 3.5% (75,744) |
5 to 9 minutes - Males:
| St. Clair Shores: | 14.1% (865) |
| Michigan: | 9.5% (205,370) |
10 to 14 minutes - Males:
| St. Clair Shores: | 13.7% (840) |
| Michigan: | 13.2% (284,763) |
15 to 19 minutes - Males:
| St. Clair Shores: | 13.6% (833) |
| Michigan: | 15.9% (341,778) |
20 to 24 minutes - Males:
| St. Clair Shores: | 17.2% (1,057) |
| Michigan: | 14.5% (312,847) |
25 to 29 minutes - Males:
| St. Clair Shores: | 7.0% (431) |
| Michigan: | 7.8% (167,430) |
30 to 34 minutes - Males:
| St. Clair Shores: | 10.9% (668) |
| Michigan: | 12.8% (274,470) |
35 to 39 minutes - Males:
| St. Clair Shores: | 1.9% (118) |
| Michigan: | 3.6% (76,783) |
40 to 44 minutes - Males:
| St. Clair Shores: | 1.3% (80) |
| Michigan: | 3.9% (84,238) |
45 to 59 minutes - Males:
| St. Clair Shores: | 6.9% (424) |
| Michigan: | 8.0% (172,374) |
60 to 89 minutes - Males:
| St. Clair Shores: | 4.5% (274) |
| Michigan: | 4.8% (103,060) |
90 or more minutes - Males:
| St. Clair Shores: | 1.4% (88) |
| Michigan: | 2.4% (51,962) |
Less than 5 minutes - Females:
| St. Clair Shores: | 3.5% (282) |
| Michigan: | 3.6% (67,840) |
5 to 9 minutes - Females:
| St. Clair Shores: | 16.3% (1,301) |
| Michigan: | 12.6% (237,064) |
10 to 14 minutes - Females:
| St. Clair Shores: | 15.7% (1,251) |
| Michigan: | 16.0% (300,274) |
15 to 19 minutes - Females:
| St. Clair Shores: | 14.6% (1,162) |
| Michigan: | 16.5% (310,224) |
20 to 24 minutes - Females:
| St. Clair Shores: | 19.7% (1,566) |
| Michigan: | 15.5% (291,350) |
25 to 29 minutes - Females:
| St. Clair Shores: | 5.1% (409) |
| Michigan: | 7.5% (141,745) |
30 to 34 minutes - Females:
| St. Clair Shores: | 10.4% (831) |
| Michigan: | 11.9% (223,610) |
35 to 39 minutes - Females:
| St. Clair Shores: | 3.7% (292) |
| Michigan: | 3.2% (59,512) |
40 to 44 minutes - Females:
| St. Clair Shores: | 2.4% (193) |
| Michigan: | 3.2% (60,716) |
45 to 59 minutes - Females:
| St. Clair Shores: | 4.7% (370) |
| Michigan: | 5.6% (106,013) |
60 to 89 minutes - Females:
| St. Clair Shores: | 3.1% (246) |
| Michigan: | 3.0% (56,396) |
90 or more minutes - Females:
| St. Clair Shores: | 1.3% (101) |
| Michigan: | 1.3% (24,053) |
Means of transportation to work
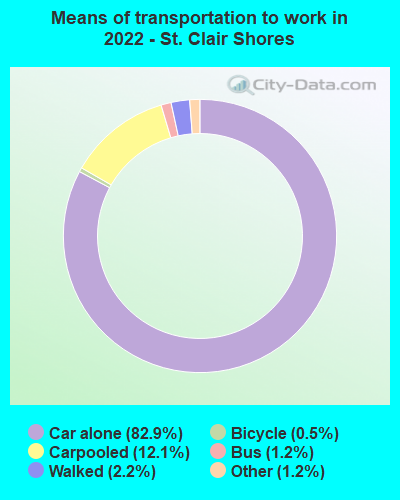
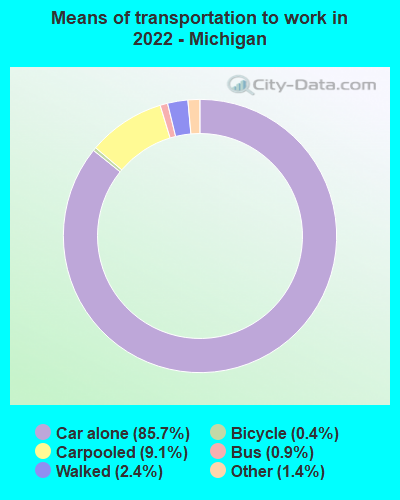
Drove car alone:
| St. Clair Shores: | 82.9% (12,450) |
| Michigan: | 85.7% (1,595,046) |
Carpooled:
| St. Clair Shores: | 12.1% (1,819) |
| Michigan: | 9.1% (187,180) |
Bus:
| St. Clair Shores: | 1.2% (177) |
| Michigan: | 0.9% (20,524) |
Bicycle:
| St. Clair Shores: | 0.5% (71) |
| Michigan: | 0.4% (5,746) |
Walked:
| St. Clair Shores: | 2.2% (325) |
| Michigan: | 2.4% (44,504) |
Other means:
| St. Clair Shores: | 1.2% (182) |
| Michigan: | 1.4% (25,014) |
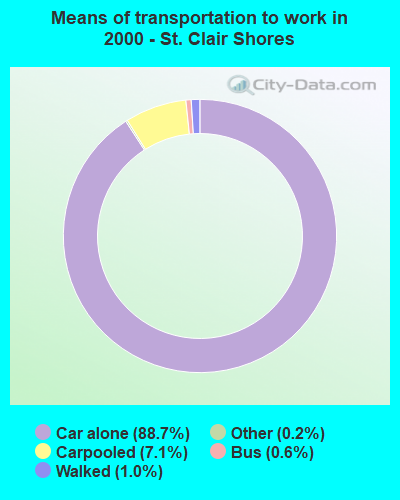

Drove car alone:
| St. Clair Shores: | 88.7% (25,959) |
| Michigan: | 83.2% (3,776,535) |
Carpooled:
| St. Clair Shores: | 7.1% (2,074) |
| Michigan: | 9.7% (440,606) |
Bus or trolley bus:
| St. Clair Shores: | 0.6% (181) |
| Michigan: | 1.2% (54,423) |
Taxicab:
| St. Clair Shores: | 0.0% (5) |
| Michigan: | 0.1% (4,222) |
Bicycle:
| St. Clair Shores: | 0.0% (9) |
| Michigan: | 0.2% (10,034) |
Walked:
| St. Clair Shores: | 1.0% (307) |
| Michigan: | 2.2% (101,506) |
Other means:
| St. Clair Shores: | 0.2% (64) |
| Michigan: | 0.5% (21,691) |
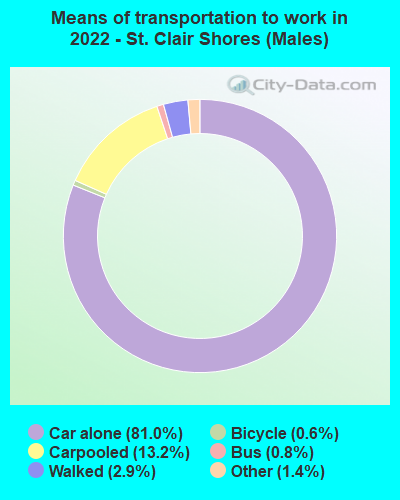

Drove car alone - Males:
| St. Clair Shores: | 81.0% (5,239) |
| Michigan: | 86.5% (1,595,046) |
Carpooled - Males:
| St. Clair Shores: | 13.2% (854) |
| Michigan: | 8.4% (187,180) |
Bus - Males:
| St. Clair Shores: | 0.8% (54) |
| Michigan: | 0.8% (20,524) |
Bicycle - Males:
| St. Clair Shores: | 0.6% (41) |
| Michigan: | 0.5% (5,746) |
Walked - Males:
| St. Clair Shores: | 2.9% (191) |
| Michigan: | 2.4% (44,504) |
Other means - Males:
| St. Clair Shores: | 1.4% (91) |
| Michigan: | 1.4% (25,014) |
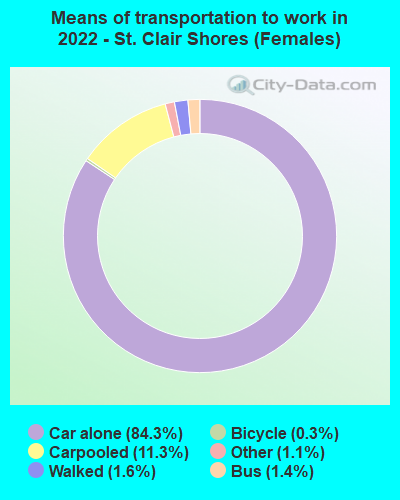
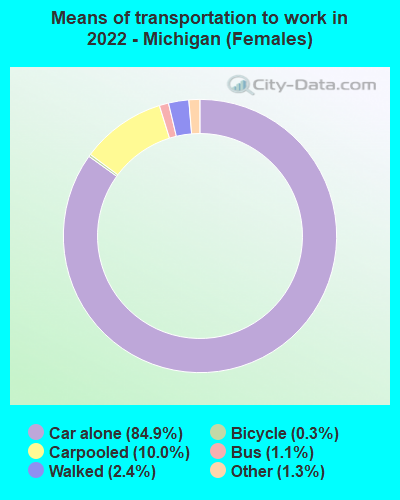
Drove car alone - Females:
| St. Clair Shores: | 84.3% (7,223) |
| Michigan: | 84.9% (1,595,046) |
Carpooled - Females:
| St. Clair Shores: | 11.3% (966) |
| Michigan: | 10.0% (187,180) |
Bus - Females:
| St. Clair Shores: | 1.4% (123) |
| Michigan: | 1.1% (20,524) |
Bicycle - Females:
| St. Clair Shores: | 0.3% (29) |
| Michigan: | 0.3% (5,746) |
Walked - Females:
| St. Clair Shores: | 1.6% (135) |
| Michigan: | 2.4% (44,504) |
Other means - Females:
| St. Clair Shores: | 1.1% (91) |
| Michigan: | 1.3% (25,014) |
Private vehicle occupancy
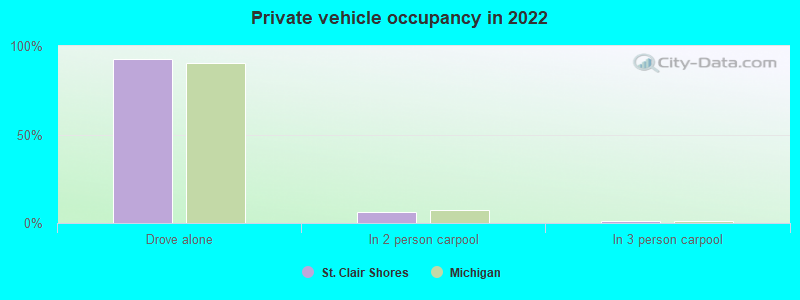
Drove alone:
| St. Clair Shores: | 92.4% (22,908) |
| Michigan: | 90.4% (3,484,723) |
In 2 person carpool:
| St. Clair Shores: | 5.9% (1,475) |
| Michigan: | 7.3% (282,230) |
In 3 person carpool:
| St. Clair Shores: | 1.0% (259) |
| Michigan: | 1.4% (52,118) |
In 4 person carpool:
| St. Clair Shores: | 0.3% (65) |
| Michigan: | 0.5% (20,051) |
In 5-6 person carpool:
| St. Clair Shores: | 0.1% (30) |
| Michigan: | 0.3% (10,433) |
In 7+ person carpool:
| St. Clair Shores: | 0.0% (7) |
| Michigan: | 0.1% (4,936) |
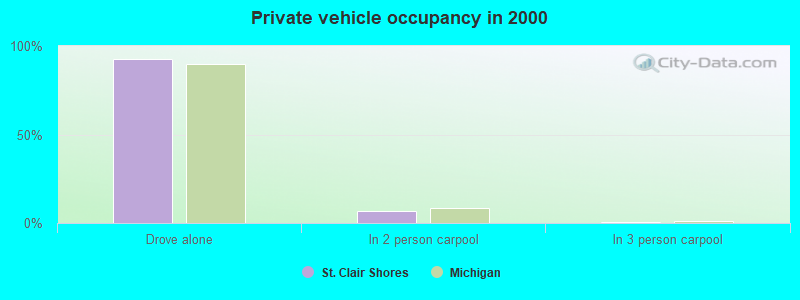
Drove alone:
| St. Clair Shores: | 92.6% (25,959) |
| Michigan: | 89.6% (3,776,535) |
In 2 person carpool:
| St. Clair Shores: | 6.7% (1,865) |
| Michigan: | 8.5% (358,473) |
In 3 person carpool:
| St. Clair Shores: | 0.4% (109) |
| Michigan: | 1.3% (53,301) |
In 4 person carpool:
| St. Clair Shores: | 0.2% (67) |
| Michigan: | 0.4% (16,740) |
In 5-6 person carpool:
| St. Clair Shores: | 0.1% (33) |
| Michigan: | 0.2% (8,051) |
Class of workers
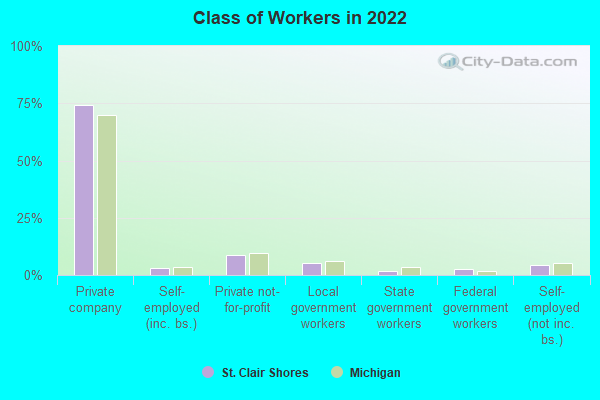
Employee of private company:
| St. Clair Shores: | 74.3% (22,910) |
| Michigan: | 69.8% (3,350,300) |
Self-employed in own incorporated business:
| St. Clair Shores: | 3.1% (969) |
| Michigan: | 3.5% (168,846) |
Private not-for-profit wage and salary workers:
| St. Clair Shores: | 8.8% (2,702) |
| Michigan: | 9.8% (468,535) |
Local government workers:
| St. Clair Shores: | 5.3% (1,626) |
| Michigan: | 6.3% (300,493) |
State government workers:
| St. Clair Shores: | 1.7% (516) |
| Michigan: | 3.6% (171,998) |
Federal government workers:
| St. Clair Shores: | 2.6% (800) |
| Michigan: | 1.6% (76,540) |
Self-employed workers in own not incorporated business:
| St. Clair Shores: | 4.2% (1,290) |
| Michigan: | 5.3% (256,382) |
Unpaid family workers:
| St. Clair Shores: | 0.0% (6) |
| Michigan: | 0.1% (7,134) |
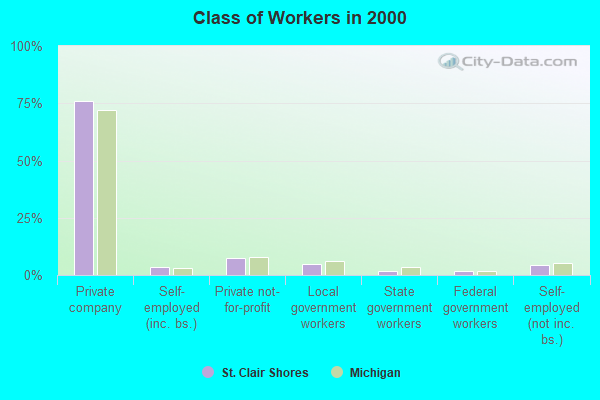
Employee of private company:
| St. Clair Shores: | 75.9% (22,685) |
| Michigan: | 71.9% (3,336,174) |
Self-employed in own incorporated business:
| St. Clair Shores: | 3.5% (1,053) |
| Michigan: | 3.1% (145,931) |
Private not-for-profit wage and salary workers:
| St. Clair Shores: | 7.6% (2,264) |
| Michigan: | 8.0% (370,593) |
Local government workers:
| St. Clair Shores: | 4.9% (1,463) |
| Michigan: | 6.2% (285,684) |
State government workers:
| St. Clair Shores: | 1.6% (468) |
| Michigan: | 3.7% (170,984) |
Federal government workers:
| St. Clair Shores: | 1.7% (514) |
| Michigan: | 1.5% (71,533) |
Self-employed workers in own not incorporated business:
| St. Clair Shores: | 4.5% (1,359) |
| Michigan: | 5.2% (243,300) |
Unpaid family workers:
| St. Clair Shores: | 0.2% (72) |
| Michigan: | 0.3% (13,262) |
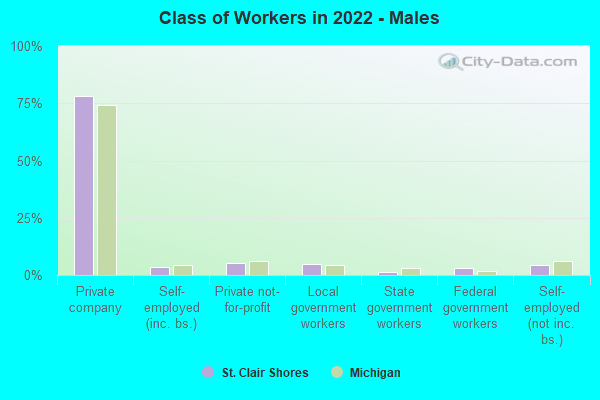
Employee of private company - Males:
| St. Clair Shores: | 78.1% (12,768) |
| Michigan: | 74.4% (1,882,423) |
Self-employed in own incorporated business - Males:
| St. Clair Shores: | 3.6% (583) |
| Michigan: | 4.6% (115,825) |
Private not-for-profit wage and salary workers - Males:
| St. Clair Shores: | 5.2% (852) |
| Michigan: | 6.0% (151,243) |
Local government workers - Males:
| St. Clair Shores: | 4.7% (764) |
| Michigan: | 4.4% (111,027) |
State government workers - Males:
| St. Clair Shores: | 1.2% (189) |
| Michigan: | 2.9% (74,018) |
Federal government workers - Males:
| St. Clair Shores: | 2.9% (472) |
| Michigan: | 1.6% (39,580) |
Self-employed workers in own not incorporated business - Males:
| St. Clair Shores: | 4.3% (706) |
| Michigan: | 6.0% (152,865) |
Unpaid family workers - Males:
| St. Clair Shores: | 0.0% (6) |
| Michigan: | 0.2% (3,917) |
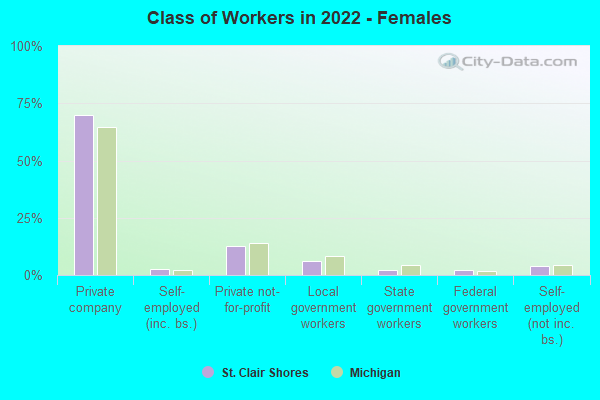
Employee of private company - Females:
| St. Clair Shores: | 70.0% (10,142) |
| Michigan: | 64.7% (1,467,877) |
Self-employed in own incorporated business - Females:
| St. Clair Shores: | 2.7% (386) |
| Michigan: | 2.3% (53,021) |
Private not-for-profit wage and salary workers - Females:
| St. Clair Shores: | 12.8% (1,850) |
| Michigan: | 14.0% (317,292) |
Local government workers - Females:
| St. Clair Shores: | 6.0% (862) |
| Michigan: | 8.3% (189,466) |
State government workers - Females:
| St. Clair Shores: | 2.3% (327) |
| Michigan: | 4.3% (97,980) |
Federal government workers - Females:
| St. Clair Shores: | 2.3% (328) |
| Michigan: | 1.6% (36,960) |
Self-employed workers in own not incorporated business - Females:
| St. Clair Shores: | 4.0% (584) |
| Michigan: | 4.6% (103,517) |