Work and Jobs in Summerland, California (CA) Detailed Stats
Occupations, Industries, Unemployment, Workers, Commute
Settings
X


Recent posts about work in Summerland, California on our local forum with over 2,400,000 registered users:

Latest news about work in Summerland, CA collected exclusively by city-data.com from local newspapers, TV, and radio stations
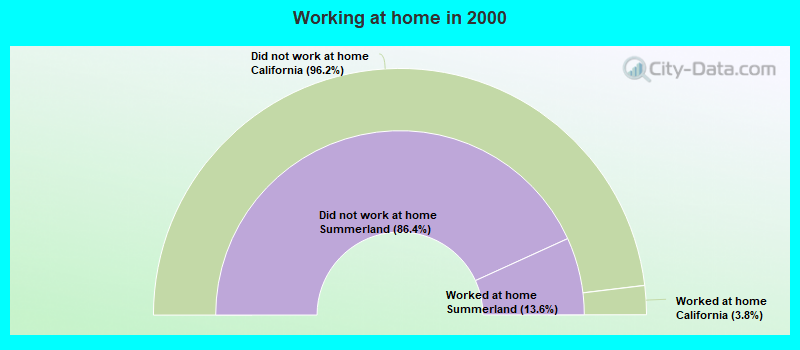
The most common industries in Summerland are: Educational services (16.0% of civilian employees), Professional, scientific, technical services (13.1% of civilian employees), Construction (6.6% of civilian employees). 92.0% of workers work in Santa Barbara County and 50.1% of all workers work at home. 53.6% of workers are employees of private companies, which is 24.1% less than the rate of 66.5% across the entire state of California.
Whole page based on the data from 2000 / 2022 when the population of Summerland, California was 1,545 / 1,270
Whole page based on the data from 2000 / 2022 when the population of Summerland, California was 1,545 / 1,270
Most common industries
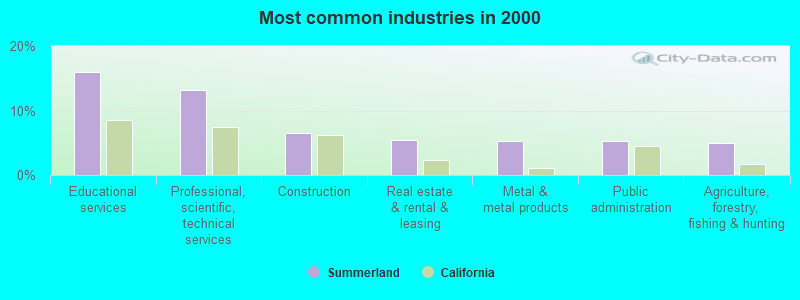
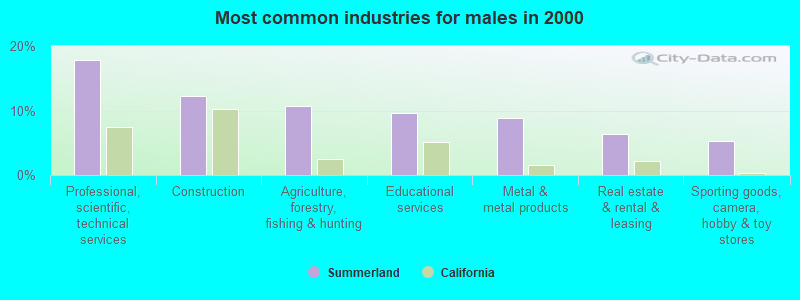
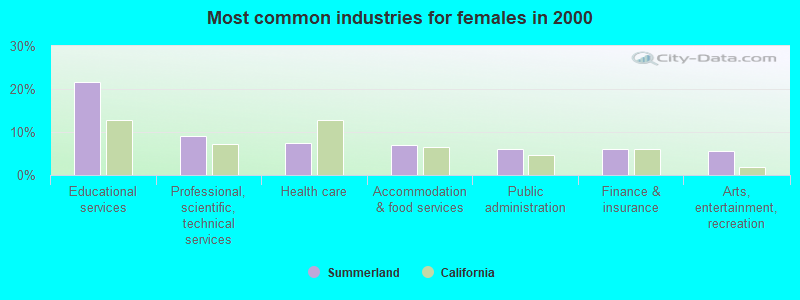
Most common industries | |||
|---|---|---|---|
Industry | All | Males | Females |
| Educational services | 16.0% (156) | 9.7% (44) | 21.6% (112) |
| Professional, scientific, and technical services | 13.1% (128) | 17.8% (81) | 9.1% (47) |
| Construction | 6.6% (64) | 12.3% (56) | 1.5% (8) |
| Real estate and rental and leasing | 5.4% (53) | 6.4% (29) | 4.6% (24) |
| Metal and metal products | 5.2% (51) | 8.8% (40) | 2.1% (11) |
| Public administration | 5.2% (51) | 4.4% (20) | 6.0% (31) |
| Agriculture, forestry, fishing and hunting | 5.0% (49) | 10.8% (49) | 0.0% (0) |
| Finance and insurance | 4.6% (45) | 3.1% (14) | 6.0% (31) |
| Accommodation and food services | 4.3% (42) | 1.3% (6) | 6.9% (36) |
| Health care | 4.0% (39) | 0.0% (0) | 7.5% (39) |
| Arts, entertainment, and recreation | 3.6% (35) | 1.3% (6) | 5.6% (29) |
| Miscellaneous manufacturing | 2.6% (25) | 0.0% (0) | 4.8% (25) |
| Sporting goods, camera, and hobby and toy stores | 2.5% (24) | 5.3% (24) | 0.0% (0) |
| Building material and garden equipment and supplies dealers | 2.4% (23) | 5.1% (23) | 0.0% (0) |
| Food and beverage stores | 2.3% (22) | 4.8% (22) | 0.0% (0) |
| Publishing, and motion picture and sound recording industries | 2.0% (19) | 0.0% (0) | 3.7% (19) |
| Personal and laundry services | 2.0% (19) | 0.0% (0) | 3.7% (19) |
| Machinery | 1.8% (18) | 4.0% (18) | 0.0% (0) |
| Administrative and support and waste management services | 1.7% (17) | 0.0% (0) | 3.3% (17) |
| Religious, grantmaking, civic, professional, and similar organizations | 1.2% (12) | 0.0% (0) | 2.3% (12) |
| Social assistance | 1.1% (11) | 0.0% (0) | 2.1% (11) |
| Nonmetallic mineral products | 1.0% (10) | 0.0% (0) | 1.9% (10) |
| Data processing, libraries, and other information services | 1.0% (10) | 0.0% (0) | 1.9% (10) |
| Private households | 1.0% (10) | 0.0% (0) | 1.9% (10) |
| Chemicals | 0.9% (9) | 0.0% (0) | 1.7% (9) |
| Used merchandise, gift, novelty, and souvenir, and other miscellaneous stores | 0.9% (9) | 2.0% (9) | 0.0% (0) |
| Air transportation | 0.9% (9) | 0.0% (0) | 1.7% (9) |
| Lumber and other construction materials merchant wholesalers | 0.7% (7) | 1.5% (7) | 0.0% (0) |
| Broadcasting and telecommunications | 0.7% (7) | 1.5% (7) | 0.0% (0) |
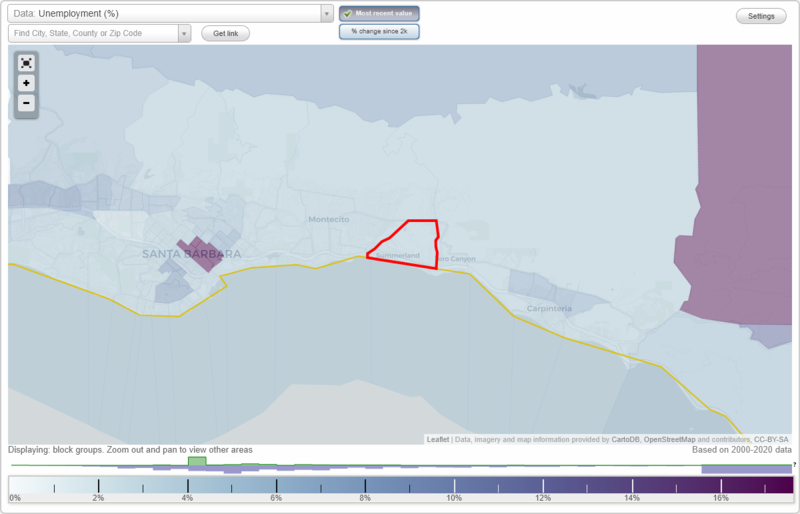
Unemployment in Summerland
- Unemployment by race in 2022
- Unemployment rate for White non-Hispanic residents
- 11.7%Males
- Unemployment by race in 2000
- Unemployment rate for White non-Hispanic residents
- 5.0%Males
- 1.5%Females
- Unemployment rate for Hispanic or Latino residents
- 12.7%Females
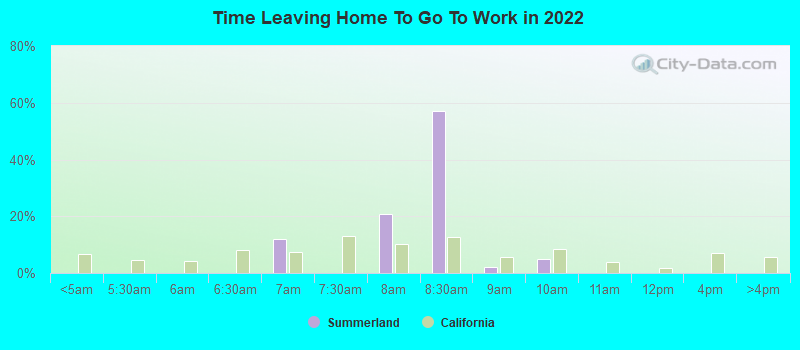
Time leaving home to go to work
6:30 a.m. to 6:59 a.m.:
| Summerland: | 12.0% (27) |
| California: | 7.5% (1,156,338) |
7:30 a.m. to 7:59 a.m.:
| Summerland: | 20.7% (47) |
| California: | 10.1% (1,550,402) |
8:00 a.m. to 8:29 a.m.:
| Summerland: | 57.2% (129) |
| California: | 12.7% (1,953,986) |
8:30 a.m. to 8:59 a.m.:
| Summerland: | 2.1% (5) |
| California: | 5.8% (890,950) |
9:00 a.m. to 9:59 a.m.:
| Summerland: | 4.8% (11) |
| California: | 8.4% (1,288,499) |
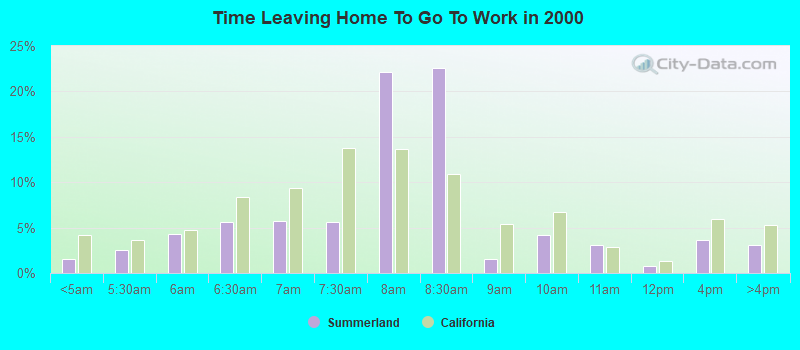
<5am:
| Summerland: | 1.5% (14) |
| California: | 4.2% (606,086) |
5:30am:
| Summerland: | 2.6% (24) |
| California: | 3.6% (523,209) |
6am:
| Summerland: | 4.3% (40) |
| California: | 4.8% (692,256) |
6:30am:
| Summerland: | 5.7% (53) |
| California: | 8.4% (1,216,867) |
7am:
| Summerland: | 5.8% (54) |
| California: | 9.4% (1,362,830) |
7:30am:
| Summerland: | 5.6% (52) |
| California: | 13.8% (2,006,950) |
8am:
| Summerland: | 22.2% (207) |
| California: | 13.7% (1,986,831) |
8:30am:
| Summerland: | 22.6% (211) |
| California: | 10.9% (1,577,815) |
9am:
| Summerland: | 1.5% (14) |
| California: | 5.4% (778,152) |
10am:
| Summerland: | 4.2% (39) |
| California: | 6.7% (972,355) |
11am:
| Summerland: | 3.1% (29) |
| California: | 2.9% (414,479) |
12pm:
| Summerland: | 0.7% (7) |
| California: | 1.3% (189,005) |
4pm:
| Summerland: | 3.6% (34) |
| California: | 6.0% (865,284) |
>4pm:
| Summerland: | 3.1% (29) |
| California: | 5.3% (776,167) |
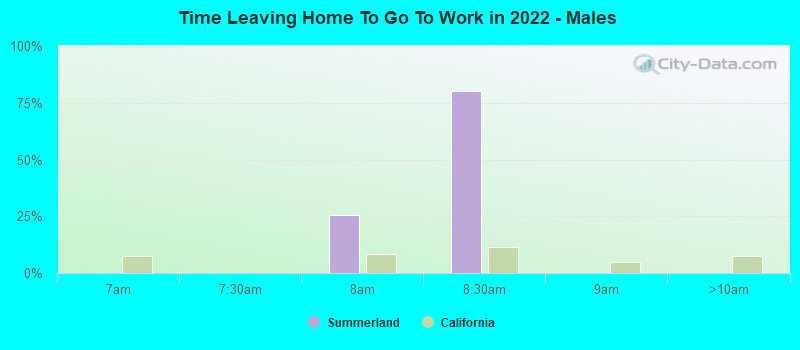
7:30 a.m. to 7:59 a.m. - Males:
| Summerland: | 25.7% (45) |
| California: | 8.2% (702,727) |
8:00 a.m. to 8:29 a.m. - Males:
| Summerland: | 80.3% (140) |
| California: | 11.5% (984,538) |
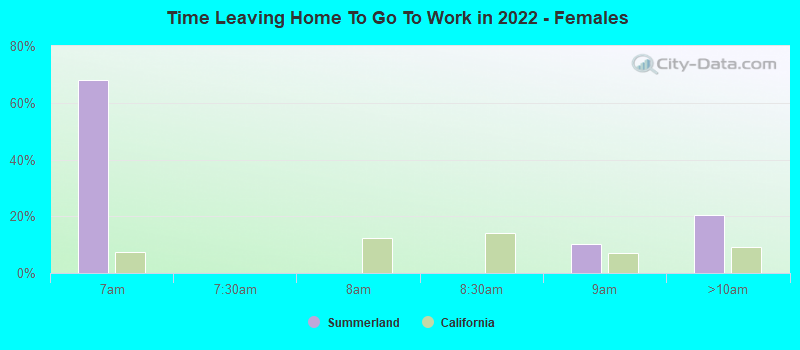
6:30 a.m. to 6:59 a.m. - Females:
| Summerland: | 68.0% (32) |
| California: | 7.3% (498,781) |
8:30 a.m. to 8:59 a.m. - Females:
| Summerland: | 10.1% (5) |
| California: | 6.9% (476,135) |
9:00 a.m. to 9:59 a.m. - Females:
| Summerland: | 20.6% (10) |
| California: | 9.2% (633,461) |
Travel time to work
Percentage of workers working in this county: 92.0%
Number of people working at home: 232 (50.1% of all workers)
Number of people working at home: 232 (50.1% of all workers)
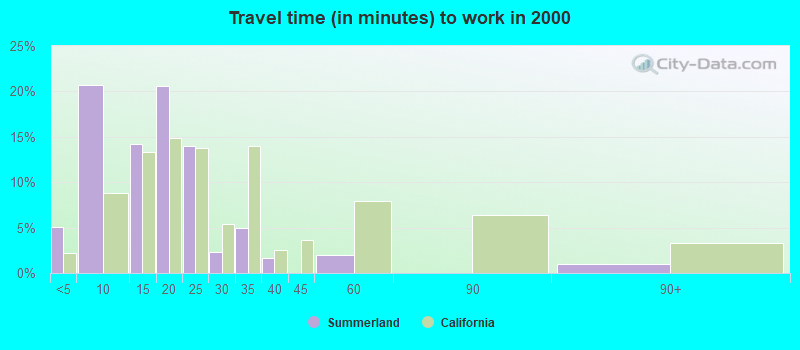
Less than 5 minutes:
| Summerland: | 5.0% (47) |
| California: | 2.2% (324,703) |
5 to 9 minutes:
| Summerland: | 20.7% (193) |
| California: | 8.8% (1,280,443) |
10 to 14 minutes:
| Summerland: | 14.2% (133) |
| California: | 13.3% (1,930,263) |
15 to 19 minutes:
| Summerland: | 20.6% (192) |
| California: | 14.9% (2,157,970) |
20 to 24 minutes:
| Summerland: | 14.0% (131) |
| California: | 13.8% (2,004,060) |
25 to 29 minutes:
| Summerland: | 2.4% (22) |
| California: | 5.4% (782,241) |
30 to 34 minutes:
| Summerland: | 4.9% (46) |
| California: | 13.9% (2,025,657) |
35 to 39 minutes:
| Summerland: | 1.6% (15) |
| California: | 2.5% (366,487) |
45 to 59 minutes:
| Summerland: | 2.0% (19) |
| California: | 7.9% (1,151,598) |
90 or more minutes:
| Summerland: | 1.0% (9) |
| California: | 3.3% (483,698) |
Means of transportation to work
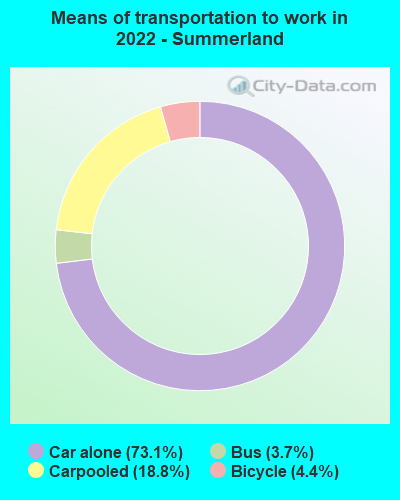

Drove car alone:
| Summerland: | 73.1% (521) |
| California: | 79.1% (5,345,368) |
Carpooled:
| Summerland: | 18.8% (134) |
| California: | 11.9% (878,699) |
Bus:
| Summerland: | 3.7% (26) |
| California: | 2.2% (170,574) |
Bicycle:
| Summerland: | 4.4% (31) |
| California: | 0.9% (39,197) |
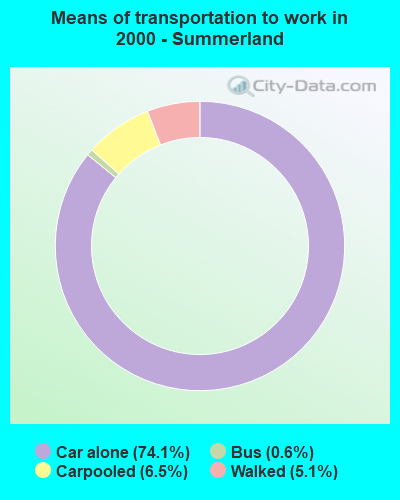

Drove car alone:
| Summerland: | 74.1% (692) |
| California: | 71.8% (10,432,462) |
Carpooled:
| Summerland: | 6.5% (61) |
| California: | 14.5% (2,113,313) |
Bus or trolley bus:
| Summerland: | 0.6% (6) |
| California: | 3.8% (549,425) |
Walked:
| Summerland: | 5.1% (48) |
| California: | 2.9% (414,581) |
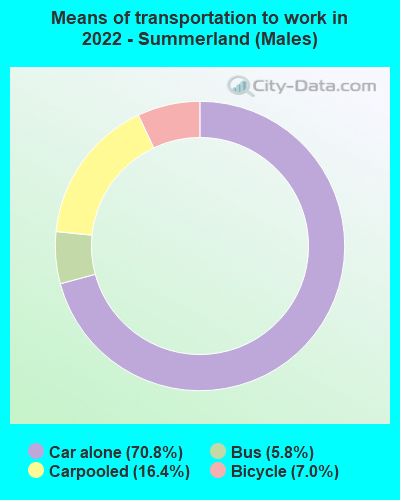

Drove car alone - Males:
| Summerland: | 70.8% (318) |
| California: | 80.0% (5,345,368) |
Carpooled - Males:
| Summerland: | 16.4% (74) |
| California: | 11.1% (878,699) |
Bus - Males:
| Summerland: | 5.8% (26) |
| California: | 2.0% (170,574) |
Bicycle - Males:
| Summerland: | 7.0% (31) |
| California: | 1.1% (39,197) |
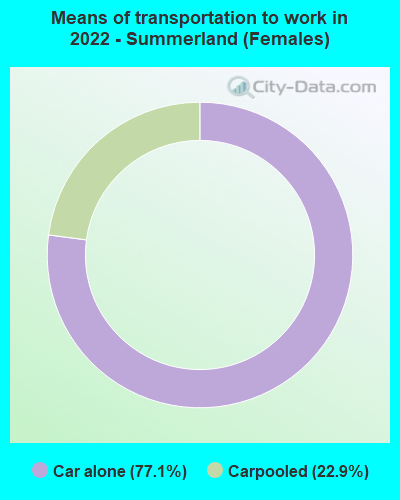

Drove car alone - Females:
| Summerland: | 77.1% (203) |
| California: | 77.9% (5,345,368) |
Carpooled - Females:
| Summerland: | 22.9% (60) |
| California: | 12.8% (878,699) |
Private vehicle occupancy
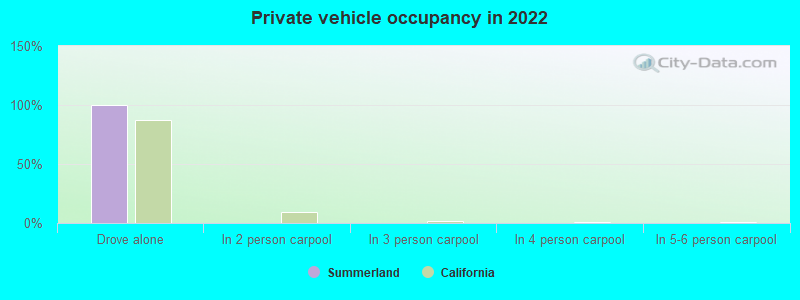
Drove alone:
| Summerland: | 100.0% (220) |
| California: | 86.9% (12,187,486) |
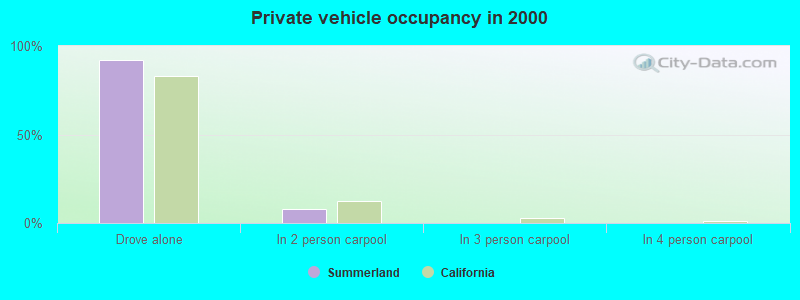
Drove alone:
| Summerland: | 91.9% (692) |
| California: | 83.2% (10,432,462) |
In 2 person carpool:
| Summerland: | 8.1% (61) |
| California: | 12.5% (1,564,905) |
Class of workers
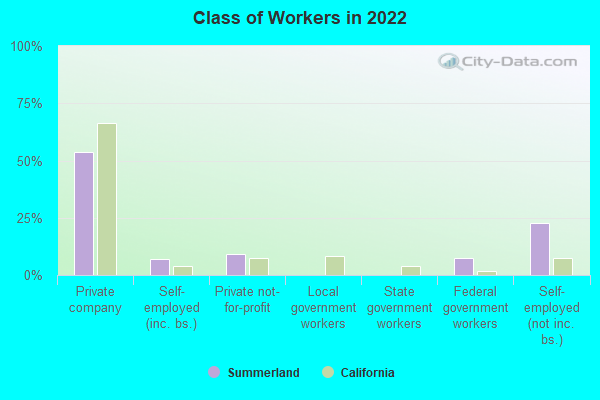
Employee of private company:
| Summerland: | 53.6% (265) |
| California: | 66.5% (12,596,030) |
Self-employed in own incorporated business:
| Summerland: | 7.1% (35) |
| California: | 4.1% (784,709) |
Private not-for-profit wage and salary workers:
| Summerland: | 9.2% (45) |
| California: | 7.5% (1,417,407) |
Federal government workers:
| Summerland: | 7.5% (37) |
| California: | 2.0% (369,858) |
Self-employed workers in own not incorporated business:
| Summerland: | 22.6% (112) |
| California: | 7.4% (1,410,735) |
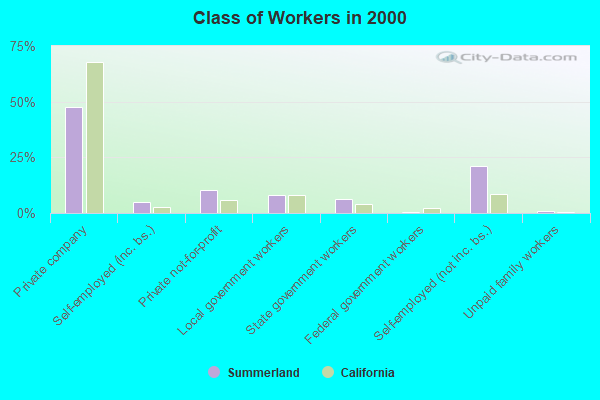
Employee of private company:
| Summerland: | 47.7% (465) |
| California: | 68.0% (10,009,465) |
Self-employed in own incorporated business:
| Summerland: | 5.0% (49) |
| California: | 2.7% (402,392) |
Private not-for-profit wage and salary workers:
| Summerland: | 10.2% (99) |
| California: | 5.7% (845,536) |
Local government workers:
| Summerland: | 8.2% (80) |
| California: | 8.3% (1,218,764) |
State government workers:
| Summerland: | 6.5% (63) |
| California: | 4.0% (594,953) |
Federal government workers:
| Summerland: | 0.6% (6) |
| California: | 2.3% (344,354) |
Self-employed workers in own not incorporated business:
| Summerland: | 21.0% (205) |
| California: | 8.5% (1,249,530) |
Unpaid family workers:
| Summerland: | 0.7% (7) |
| California: | 0.4% (53,934) |
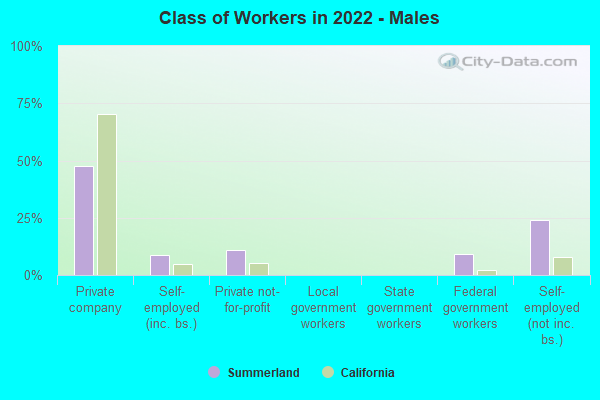
Employee of private company - Males:
| Summerland: | 47.4% (196) |
| California: | 70.3% (7,191,252) |
Self-employed in own incorporated business - Males:
| Summerland: | 8.5% (35) |
| California: | 4.9% (504,764) |
Private not-for-profit wage and salary workers - Males:
| Summerland: | 10.9% (45) |
| California: | 5.2% (529,122) |
Federal government workers - Males:
| Summerland: | 9.0% (37) |
| California: | 2.1% (209,874) |
Self-employed workers in own not incorporated business - Males:
| Summerland: | 24.1% (100) |
| California: | 8.1% (824,359) |
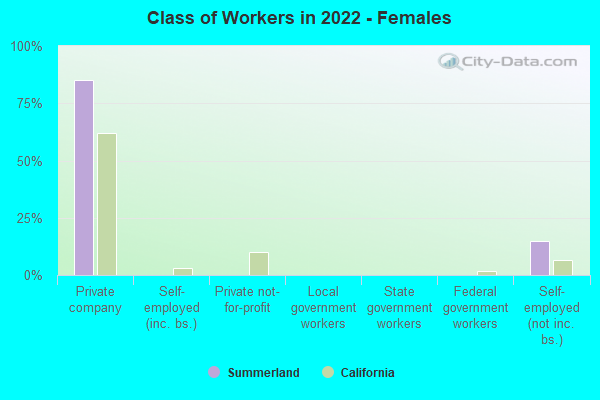
Employee of private company - Females:
| Summerland: | 85.0% (68) |
| California: | 62.0% (5,404,778) |
Self-employed workers in own not incorporated business - Females:
| Summerland: | 15.0% (12) |
| California: | 6.7% (586,376) |