Latest news about work in Taft, CA collected exclusively by city-data.com from local newspapers, TV, and radio stations
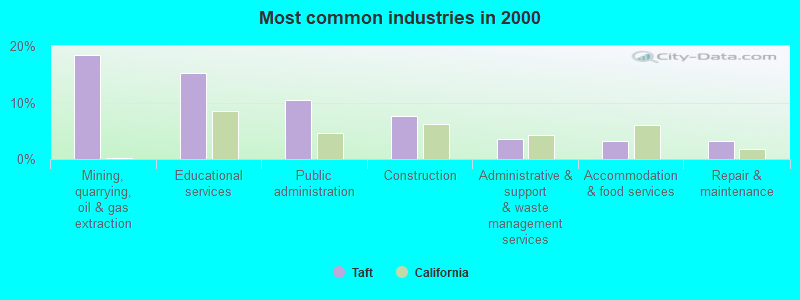
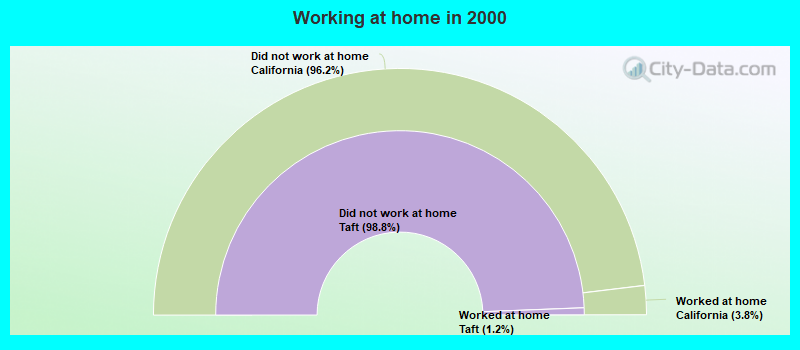
The most common industries in Taft are: Mining, quarrying, oil & gas extraction (18.4% of civilian employees), Educational services (15.3% of civilian employees), Public administration (10.4% of civilian employees). 95.2% of workers work in Kern County and 5.3% of all workers work at home. 61.7% of workers are employees of private companies, which is 7.8% less than the rate of 66.5% across the entire state of California.
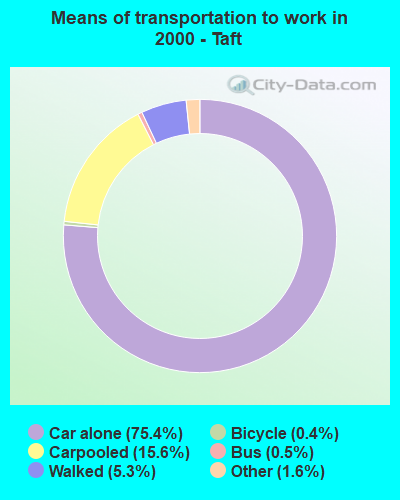
Whole page based on the data from 2000 / 2022 when the population of Taft, California was 6,400 / 7,489
Most common industries
Most common industries
Industry
All
Males
Females
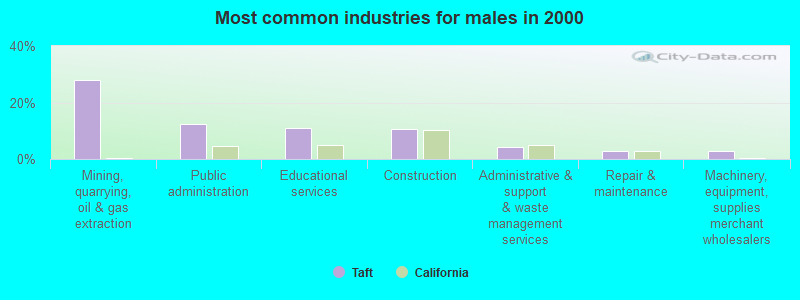
Mining, quarrying, and oil and gas extraction
18.4% (417)
28.1% (389)
3.2% (28)
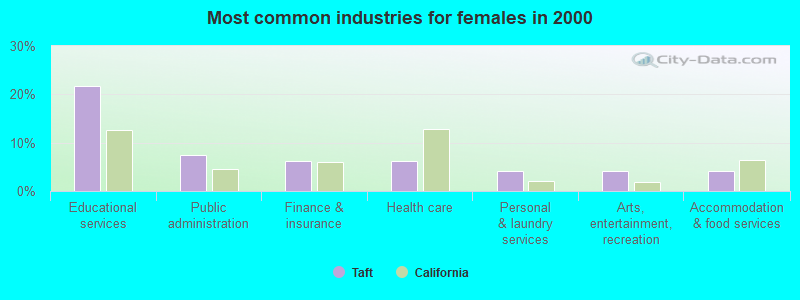
Educational services
15.3% (347)
11.1% (154)
21.8% (193)
Public administration
10.4% (237)
12.3% (171)
7.4% (66)
Construction
7.5% (171)
10.5% (146)
2.8% (25)
Administrative and support and waste management services
3.5% (79)
4.2% (58)
2.4% (21)
Accommodation and food services
3.3% (74)
2.7% (38)
4.1% (36)
Repair and maintenance
3.2% (73)
3.0% (41)
3.6% (32)
Health care
3.0% (69)
1.0% (14)
6.2% (55)
Finance and insurance
3.0% (69)
0.9% (13)
6.3% (56)
Agriculture, forestry, fishing and hunting
2.6% (58)
2.7% (38)
2.3% (20)
Machinery, equipment, and supplies merchant wholesalers
2.2% (50)
2.8% (39)
1.2% (11)
Arts, entertainment, and recreation
2.1% (47)
0.7% (10)
4.2% (37)
Utilities
2.0% (46)
2.8% (39)
0.8% (7)
Real estate and rental and leasing
2.0% (46)
2.5% (35)
1.2% (11)
Food and beverage stores
2.0% (45)
0.7% (10)
3.9% (35)
Department and other general merchandise stores
1.8% (41)
0.6% (8)
3.7% (33)
Personal and laundry services
1.6% (37)
0.0% (0)
4.2% (37)
Professional, scientific, and technical services
1.5% (33)
0.8% (11)
2.5% (22)
U. S. Postal service
1.1% (25)
0.0% (0)
2.8% (25)
Truck transportation
1.0% (22)
1.6% (22)
0.0% (0)
Chemicals
1.0% (22)
1.6% (22)
0.0% (0)
Miscellaneous durable goods merchant wholesalers
0.9% (21)
0.6% (8)
1.5% (13)
Miscellaneous manufacturing
0.9% (20)
1.4% (20)
0.0% (0)
Religious, grantmaking, civic, professional, and similar organizations
0.9% (20)
1.1% (15)
0.6% (5)
Motor vehicle and parts dealers
0.9% (20)
0.3% (4)
1.8% (16)
Drugs, sundries, and chemical and allied products merchant wholesalers
0.9% (20)
0.4% (6)
1.6% (14)
Social assistance
0.8% (18)
0.0% (0)
2.0% (18)
Clothing and accessories, including shoe, stores
0.6% (14)
0.0% (0)
1.6% (14)
Broadcasting and telecommunications
0.6% (14)
1.0% (14)
0.0% (0)
Metal and metal products
0.5% (12)
0.8% (11)
0.1% (1)
Building material and garden equipment and supplies dealers
0.5% (11)
0.8% (11)
0.0% (0)
Nonmetallic mineral products
0.5% (11)
0.8% (11)
0.0% (0)
Computer and electronic products
0.5% (11)
0.0% (0)
1.2% (11)
Other direct selling establishments
0.5% (11)
0.0% (0)
1.2% (11)
Private households
0.5% (11)
0.0% (0)
1.2% (11)
Gasoline stations
0.4% (10)
0.7% (10)
0.0% (0)
Other transportation, and support activities, and couriers
0.4% (9)
0.0% (0)
1.0% (9)
Motor vehicles, parts and supplies merchant wholesalers
0.4% (9)
0.6% (9)
0.0% (0)
Machinery
0.4% (8)
0.6% (8)
0.0% (0)
Farm supplies merchant wholesalers
0.3% (6)
0.0% (0)
0.7% (6)
Warehousing and storage
0.2% (5)
0.0% (0)
0.6% (5)
Furniture and home furnishings, and household appliance stores
0.1% (3)
0.0% (0)
0.3% (3)
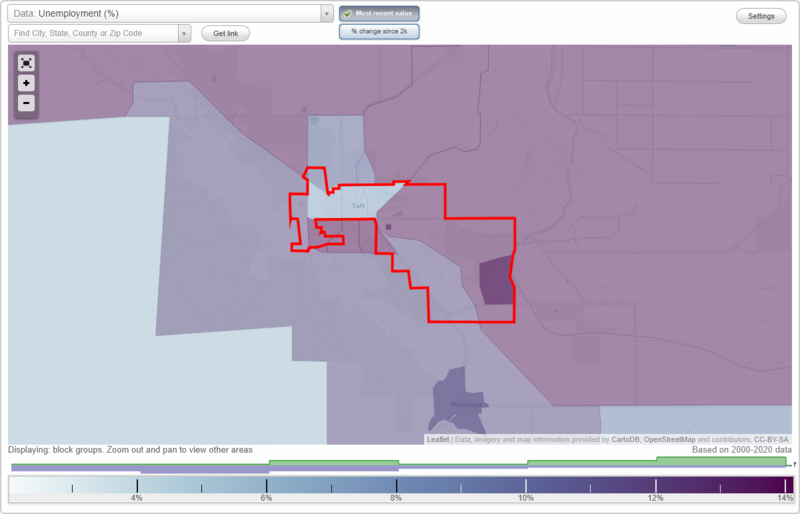
Unemployment in Taft
Unemployment by race in 2022
Unemployment rate for White non-Hispanic residents
9.5%Females
Unemployment rate for Black residents
100.0%Males
Unemployment rate for other race residents
6.9%Males
Unemployment rate for two or more race residents
24.4%Females
Unemployment rate for Hispanic or Latino residents
2.3%Males
4.4%Females
Unemployment by race in 2000
Unemployment rate for White non-Hispanic residents
6.1%Males
9.5%Females
Unemployment rate for Asian residents
14.9%Females
Unemployment rate for other race residents
46.4%Males
46.0%Females
Unemployment rate for two or more race residents
60.0%Males
48.6%Females
Unemployment rate for Hispanic or Latino residents
38.1%Males
27.8%Females
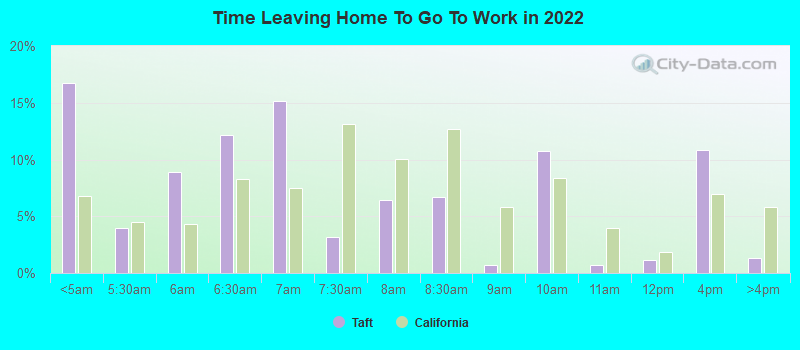
Time leaving home to go to work
12:00 a.m. to 4:59 a.m.:
Taft:
16.8% (426)
California:
6.8% (1,050,902)
5:00 a.m. to 5:29 a.m.:
Taft:
4.0% (101)
California:
4.5% (692,772)
5:30 a.m. to 5:59 a.m.:
Taft:
8.9% (226)
California:
4.3% (665,475)
6:00 a.m. to 6:29 a.m.:
Taft:
12.1% (309)
California:
8.3% (1,273,588)
6:30 a.m. to 6:59 a.m.:
Taft:
15.1% (385)
California:
7.5% (1,156,338)
7:00 a.m. to 7:29 a.m.:
Taft:
3.1% (80)
California:
13.2% (2,027,702)
7:30 a.m. to 7:59 a.m.:
Taft:
6.4% (163)
California:
10.1% (1,550,402)
8:00 a.m. to 8:29 a.m.:
Taft:
6.7% (171)
California:
12.7% (1,953,986)
8:30 a.m. to 8:59 a.m.:
Taft:
0.7% (19)
California:
5.8% (890,950)
9:00 a.m. to 9:59 a.m.:
Taft:
10.8% (274)
California:
8.4% (1,288,499)
10:00 a.m. to 10:59 a.m.:
Taft:
0.7% (18)
California:
4.0% (613,193)
11:00 a.m. to 11:59 a.m.:
Taft:
1.1% (28)
California:
1.8% (280,975)
12:00 p.m. to 3:59 p.m.:
Taft:
10.9% (276)
California:
7.0% (1,075,505)
4:00 p.m. to 11:59 p.m.:
Taft:
1.3% (34)
California:
5.8% (891,240)
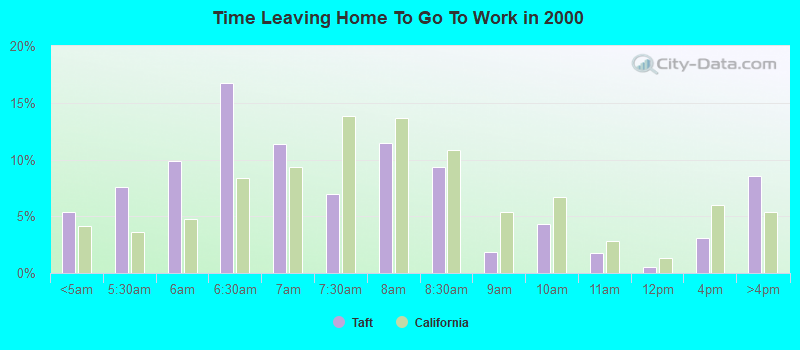
<5am:
Taft:
5.4% (122)
California:
4.2% (606,086)
5:30am:
Taft:
7.5% (170)
California:
3.6% (523,209)
6am:
Taft:
9.8% (222)
California:
4.8% (692,256)
6:30am:
Taft:
16.8% (378)
California:
8.4% (1,216,867)
7am:
Taft:
11.4% (257)
California:
9.4% (1,362,830)
7:30am:
Taft:
7.0% (157)
California:
13.8% (2,006,950)
8am:
Taft:
11.4% (258)
California:
13.7% (1,986,831)
8:30am:
Taft:
9.4% (211)
California:
10.9% (1,577,815)
9am:
Taft:
1.8% (41)
California:
5.4% (778,152)
10am:
Taft:
4.3% (98)
California:
6.7% (972,355)
11am:
Taft:
1.8% (40)
California:
2.9% (414,479)
12pm:
Taft:
0.5% (11)
California:
1.3% (189,005)
4pm:
Taft:
3.1% (70)
California:
6.0% (865,284)
>4pm:
Taft:
8.6% (193)
California:
5.3% (776,167)
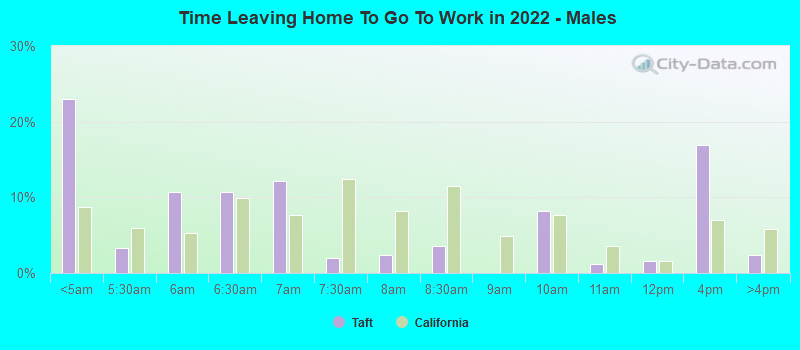
12:00 a.m. to 4:59 a.m. - Males:
Taft:
23.0% (359)
California:
8.7% (747,612)
5:00 a.m. to 5:29 a.m. - Males:
Taft:
3.2% (51)
California:
6.0% (509,420)
5:30 a.m. to 5:59 a.m. - Males:
Taft:
10.7% (167)
California:
5.2% (448,269)
6:00 a.m. to 6:29 a.m. - Males:
Taft:
10.7% (167)
California:
9.8% (842,941)
6:30 a.m. to 6:59 a.m. - Males:
Taft:
12.2% (190)
California:
7.7% (657,557)
7:00 a.m. to 7:29 a.m. - Males:
Taft:
2.0% (32)
California:
12.4% (1,058,532)
7:30 a.m. to 7:59 a.m. - Males:
Taft:
2.3% (36)
California:
8.2% (702,727)
8:00 a.m. to 8:29 a.m. - Males:
Taft:
3.5% (55)
California:
11.5% (984,538)
9:00 a.m. to 9:59 a.m. - Males:
Taft:
8.1% (127)
California:
7.7% (655,038)
10:00 a.m. to 10:59 a.m. - Males:
Taft:
1.2% (19)
California:
3.5% (301,425)
11:00 a.m. to 11:59 a.m. - Males:
Taft:
1.5% (24)
California:
1.7% (141,620)
12:00 p.m. to 3:59 p.m. - Males:
Taft:
16.9% (263)
California:
7.0% (594,847)
4:00 p.m. to 11:59 p.m. - Males:
Taft:
2.4% (37)
California:
5.8% (499,471)
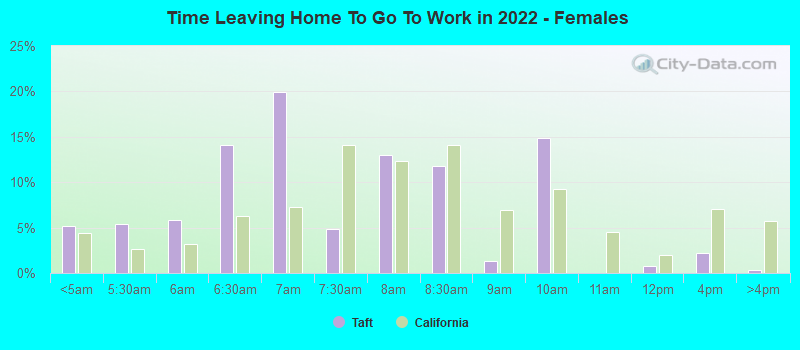
12:00 a.m. to 4:59 a.m. - Females:
Taft:
5.2% (51)
California:
4.4% (303,290)
5:00 a.m. to 5:29 a.m. - Females:
Taft:
5.4% (54)
California:
2.7% (183,352)
5:30 a.m. to 5:59 a.m. - Females:
Taft:
5.9% (58)
California:
3.2% (217,206)
6:00 a.m. to 6:29 a.m. - Females:
Taft:
14.1% (139)
California:
6.3% (430,647)
6:30 a.m. to 6:59 a.m. - Females:
Taft:
19.9% (197)
California:
7.3% (498,781)
7:00 a.m. to 7:29 a.m. - Females:
Taft:
4.8% (48)
California:
14.1% (969,170)
7:30 a.m. to 7:59 a.m. - Females:
Taft:
13.0% (129)
California:
12.4% (847,675)
8:00 a.m. to 8:29 a.m. - Females:
Taft:
11.8% (117)
California:
14.1% (969,448)
8:30 a.m. to 8:59 a.m. - Females:
Taft:
1.4% (13)
California:
6.9% (476,135)
9:00 a.m. to 9:59 a.m. - Females:
Taft:
14.8% (146)
California:
9.2% (633,461)
11:00 a.m. to 11:59 a.m. - Females:
Taft:
0.7% (7)
California:
2.0% (139,355)
12:00 p.m. to 3:59 p.m. - Females:
Taft:
2.2% (21)
California:
7.0% (480,658)
4:00 p.m. to 11:59 p.m. - Females:
Taft:
0.3% (3)
California:
5.7% (391,769)
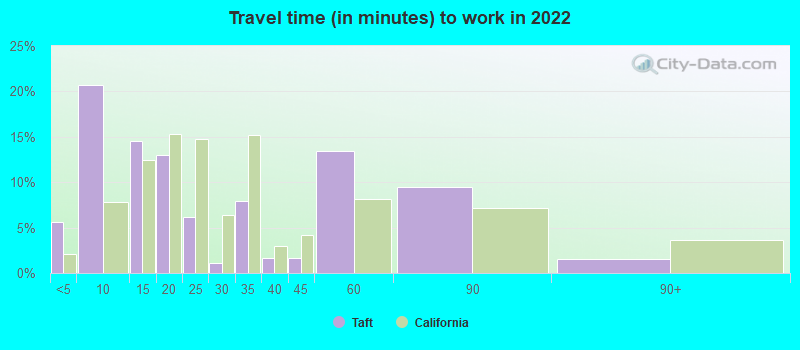
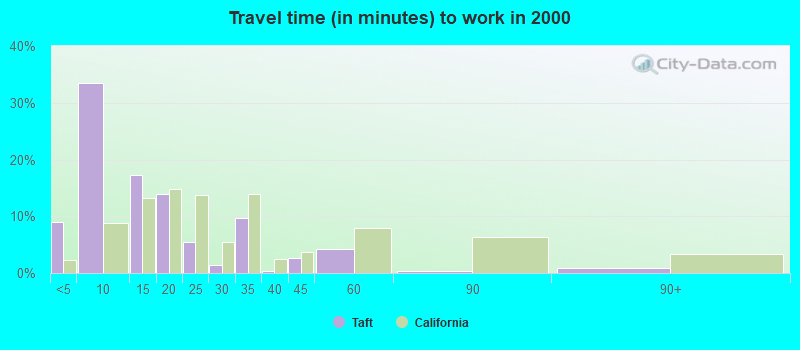
Travel time to work
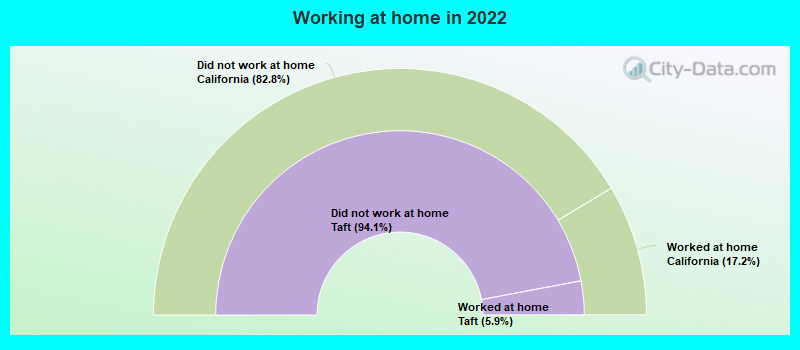
Percentage of workers working in this county: 95.2% Number of people working at home: 144 (5.3% of all workers) Daytime population change due to commuting: +1,569 (+24.5%) Workers who live and work in this city: 1,070 (47.4%)
Less than 5 minutes:
Taft:
5.6% (240)
California:
2.1% (323,064)
5 to 9 minutes:
Taft:
20.7% (891)
California:
7.8% (1,208,682)
10 to 14 minutes:
Taft:
14.6% (628)
California:
12.4% (1,917,610)
15 to 19 minutes:
Taft:
13.0% (559)
California:
15.3% (2,367,483)
20 to 24 minutes:
Taft:
6.1% (264)
California:
14.8% (2,279,693)
25 to 29 minutes:
Taft:
1.1% (48)
California:
6.4% (981,997)
30 to 34 minutes:
Taft:
7.9% (342)
California:
15.2% (2,339,223)
35 to 39 minutes:
Taft:
1.6% (69)
California:
2.9% (453,226)
40 to 44 minutes:
Taft:
1.6% (70)
California:
4.1% (637,781)
45 to 59 minutes:
Taft:
13.4% (579)
California:
8.2% (1,259,482)
60 to 89 minutes:
Taft:
9.4% (406)
California:
7.2% (1,111,698)
90 or more minutes:
Taft:
1.5% (66)
California:
3.6% (552,805)
Less than 5 minutes:
Taft:
9.0% (202)
California:
2.2% (324,703)
5 to 9 minutes:
Taft:
33.5% (756)
California:
8.8% (1,280,443)
10 to 14 minutes:
Taft:
17.2% (389)
California:
13.3% (1,930,263)
15 to 19 minutes:
Taft:
14.0% (315)
California:
14.9% (2,157,970)
20 to 24 minutes:
Taft:
5.5% (123)
California:
13.8% (2,004,060)
25 to 29 minutes:
Taft:
1.5% (33)
California:
5.4% (782,241)
30 to 34 minutes:
Taft:
9.8% (220)
California:
13.9% (2,025,657)
35 to 39 minutes:
Taft:
0.3% (7)
California:
2.5% (366,487)
40 to 44 minutes:
Taft:
2.6% (58)
California:
3.6% (528,043)
45 to 59 minutes:
Taft:
4.3% (96)
California:
7.9% (1,151,598)
60 to 89 minutes:
Taft:
0.4% (9)
California:
6.4% (933,123)
90 or more minutes:
Taft:
0.9% (20)
California:
3.3% (483,698)
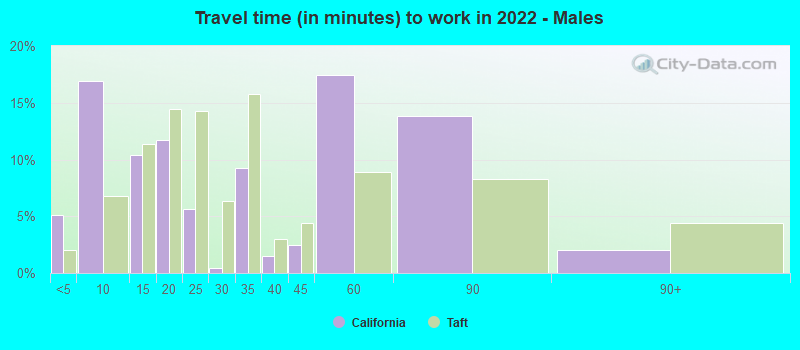
Less than 5 minutes - Males:
Taft:
5.1% (140)
California:
2.0% (173,603)
5 to 9 minutes - Males:
Taft:
16.9% (467)
California:
6.8% (580,822)
10 to 14 minutes - Males:
Taft:
10.4% (288)
California:
11.4% (974,497)
15 to 19 minutes - Males:
Taft:
11.7% (324)
California:
14.5% (1,239,386)
20 to 24 minutes - Males:
Taft:
5.6% (156)
California:
14.3% (1,223,429)
25 to 29 minutes - Males:
Taft:
0.5% (13)
California:
6.4% (545,844)
30 to 34 minutes - Males:
Taft:
9.3% (256)
California:
15.8% (1,352,210)
35 to 39 minutes - Males:
Taft:
1.5% (41)
California:
3.0% (253,732)
40 to 44 minutes - Males:
Taft:
2.5% (68)
California:
4.4% (376,144)
45 to 59 minutes - Males:
Taft:
17.4% (481)
California:
8.9% (762,659)
60 to 89 minutes - Males:
Taft:
13.8% (382)
California:
8.3% (711,394)
90 or more minutes - Males:
Taft:
2.0% (55)
California:
4.4% (378,954)
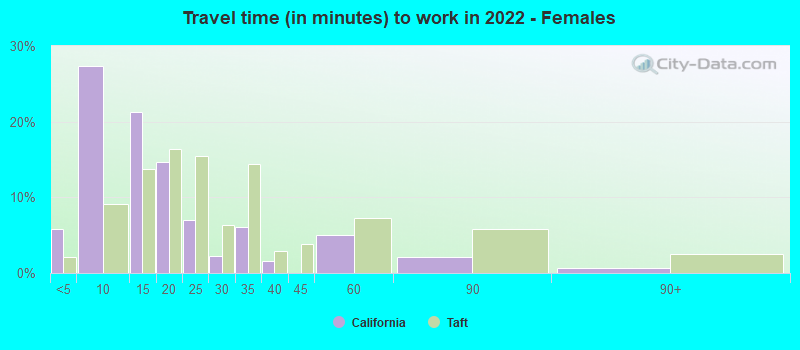
Less than 5 minutes - Females:
Taft:
5.8% (89)
California:
2.2% (149,461)
5 to 9 minutes - Females:
Taft:
27.4% (424)
California:
9.2% (627,860)
10 to 14 minutes - Females:
Taft:
21.3% (329)
California:
13.7% (943,113)
15 to 19 minutes - Females:
Taft:
14.7% (228)
California:
16.4% (1,128,097)
20 to 24 minutes - Females:
Taft:
6.9% (107)
California:
15.4% (1,056,264)
25 to 29 minutes - Females:
Taft:
2.2% (35)
California:
6.4% (436,153)
30 to 34 minutes - Females:
Taft:
6.0% (93)
California:
14.4% (987,013)
35 to 39 minutes - Females:
Taft:
1.6% (24)
California:
2.9% (199,494)
45 to 59 minutes - Females:
Taft:
5.0% (77)
California:
7.2% (496,823)
60 to 89 minutes - Females:
Taft:
2.2% (33)
California:
5.8% (400,304)
90 or more minutes - Females:
Taft:
0.7% (11)
California:
2.5% (173,851)
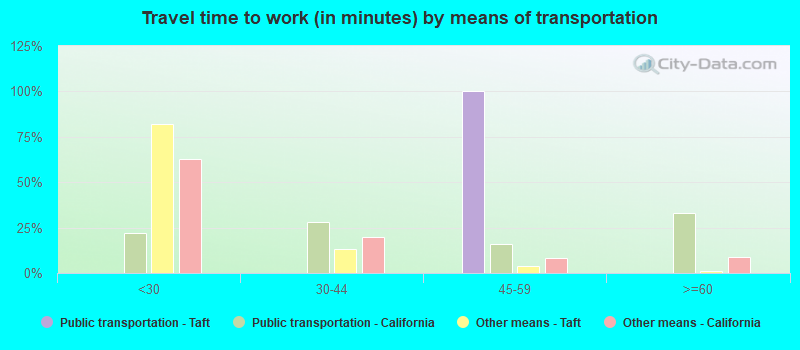
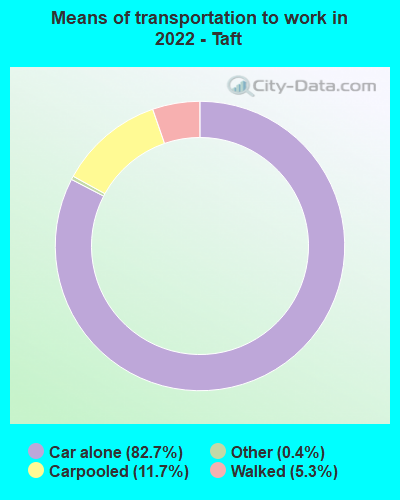
Means of transportation to work
Drove car alone:
Taft:
82.7% (3,592)
California:
79.1% (5,345,368)
Carpooled:
Taft:
11.7% (506)
California:
11.9% (878,699)
Walked:
Taft:
5.3% (228)
California:
2.9% (218,374)
Other means:
Taft:
0.4% (16)
California:
2.1% (137,489)
Drove car alone:
Taft:
75.4% (1,701)
California:
71.8% (10,432,462)
Carpooled:
Taft:
15.6% (351)
California:
14.5% (2,113,313)
Bus or trolley bus:
Taft:
0.5% (12)
California:
3.8% (549,425)
Bicycle:
Taft:
0.4% (8)
California:
0.8% (120,567)
Walked:
Taft:
5.3% (119)
California:
2.9% (414,581)
Other means:
Taft:
1.6% (37)
California:
0.8% (115,064)
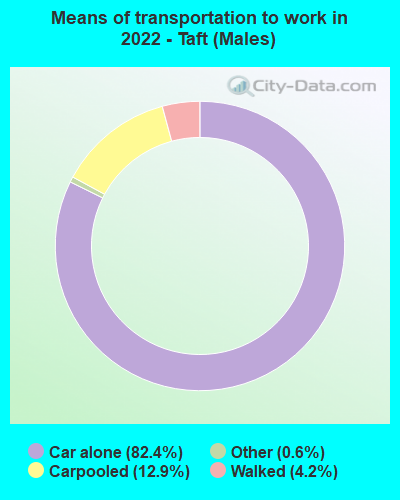
Drove car alone - Males:
Taft:
82.4% (2,290)
California:
80.0% (5,345,368)
Carpooled - Males:
Taft:
12.9% (358)
California:
11.1% (878,699)
Walked - Males:
Taft:
4.2% (116)
California:
2.7% (218,374)
Other means - Males:
Taft:
0.6% (17)
California:
2.1% (137,489)
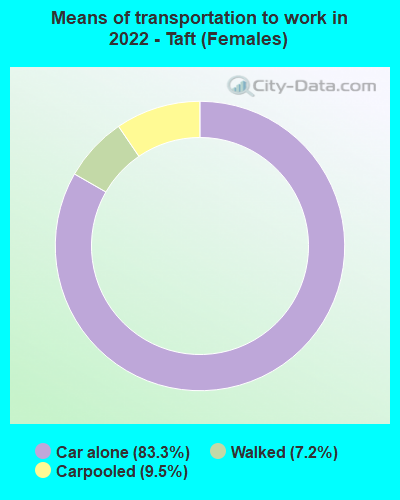
Drove car alone - Females:
Taft:
83.3% (1,304)
California:
77.9% (5,345,368)
Carpooled - Females:
Taft:
9.5% (149)
California:
12.8% (878,699)
Walked - Females:
Taft:
7.2% (113)
California:
3.2% (218,374)
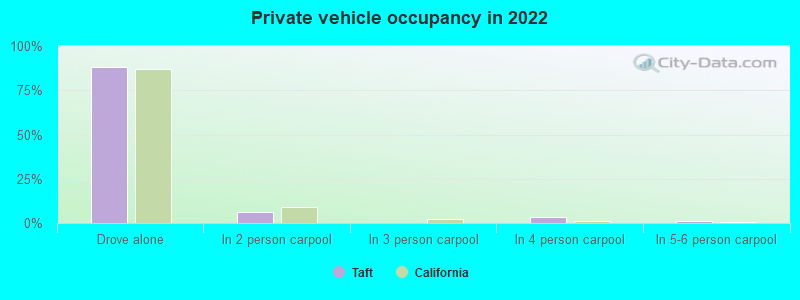
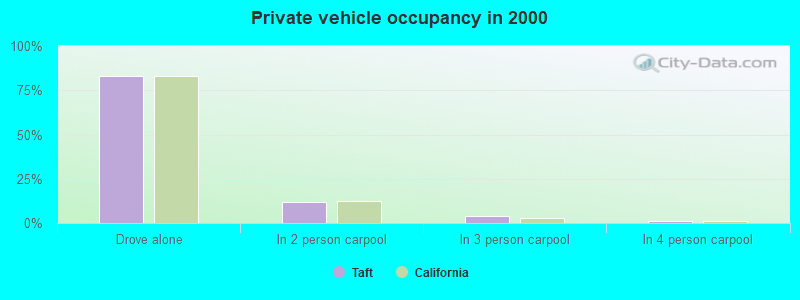
Private vehicle occupancy
Drove alone:
Taft:
88.0% (2,068)
California:
86.9% (12,187,486)
In 2 person carpool:
Taft:
6.5% (152)
California:
9.2% (1,295,561)
In 4 person carpool:
Taft:
3.3% (76)
California:
0.9% (126,987)
In 5-6 person carpool:
Taft:
0.9% (21)
California:
0.5% (70,825)
Drove alone:
Taft:
82.9% (1,701)
California:
83.2% (10,432,462)
In 2 person carpool:
Taft:
11.6% (239)
California:
12.5% (1,564,905)
In 3 person carpool:
Taft:
3.9% (81)
California:
2.6% (330,732)
In 4 person carpool:
Taft:
1.4% (28)
California:
1.0% (119,364)
In 5-6 person carpool:
Taft:
0.1% (3)
California:
0.5% (57,036)
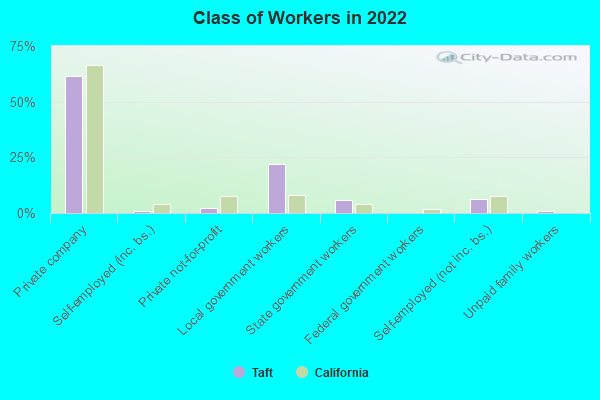
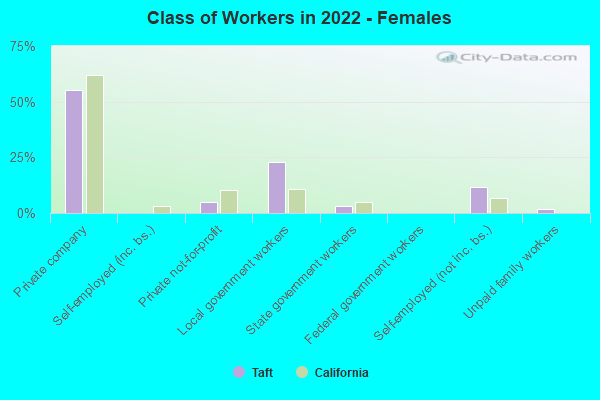
Class of workers
Employee of private company:
Taft:
61.7% (1,707)
California:
66.5% (12,596,030)
Self-employed in own incorporated business:
Taft:
1.0% (28)
California:
4.1% (784,709)
Private not-for-profit wage and salary workers:
Taft:
2.3% (63)
California:
7.5% (1,417,407)
Local government workers:
Taft:
22.1% (612)
California:
8.2% (1,547,056)
State government workers:
Taft:
5.7% (159)
California:
4.1% (780,915)
Self-employed workers in own not incorporated business:
Taft:
6.4% (178)
California:
7.4% (1,410,735)
Unpaid family workers:
Taft:
0.7% (20)
California:
0.2% (36,267)
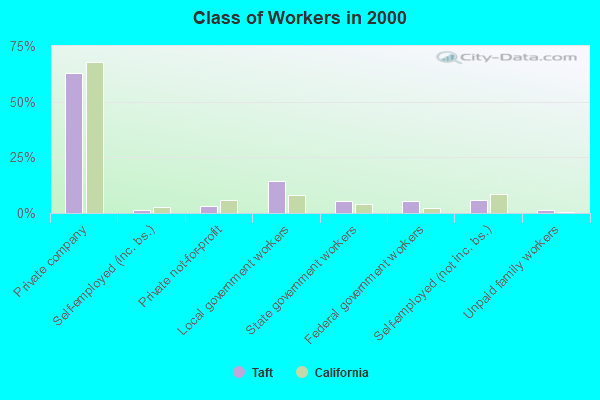
Employee of private company:
Taft:
62.9% (1,430)
California:
68.0% (10,009,465)
Self-employed in own incorporated business:
Taft:
1.5% (34)
California:
2.7% (402,392)
Private not-for-profit wage and salary workers:
Taft:
3.1% (71)
California:
5.7% (845,536)
Local government workers:
Taft:
14.4% (327)
California:
8.3% (1,218,764)
State government workers:
Taft:
5.6% (127)
California:
4.0% (594,953)
Federal government workers:
Taft:
5.5% (126)
California:
2.3% (344,354)
Self-employed workers in own not incorporated business:
Taft:
5.7% (130)
California:
8.5% (1,249,530)
Unpaid family workers:
Taft:
1.2% (27)
California:
0.4% (53,934)
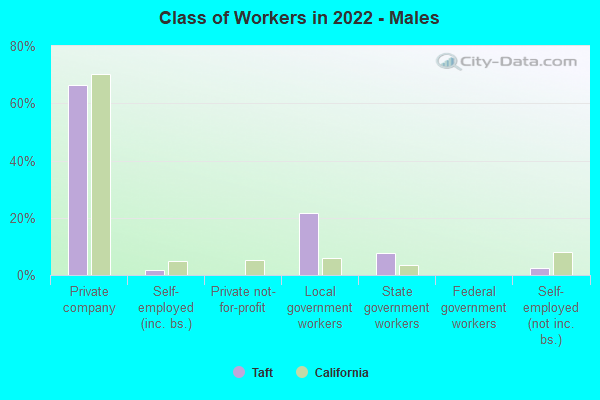
Employee of private company - Males:
Taft:
66.5% (1,045)
California:
70.3% (7,191,252)
Self-employed in own incorporated business - Males:
Taft:
1.8% (28)
California:
4.9% (504,764)
Private not-for-profit wage and salary workers - Males:
Taft:
0.1% (1)
California:
5.2% (529,122)
Local government workers - Males:
Taft:
21.6% (340)
California:
6.0% (610,331)
State government workers - Males:
Taft:
7.6% (119)
California:
3.4% (343,636)
Self-employed workers in own not incorporated business - Males:
Taft:
2.4% (38)
California:
8.1% (824,359)
Employee of private company - Females:
Taft:
55.3% (661)
California:
62.0% (5,404,778)
Private not-for-profit wage and salary workers - Females:
Taft:
5.1% (62)
California:
10.2% (888,285)
Local government workers - Females:
Taft:
22.8% (272)
California:
10.8% (936,725)
State government workers - Females:
Taft:
3.3% (40)
California:
5.0% (437,279)
Self-employed workers in own not incorporated business - Females:
Taft:
11.8% (141)
California:
6.7% (586,376)
Unpaid family workers - Females:
Taft:
1.7% (20)
California:
0.2% (18,345)
Discuss Taft, California (CA) on our hugely popular California forum.