Work and Jobs in Thorndale, Texas (TX) Detailed Stats
Occupations, Industries, Unemployment, Workers, Commute
Settings
X


Recent posts about work in Thorndale, Texas on our local forum with over 2,400,000 registered users:
 | Salado to Austin State Hospital Commute Rush Hour (10 replies) |
| Hutto, Pfluggerville & Taylor (69 replies) |
| austin is not diverse? (111 replies) |
| Small Towns In Texas? (29 replies) |
| Any One out there lives in or around Milam Texas (1 reply) |
Latest news about work in Thorndale, TX collected exclusively by city-data.com from local newspapers, TV, and radio stations
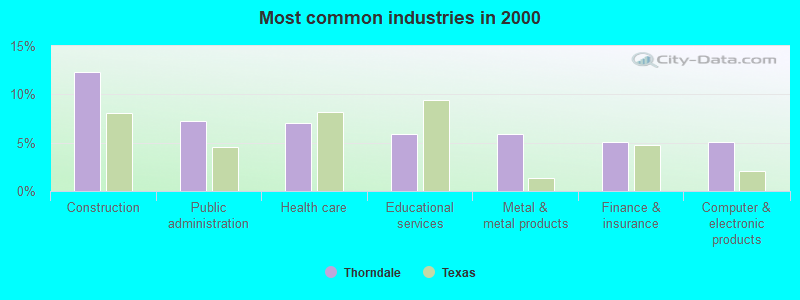
The most common industries in Thorndale are: Construction (12.3% of civilian employees), Public administration (7.2% of civilian employees), Health care (7.0% of civilian employees). 40.6% of workers work in Milam County and 2.3% of all workers work at home. 65.8% of workers are employees of private companies, which is 5.7% less than the rate of 69.6% across the entire state of Texas.
Whole page based on the data from 2000 / 2022 when the population of Thorndale, Texas was 1,278 / 1,453
Whole page based on the data from 2000 / 2022 when the population of Thorndale, Texas was 1,278 / 1,453
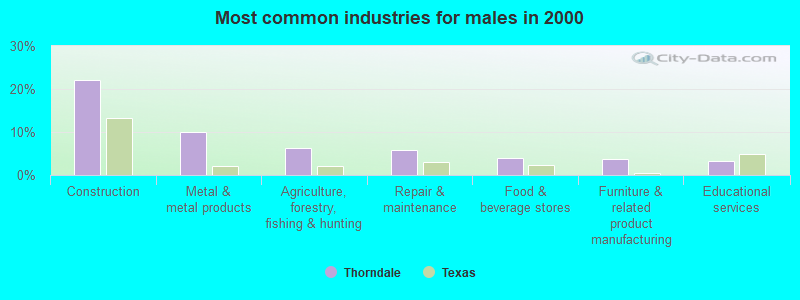
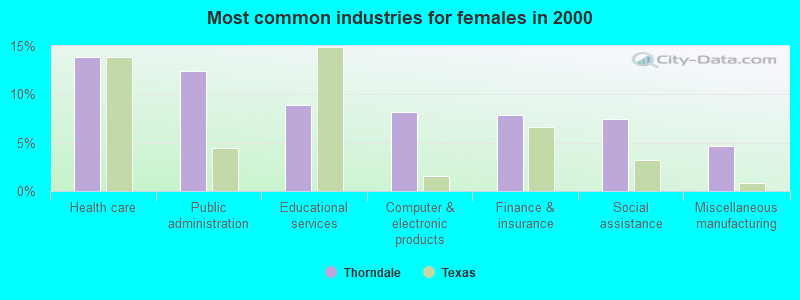
Most common industries
Most common industries | |||
|---|---|---|---|
Industry | All | Males | Females |
| Construction | 12.3% (75) | 22.2% (73) | 0.7% (2) |
| Public administration | 7.2% (44) | 2.7% (9) | 12.5% (35) |
| Health care | 7.0% (43) | 1.2% (4) | 13.9% (39) |
| Educational services | 5.9% (36) | 3.3% (11) | 8.9% (25) |
| Metal and metal products | 5.9% (36) | 10.0% (33) | 1.1% (3) |
| Finance and insurance | 5.1% (31) | 2.7% (9) | 7.8% (22) |
| Computer and electronic products | 5.1% (31) | 2.4% (8) | 8.2% (23) |
| Agriculture, forestry, fishing and hunting | 3.8% (23) | 6.4% (21) | 0.7% (2) |
| Miscellaneous manufacturing | 3.8% (23) | 3.0% (10) | 4.6% (13) |
| Repair and maintenance | 3.6% (22) | 5.8% (19) | 1.1% (3) |
| Social assistance | 3.4% (21) | 0.0% (0) | 7.5% (21) |
| Food and beverage stores | 2.6% (16) | 4.0% (13) | 1.1% (3) |
| Professional, scientific, and technical services | 2.5% (15) | 1.2% (4) | 3.9% (11) |
| Real estate and rental and leasing | 2.5% (15) | 3.0% (10) | 1.8% (5) |
| Accommodation and food services | 2.3% (14) | 1.2% (4) | 3.6% (10) |
| Administrative and support and waste management services | 2.1% (13) | 2.1% (7) | 2.1% (6) |
| Building material and garden equipment and supplies dealers | 2.0% (12) | 2.7% (9) | 1.1% (3) |
| Furniture and related product manufacturing | 2.0% (12) | 3.6% (12) | 0.0% (0) |
| Department and other general merchandise stores | 1.6% (10) | 0.9% (3) | 2.5% (7) |
| Truck transportation | 1.6% (10) | 1.5% (5) | 1.8% (5) |
| Motor vehicle and parts dealers | 1.6% (10) | 2.4% (8) | 0.7% (2) |
| Utilities | 1.5% (9) | 1.8% (6) | 1.1% (3) |
| Religious, grantmaking, civic, professional, and similar organizations | 1.3% (8) | 1.5% (5) | 1.1% (3) |
| Private households | 1.0% (6) | 0.0% (0) | 2.1% (6) |
| Mining, quarrying, and oil and gas extraction | 0.8% (5) | 1.5% (5) | 0.0% (0) |
| Clothing and accessories, including shoe, stores | 0.7% (4) | 1.2% (4) | 0.0% (0) |
| Machinery, equipment, and supplies merchant wholesalers | 0.7% (4) | 1.2% (4) | 0.0% (0) |
| Broadcasting and telecommunications | 0.7% (4) | 0.0% (0) | 1.4% (4) |
| Publishing, and motion picture and sound recording industries | 0.7% (4) | 1.2% (4) | 0.0% (0) |
| Paper | 0.7% (4) | 0.9% (3) | 0.4% (1) |
| Printing and related support activities | 0.7% (4) | 0.6% (2) | 0.7% (2) |
| Electronic shopping and mail-order houses | 0.7% (4) | 0.0% (0) | 1.4% (4) |
| Nonmetallic mineral products | 0.7% (4) | 1.2% (4) | 0.0% (0) |
| Food | 0.5% (3) | 0.9% (3) | 0.0% (0) |
| Plastics and rubber products | 0.5% (3) | 0.0% (0) | 1.1% (3) |
| Groceries and related products merchant wholesalers | 0.5% (3) | 0.0% (0) | 1.1% (3) |
| Radio, TV, and computer stores | 0.5% (3) | 0.0% (0) | 1.1% (3) |
| Furniture and home furnishings, and household appliance stores | 0.5% (3) | 0.0% (0) | 1.1% (3) |
| Electrical and electronic goods merchant wholesalers | 0.5% (3) | 0.3% (1) | 0.7% (2) |
| Data processing, libraries, and other information services | 0.5% (3) | 0.9% (3) | 0.0% (0) |
| Vending machine operators | 0.3% (2) | 0.0% (0) | 0.7% (2) |
| Electrical equipment, appliances, and components | 0.3% (2) | 0.6% (2) | 0.0% (0) |
| Other direct selling establishments | 0.3% (2) | 0.6% (2) | 0.0% (0) |
| Arts, entertainment, and recreation | 0.3% (2) | 0.6% (2) | 0.0% (0) |
| Motor vehicles, parts and supplies merchant wholesalers | 0.3% (2) | 0.6% (2) | 0.0% (0) |
| Farm product raw materials merchant wholesalers | 0.3% (2) | 0.6% (2) | 0.0% (0) |
| Personal and laundry services | 0.3% (2) | 0.0% (0) | 0.7% (2) |
| Lumber and other construction materials merchant wholesalers | 0.2% (1) | 0.3% (1) | 0.0% (0) |
| Rail transportation | 0.2% (1) | 0.3% (1) | 0.0% (0) |
| Other transportation, and support activities, and couriers | 0.2% (1) | 0.3% (1) | 0.0% (0) |
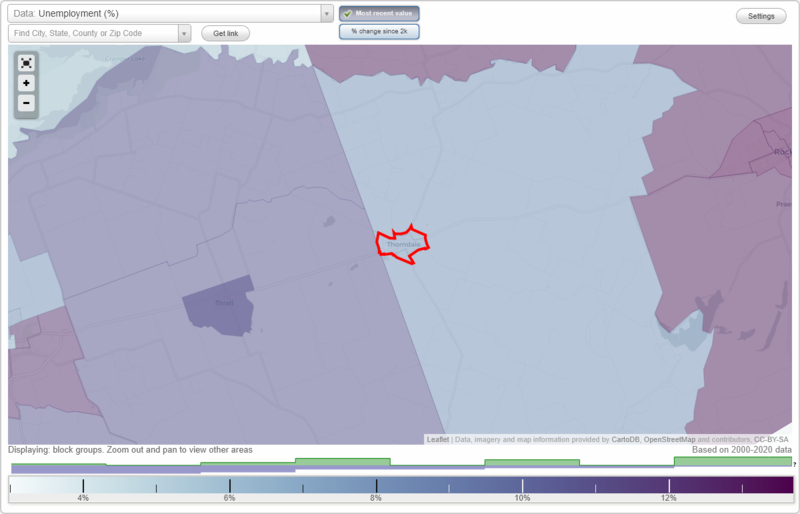
Unemployment in Thorndale
- Unemployment by race in 2022
- Unemployment rate for White non-Hispanic residents
- 3.0%Females
- Unemployment rate for Hispanic or Latino residents
- 0.7%Males
- Unemployment by race in 2000
- Unemployment rate for White non-Hispanic residents
- 2.4%Males
- 1.3%Females
- Unemployment rate for other race residents
- 4.3%Males
- Unemployment rate for two or more race residents
- 18.2%Males
- Unemployment rate for Hispanic or Latino residents
- 4.5%Males
- 17.1%Females
Time leaving home to go to work
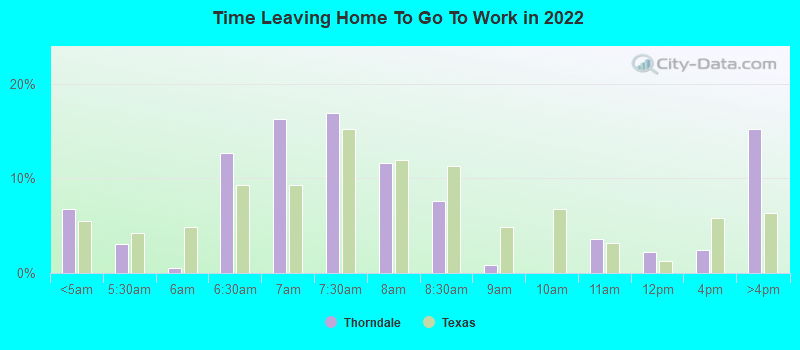
12:00 a.m. to 4:59 a.m.:
| Thorndale: | 6.8% (50) |
| Texas: | 5.5% (678,264) |
5:00 a.m. to 5:29 a.m.:
| Thorndale: | 3.0% (23) |
| Texas: | 4.3% (525,841) |
5:30 a.m. to 5:59 a.m.:
| Thorndale: | 0.5% (4) |
| Texas: | 4.9% (603,953) |
6:00 a.m. to 6:29 a.m.:
| Thorndale: | 12.6% (93) |
| Texas: | 9.4% (1,155,020) |
6:30 a.m. to 6:59 a.m.:
| Thorndale: | 16.3% (120) |
| Texas: | 9.3% (1,152,822) |
7:00 a.m. to 7:29 a.m.:
| Thorndale: | 16.9% (125) |
| Texas: | 15.3% (1,885,477) |
7:30 a.m. to 7:59 a.m.:
| Thorndale: | 11.7% (86) |
| Texas: | 11.9% (1,469,628) |
8:00 a.m. to 8:29 a.m.:
| Thorndale: | 7.6% (56) |
| Texas: | 11.3% (1,400,175) |
8:30 a.m. to 8:59 a.m.:
| Thorndale: | 0.8% (6) |
| Texas: | 4.9% (599,574) |
10:00 a.m. to 10:59 a.m.:
| Thorndale: | 3.6% (27) |
| Texas: | 3.2% (390,354) |
11:00 a.m. to 11:59 a.m.:
| Thorndale: | 2.2% (16) |
| Texas: | 1.3% (162,330) |
12:00 p.m. to 3:59 p.m.:
| Thorndale: | 2.4% (18) |
| Texas: | 5.8% (720,594) |
4:00 p.m. to 11:59 p.m.:
| Thorndale: | 15.2% (112) |
| Texas: | 6.3% (777,072) |
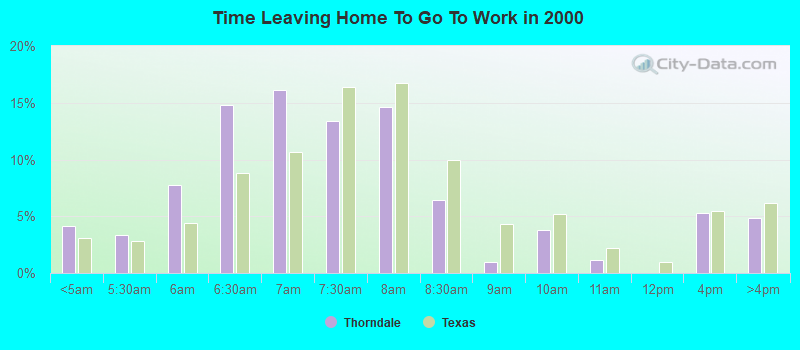
<5am:
| Thorndale: | 4.1% (25) |
| Texas: | 3.1% (281,361) |
5:30am:
| Thorndale: | 3.3% (20) |
| Texas: | 2.9% (262,060) |
6am:
| Thorndale: | 7.8% (47) |
| Texas: | 4.4% (403,423) |
6:30am:
| Thorndale: | 14.8% (89) |
| Texas: | 8.8% (808,876) |
7am:
| Thorndale: | 16.1% (97) |
| Texas: | 10.7% (976,557) |
7:30am:
| Thorndale: | 13.4% (81) |
| Texas: | 16.4% (1,500,904) |
8am:
| Thorndale: | 14.6% (88) |
| Texas: | 16.8% (1,536,308) |
8:30am:
| Thorndale: | 6.5% (39) |
| Texas: | 10.0% (913,601) |
9am:
| Thorndale: | 1.0% (6) |
| Texas: | 4.4% (398,656) |
10am:
| Thorndale: | 3.8% (23) |
| Texas: | 5.2% (472,592) |
11am:
| Thorndale: | 1.2% (7) |
| Texas: | 2.2% (197,844) |
4pm:
| Thorndale: | 5.3% (32) |
| Texas: | 5.5% (503,565) |
>4pm:
| Thorndale: | 4.8% (29) |
| Texas: | 6.1% (563,107) |

12:00 a.m. to 4:59 a.m. - Males:
| Thorndale: | 11.3% (48) |
| Texas: | 7.0% (477,284) |
5:00 a.m. to 5:29 a.m. - Males:
| Thorndale: | 4.0% (17) |
| Texas: | 5.8% (394,876) |
5:30 a.m. to 5:59 a.m. - Males:
| Thorndale: | 0.9% (4) |
| Texas: | 5.9% (402,788) |
6:00 a.m. to 6:29 a.m. - Males:
| Thorndale: | 17.8% (75) |
| Texas: | 10.9% (751,118) |
6:30 a.m. to 6:59 a.m. - Males:
| Thorndale: | 14.5% (61) |
| Texas: | 9.5% (652,306) |
7:00 a.m. to 7:29 a.m. - Males:
| Thorndale: | 8.6% (36) |
| Texas: | 14.1% (970,598) |
7:30 a.m. to 7:59 a.m. - Males:
| Thorndale: | 8.8% (37) |
| Texas: | 10.2% (696,429) |
8:00 a.m. to 8:29 a.m. - Males:
| Thorndale: | 8.2% (35) |
| Texas: | 10.6% (729,041) |
10:00 a.m. to 10:59 a.m. - Males:
| Thorndale: | 6.5% (27) |
| Texas: | 2.7% (186,469) |
11:00 a.m. to 11:59 a.m. - Males:
| Thorndale: | 3.9% (16) |
| Texas: | 1.2% (82,242) |
12:00 p.m. to 3:59 p.m. - Males:
| Thorndale: | 2.9% (12) |
| Texas: | 5.8% (397,795) |
4:00 p.m. to 11:59 p.m. - Males:
| Thorndale: | 13.3% (56) |
| Texas: | 6.4% (435,950) |
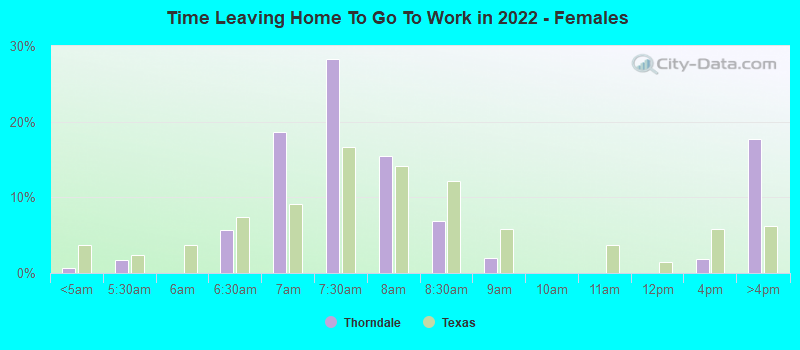
12:00 a.m. to 4:59 a.m. - Females:
| Thorndale: | 0.7% (2) |
| Texas: | 3.7% (200,980) |
5:00 a.m. to 5:29 a.m. - Females:
| Thorndale: | 1.7% (6) |
| Texas: | 2.4% (130,965) |
6:00 a.m. to 6:29 a.m. - Females:
| Thorndale: | 5.7% (18) |
| Texas: | 7.4% (403,902) |
6:30 a.m. to 6:59 a.m. - Females:
| Thorndale: | 18.6% (59) |
| Texas: | 9.1% (500,516) |
7:00 a.m. to 7:29 a.m. - Females:
| Thorndale: | 28.3% (90) |
| Texas: | 16.7% (914,879) |
7:30 a.m. to 7:59 a.m. - Females:
| Thorndale: | 15.5% (49) |
| Texas: | 14.1% (773,199) |
8:00 a.m. to 8:29 a.m. - Females:
| Thorndale: | 6.8% (22) |
| Texas: | 12.2% (671,134) |
8:30 a.m. to 8:59 a.m. - Females:
| Thorndale: | 1.9% (6) |
| Texas: | 5.8% (317,812) |
12:00 p.m. to 3:59 p.m. - Females:
| Thorndale: | 1.8% (6) |
| Texas: | 5.9% (322,799) |
4:00 p.m. to 11:59 p.m. - Females:
| Thorndale: | 17.6% (56) |
| Texas: | 6.2% (341,122) |
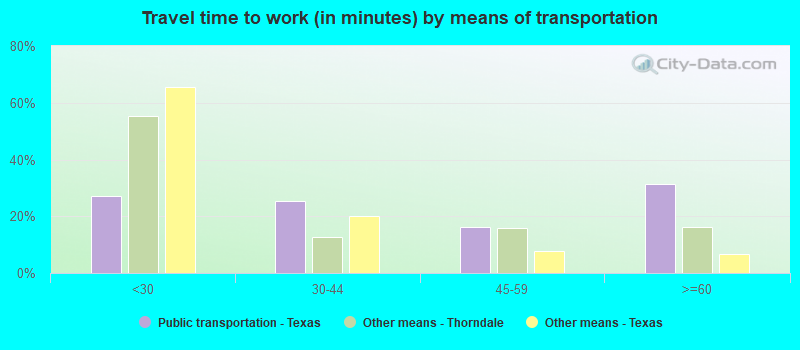
Travel time to work
Percentage of workers working in this county: 40.6%
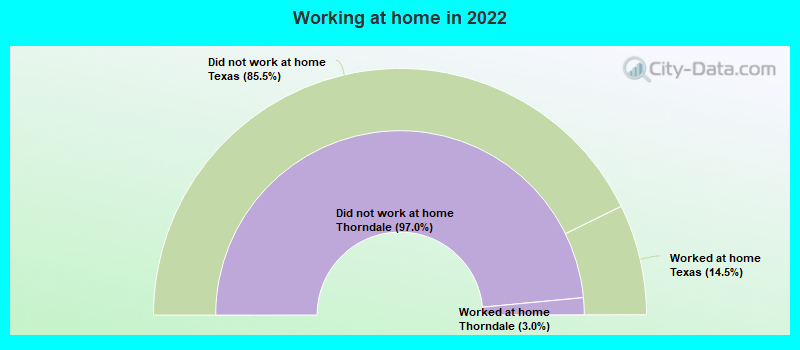
Number of people working at home: 17 (2.3% of all workers)
Number of people working at home: 17 (2.3% of all workers)
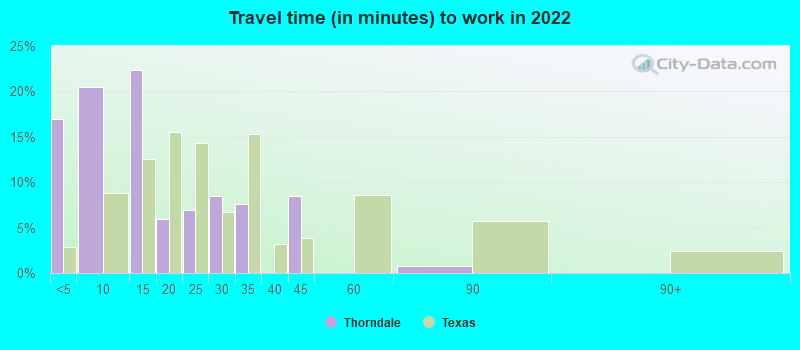
Less than 5 minutes:
| Thorndale: | 17.0% (69) |
| Texas: | 2.8% (350,462) |
5 to 9 minutes:
| Thorndale: | 20.4% (83) |
| Texas: | 8.8% (1,087,762) |
10 to 14 minutes:
| Thorndale: | 22.3% (91) |
| Texas: | 12.6% (1,550,271) |
15 to 19 minutes:
| Thorndale: | 6.0% (25) |
| Texas: | 15.6% (1,918,353) |
20 to 24 minutes:
| Thorndale: | 7.0% (28) |
| Texas: | 14.4% (1,772,079) |
25 to 29 minutes:
| Thorndale: | 8.5% (35) |
| Texas: | 6.7% (827,833) |
30 to 34 minutes:
| Thorndale: | 7.6% (31) |
| Texas: | 15.3% (1,887,878) |
40 to 44 minutes:
| Thorndale: | 8.4% (35) |
| Texas: | 3.9% (476,118) |
60 to 89 minutes:
| Thorndale: | 0.8% (3) |
| Texas: | 5.7% (706,002) |
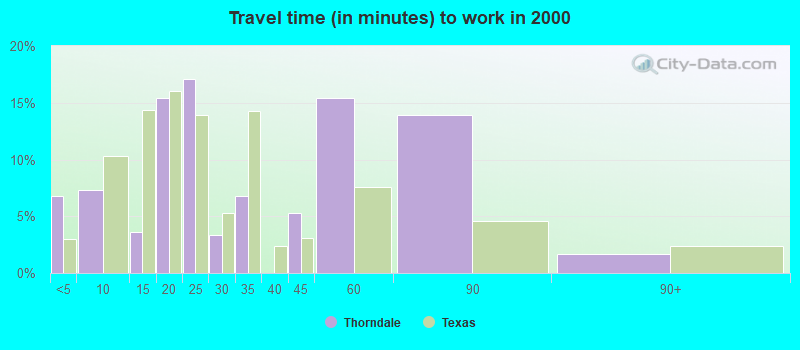
Less than 5 minutes:
| Thorndale: | 6.8% (41) |
| Texas: | 3.0% (277,642) |
5 to 9 minutes:
| Thorndale: | 7.3% (44) |
| Texas: | 10.3% (942,891) |
10 to 14 minutes:
| Thorndale: | 3.6% (22) |
| Texas: | 14.4% (1,317,555) |
15 to 19 minutes:
| Thorndale: | 15.4% (93) |
| Texas: | 16.0% (1,467,945) |
20 to 24 minutes:
| Thorndale: | 17.1% (103) |
| Texas: | 13.9% (1,276,781) |
25 to 29 minutes:
| Thorndale: | 3.3% (20) |
| Texas: | 5.3% (482,838) |
30 to 34 minutes:
| Thorndale: | 6.8% (41) |
| Texas: | 14.3% (1,309,699) |
40 to 44 minutes:
| Thorndale: | 5.3% (32) |
| Texas: | 3.1% (280,916) |
45 to 59 minutes:
| Thorndale: | 15.4% (93) |
| Texas: | 7.6% (692,006) |
60 to 89 minutes:
| Thorndale: | 13.9% (84) |
| Texas: | 4.6% (418,905) |
90 or more minutes:
| Thorndale: | 1.7% (10) |
| Texas: | 2.4% (218,800) |
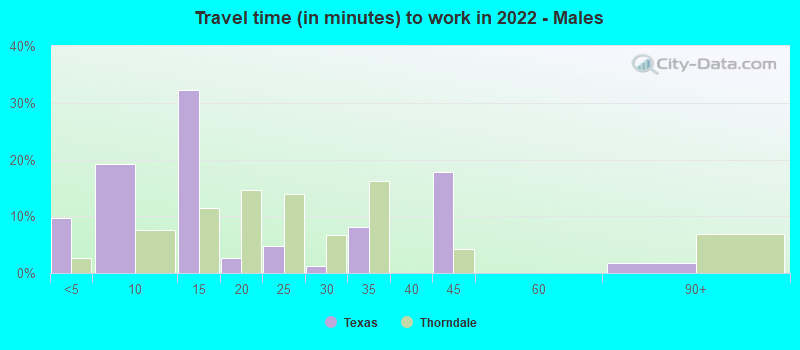
Less than 5 minutes - Males:
| Thorndale: | 9.6% (19) |
| Texas: | 2.7% (181,937) |
5 to 9 minutes - Males:
| Thorndale: | 19.1% (37) |
| Texas: | 7.6% (522,166) |
10 to 14 minutes - Males:
| Thorndale: | 32.2% (62) |
| Texas: | 11.5% (785,572) |
15 to 19 minutes - Males:
| Thorndale: | 2.6% (5) |
| Texas: | 14.6% (1,001,179) |
20 to 24 minutes - Males:
| Thorndale: | 4.7% (9) |
| Texas: | 13.9% (950,043) |
25 to 29 minutes - Males:
| Thorndale: | 1.2% (2) |
| Texas: | 6.7% (457,259) |
30 to 34 minutes - Males:
| Thorndale: | 8.1% (16) |
| Texas: | 16.2% (1,110,357) |
40 to 44 minutes - Males:
| Thorndale: | 17.8% (34) |
| Texas: | 4.2% (289,434) |
60 to 89 minutes - Males:
| Thorndale: | 1.7% (3) |
| Texas: | 6.8% (467,154) |
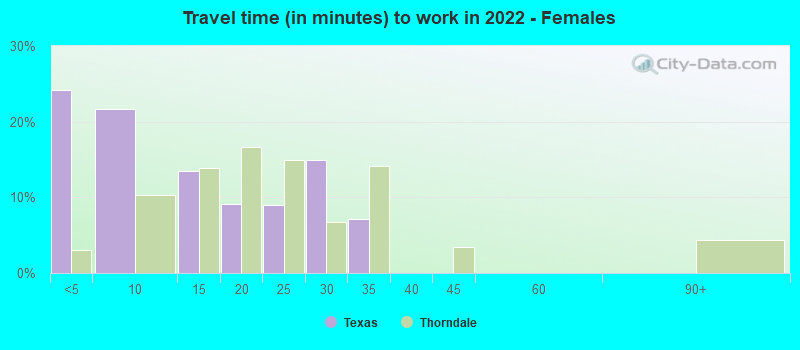
Less than 5 minutes - Females:
| Thorndale: | 24.2% (52) |
| Texas: | 3.1% (168,525) |
5 to 9 minutes - Females:
| Thorndale: | 21.7% (46) |
| Texas: | 10.3% (565,596) |
10 to 14 minutes - Females:
| Thorndale: | 13.5% (29) |
| Texas: | 13.9% (764,699) |
15 to 19 minutes - Females:
| Thorndale: | 9.2% (20) |
| Texas: | 16.7% (917,174) |
20 to 24 minutes - Females:
| Thorndale: | 9.0% (19) |
| Texas: | 15.0% (822,036) |
25 to 29 minutes - Females:
| Thorndale: | 14.9% (32) |
| Texas: | 6.7% (370,574) |
30 to 34 minutes - Females:
| Thorndale: | 7.2% (15) |
| Texas: | 14.2% (777,521) |
Means of transportation to work
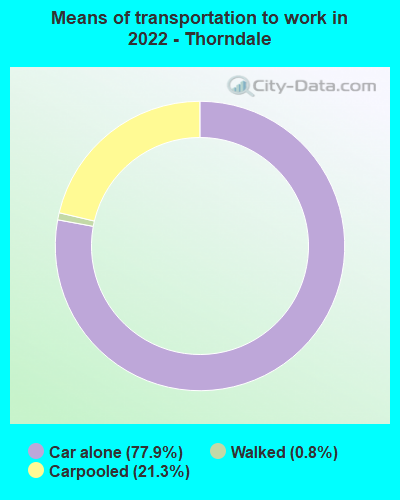

Drove car alone:
| Thorndale: | 77.9% (343) |
| Texas: | 83.3% (4,557,023) |
Carpooled:
| Thorndale: | 21.3% (94) |
| Texas: | 11.7% (674,818) |
Walked:
| Thorndale: | 0.8% (3) |
| Texas: | 1.7% (99,911) |
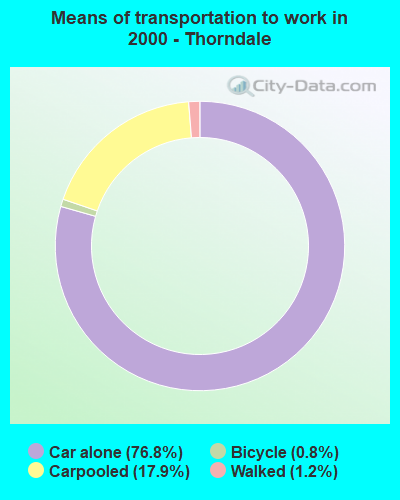

Drove car alone:
| Thorndale: | 76.8% (463) |
| Texas: | 77.7% (7,115,590) |
Carpooled:
| Thorndale: | 17.9% (108) |
| Texas: | 14.5% (1,326,012) |
Bicycle:
| Thorndale: | 0.8% (5) |
| Texas: | 0.2% (21,551) |
Walked:
| Thorndale: | 1.2% (7) |
| Texas: | 1.9% (173,670) |
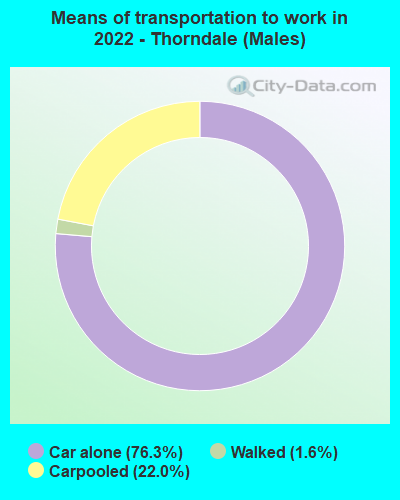

Drove car alone - Males:
| Thorndale: | 76.3% (158) |
| Texas: | 83.6% (4,557,023) |
Carpooled - Males:
| Thorndale: | 22.0% (46) |
| Texas: | 11.2% (674,818) |
Walked - Males:
| Thorndale: | 1.6% (3) |
| Texas: | 1.7% (99,911) |
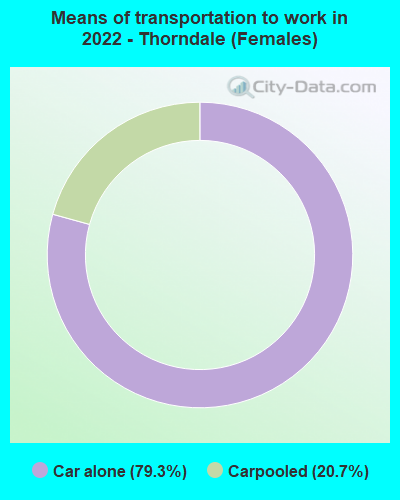

Drove car alone - Females:
| Thorndale: | 79.3% (185) |
| Texas: | 83.0% (4,557,023) |
Carpooled - Females:
| Thorndale: | 20.7% (48) |
| Texas: | 12.3% (674,818) |
Private vehicle occupancy
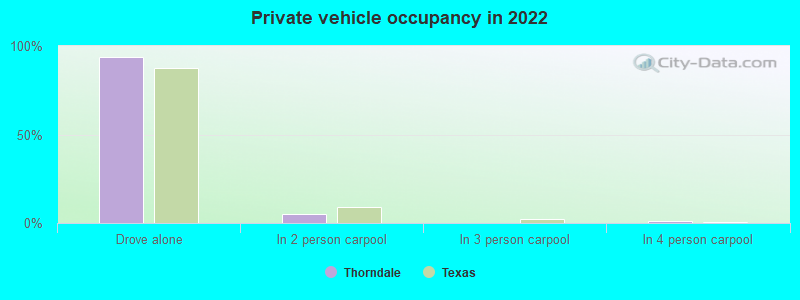
Drove alone:
| Thorndale: | 93.5% (664) |
| Texas: | 87.6% (10,283,021) |
In 2 person carpool:
| Thorndale: | 5.0% (36) |
| Texas: | 9.0% (1,052,595) |
In 4 person carpool:
| Thorndale: | 0.9% (7) |
| Texas: | 0.8% (92,732) |
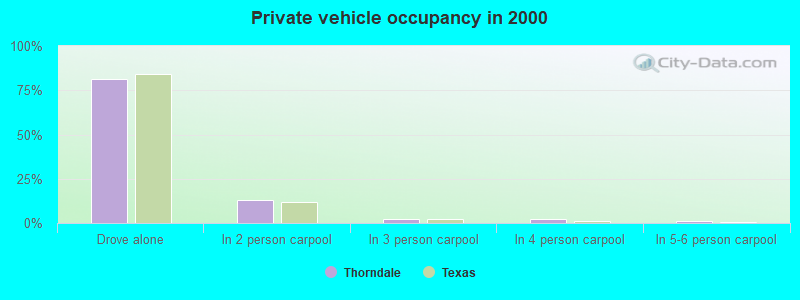
Drove alone:
| Thorndale: | 81.1% (463) |
| Texas: | 84.3% (7,115,590) |
In 2 person carpool:
| Thorndale: | 12.8% (73) |
| Texas: | 11.6% (982,994) |
In 3 person carpool:
| Thorndale: | 2.3% (13) |
| Texas: | 2.4% (201,602) |
In 4 person carpool:
| Thorndale: | 2.5% (14) |
| Texas: | 1.0% (83,518) |
In 5-6 person carpool:
| Thorndale: | 1.4% (8) |
| Texas: | 0.5% (40,662) |
Class of workers
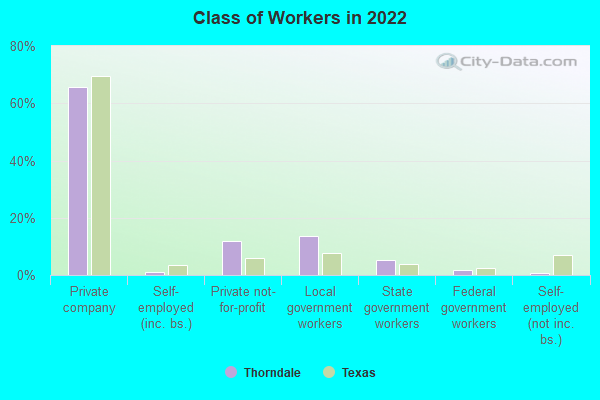
Employee of private company:
| Thorndale: | 65.8% (517) |
| Texas: | 69.6% (10,139,666) |
Self-employed in own incorporated business:
| Thorndale: | 1.2% (9) |
| Texas: | 3.5% (516,446) |
Private not-for-profit wage and salary workers:
| Thorndale: | 11.9% (93) |
| Texas: | 6.0% (870,454) |
Local government workers:
| Thorndale: | 13.8% (108) |
| Texas: | 7.6% (1,109,799) |
State government workers:
| Thorndale: | 5.1% (40) |
| Texas: | 3.8% (558,618) |
Federal government workers:
| Thorndale: | 1.6% (13) |
| Texas: | 2.5% (357,298) |
Self-employed workers in own not incorporated business:
| Thorndale: | 0.7% (5) |
| Texas: | 6.8% (998,270) |
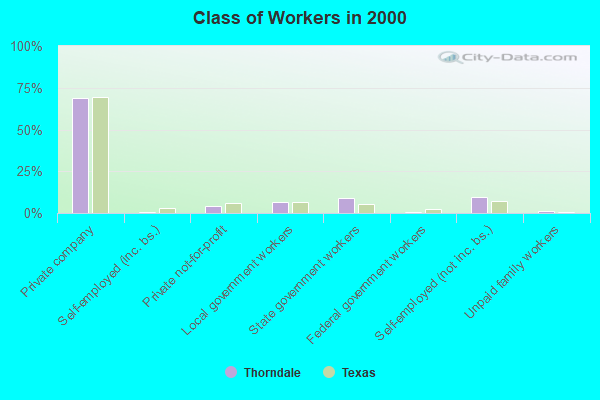
Employee of private company:
| Thorndale: | 69.0% (421) |
| Texas: | 69.6% (6,425,274) |
Self-employed in own incorporated business:
| Thorndale: | 0.3% (2) |
| Texas: | 2.7% (250,864) |
Private not-for-profit wage and salary workers:
| Thorndale: | 4.1% (25) |
| Texas: | 5.7% (526,631) |
Local government workers:
| Thorndale: | 6.4% (39) |
| Texas: | 6.6% (608,479) |
State government workers:
| Thorndale: | 9.2% (56) |
| Texas: | 5.4% (501,082) |
Federal government workers:
| Thorndale: | 0.3% (2) |
| Texas: | 2.6% (237,177) |
Self-employed workers in own not incorporated business:
| Thorndale: | 9.5% (58) |
| Texas: | 7.1% (653,527) |
Unpaid family workers:
| Thorndale: | 1.1% (7) |
| Texas: | 0.3% (31,338) |
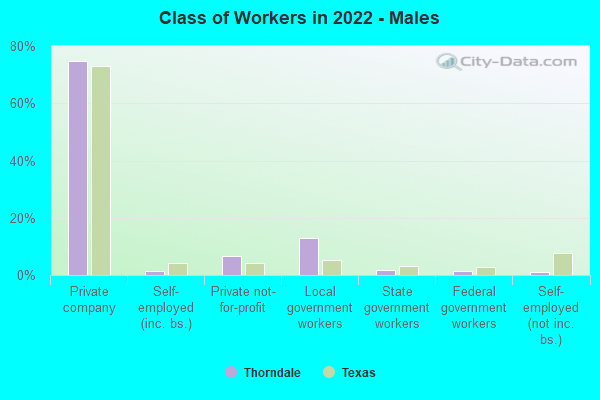
Employee of private company - Males:
| Thorndale: | 74.7% (336) |
| Texas: | 73.1% (5,788,450) |
Self-employed in own incorporated business - Males:
| Thorndale: | 1.4% (6) |
| Texas: | 4.2% (332,655) |
Private not-for-profit wage and salary workers - Males:
| Thorndale: | 6.7% (30) |
| Texas: | 4.1% (323,476) |
Local government workers - Males:
| Thorndale: | 12.8% (58) |
| Texas: | 5.1% (405,467) |
State government workers - Males:
| Thorndale: | 1.9% (8) |
| Texas: | 3.0% (236,706) |
Federal government workers - Males:
| Thorndale: | 1.4% (6) |
| Texas: | 2.7% (211,629) |
Self-employed workers in own not incorporated business - Males:
| Thorndale: | 1.2% (5) |
| Texas: | 7.7% (609,246) |
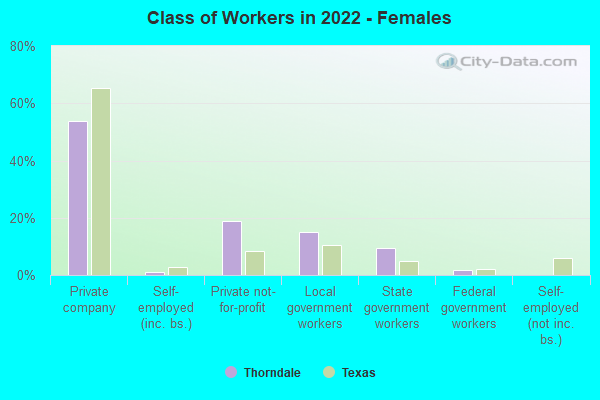
Employee of private company - Females:
| Thorndale: | 53.9% (180) |
| Texas: | 65.4% (4,351,216) |
Self-employed in own incorporated business - Females:
| Thorndale: | 0.9% (3) |
| Texas: | 2.8% (183,791) |
Private not-for-profit wage and salary workers - Females:
| Thorndale: | 18.8% (63) |
| Texas: | 8.2% (546,978) |
Local government workers - Females:
| Thorndale: | 15.0% (50) |
| Texas: | 10.6% (704,332) |
State government workers - Females:
| Thorndale: | 9.4% (31) |
| Texas: | 4.8% (321,912) |
Federal government workers - Females:
| Thorndale: | 1.9% (6) |
| Texas: | 2.2% (145,669) |