Work and Jobs in Trenton, New York (NY) Detailed Stats
Occupations, Industries, Unemployment, Workers, Commute
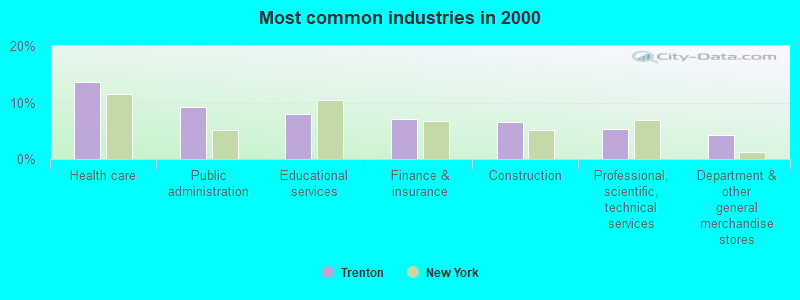
The most common industries in Trenton are: Health care (13.5% of civilian employees), Public administration (9.2% of civilian employees), Educational services (8.0% of civilian employees). 56.0% of workers are employees of private companies, which is 13.8% less than the rate of 63.7% across the entire state of New York.
Most common industries
Most common industries | |||
|---|---|---|---|
Industry | All | Males | Females |
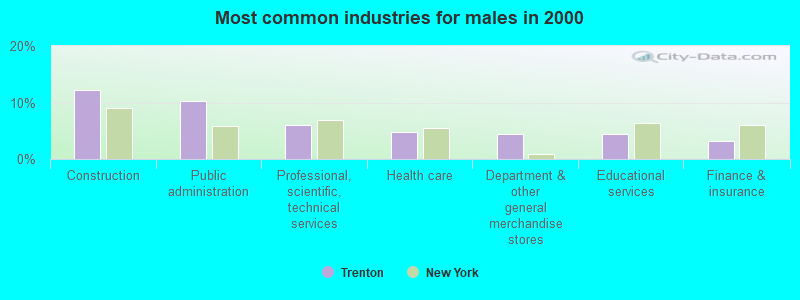
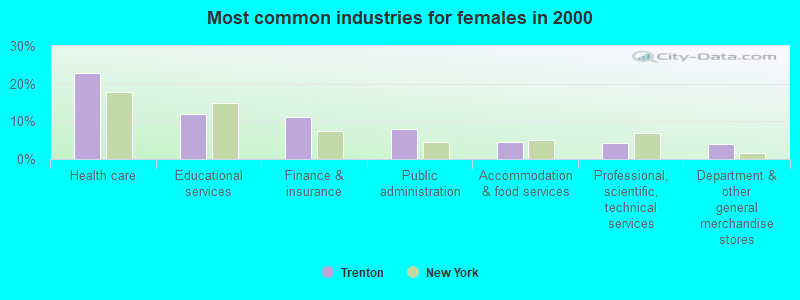
| Health care | 13.5% (325) | 4.9% (60) | 22.7% (265) |
| Public administration | 9.2% (220) | 10.3% (127) | 8.0% (93) |
| Educational services | 8.0% (192) | 4.4% (54) | 11.8% (138) |
| Finance and insurance | 7.1% (171) | 3.2% (40) | 11.2% (131) |
| Construction | 6.6% (159) | 12.2% (151) | 0.7% (8) |
| Professional, scientific, and technical services | 5.2% (126) | 6.1% (75) | 4.4% (51) |
| Department and other general merchandise stores | 4.2% (101) | 4.4% (54) | 4.0% (47) |
| Accommodation and food services | 3.8% (91) | 3.1% (38) | 4.5% (53) |
| Religious, grantmaking, civic, professional, and similar organizations | 3.2% (76) | 2.7% (33) | 3.7% (43) |
| Food and beverage stores | 2.6% (62) | 2.5% (31) | 2.7% (31) |
| Miscellaneous manufacturing | 2.1% (51) | 1.5% (19) | 2.7% (32) |
| Personal and laundry services | 1.8% (44) | 1.6% (20) | 2.1% (24) |
| Metal and metal products | 1.7% (41) | 2.8% (35) | 0.5% (6) |
| Administrative and support and waste management services | 1.6% (38) | 0.3% (4) | 2.9% (34) |
| Motor vehicle and parts dealers | 1.5% (37) | 2.7% (33) | 0.3% (4) |
| Pharmacies and drug stores | 1.5% (37) | 0.4% (5) | 2.7% (32) |
| Computer and electronic products | 1.4% (34) | 2.2% (27) | 0.6% (7) |
| Arts, entertainment, and recreation | 1.3% (32) | 0.9% (11) | 1.8% (21) |
| Publishing, and motion picture and sound recording industries | 1.2% (30) | 0.5% (6) | 2.1% (24) |
| Printing and related support activities | 1.2% (28) | 1.8% (22) | 0.5% (6) |
| Utilities | 1.1% (27) | 1.8% (22) | 0.4% (5) |
| Repair and maintenance | 1.1% (26) | 2.1% (26) | 0.0% (0) |
| Transportation equipment | 1.0% (25) | 1.7% (21) | 0.3% (4) |
| Groceries and related products merchant wholesalers | 1.0% (23) | 1.9% (23) | 0.0% (0) |
| Electrical equipment, appliances, and components | 1.0% (23) | 1.9% (23) | 0.0% (0) |
| Building material and garden equipment and supplies dealers | 0.9% (22) | 1.1% (14) | 0.7% (8) |
| Agriculture, forestry, fishing and hunting | 0.9% (21) | 1.7% (21) | 0.0% (0) |
| Sporting goods, camera, and hobby and toy stores | 0.8% (20) | 0.3% (4) | 1.4% (16) |
| Food | 0.8% (19) | 1.5% (19) | 0.0% (0) |
| Miscellaneous nondurable goods merchant wholesalers | 0.8% (18) | 1.5% (18) | 0.0% (0) |
| Other transportation, and support activities, and couriers | 0.7% (16) | 1.1% (14) | 0.2% (2) |
| Social assistance | 0.7% (16) | 0.9% (11) | 0.4% (5) |
| Machinery | 0.6% (15) | 0.3% (4) | 0.9% (11) |
| Other direct selling establishments | 0.6% (15) | 0.4% (5) | 0.9% (10) |
| Radio, TV, and computer stores | 0.6% (15) | 1.2% (15) | 0.0% (0) |
| Clothing and accessories, including shoe, stores | 0.6% (15) | 0.6% (8) | 0.6% (7) |
| Electrical and electronic goods merchant wholesalers | 0.5% (13) | 1.1% (13) | 0.0% (0) |
| Broadcasting and telecommunications | 0.5% (13) | 0.2% (2) | 0.9% (11) |
| Real estate and rental and leasing | 0.5% (12) | 0.2% (3) | 0.8% (9) |
| Beverage and tobacco products | 0.5% (12) | 1.0% (12) | 0.0% (0) |
| Furniture and related product manufacturing | 0.4% (10) | 0.8% (10) | 0.0% (0) |
| Machinery, equipment, and supplies merchant wholesalers | 0.4% (10) | 0.8% (10) | 0.0% (0) |
| Paper | 0.4% (9) | 0.7% (9) | 0.0% (0) |
| Wood products | 0.4% (9) | 0.7% (9) | 0.0% (0) |
| Hardware, plumbing and heating equipment, and supplies merchant wholesalers | 0.3% (8) | 0.6% (8) | 0.0% (0) |
| Petroleum and petroleum products merchant wholesalers | 0.3% (8) | 0.6% (8) | 0.0% (0) |
| Data processing, libraries, and other information services | 0.3% (7) | 0.0% (0) | 0.6% (7) |
| Chemicals | 0.3% (7) | 0.5% (6) | 0.1% (1) |
| Furniture and home furnishings, and household appliance stores | 0.3% (7) | 0.2% (2) | 0.4% (5) |
| Motor vehicles, parts and supplies merchant wholesalers | 0.3% (7) | 0.6% (7) | 0.0% (0) |
| Fuel dealers | 0.3% (7) | 0.6% (7) | 0.0% (0) |
| U. S. Postal service | 0.2% (6) | 0.2% (3) | 0.3% (3) |
| Textile mills and textile products | 0.2% (6) | 0.5% (6) | 0.0% (0) |
| Warehousing and storage | 0.2% (5) | 0.4% (5) | 0.0% (0) |
| Gasoline stations | 0.2% (5) | 0.2% (3) | 0.2% (2) |
| Used merchandise, gift, novelty, and souvenir, and other miscellaneous stores | 0.2% (4) | 0.3% (4) | 0.0% (0) |
| Jewelry, luggage, and leather goods stores | 0.2% (4) | 0.2% (2) | 0.2% (2) |
| Air transportation | 0.1% (3) | 0.2% (3) | 0.0% (0) |
| Recyclable material merchant wholesalers | 0.1% (3) | 0.0% (0) | 0.3% (3) |
| Truck transportation | 0.1% (3) | 0.2% (3) | 0.0% (0) |
| Nonmetallic mineral products | 0.1% (2) | 0.2% (2) | 0.0% (0) |
| Plastics and rubber products | 0.1% (2) | 0.2% (2) | 0.0% (0) |
| Mining, quarrying, and oil and gas extraction | 0.1% (2) | 0.2% (2) | 0.0% (0) |
Unemployment in Trenton
- Unemployment by race in 2000
- Unemployment rate for White non-Hispanic residents
- 4.2%Males
- 2.5%Females
Time leaving home to go to work
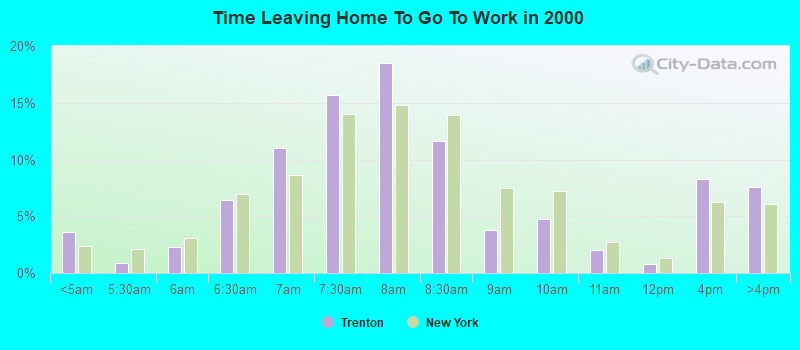
<5am:
| Trenton: | 3.6% (85) |
| New York: | 2.4% (194,562) |
5:30am:
| Trenton: | 0.9% (21) |
| New York: | 2.1% (174,328) |
6am:
| Trenton: | 2.3% (55) |
| New York: | 3.1% (253,826) |
6:30am:
| Trenton: | 6.4% (152) |
| New York: | 7.0% (573,349) |
7am:
| Trenton: | 11.0% (259) |
| New York: | 8.6% (706,982) |
7:30am:
| Trenton: | 15.6% (369) |
| New York: | 14.0% (1,147,579) |
8am:
| Trenton: | 18.5% (437) |
| New York: | 14.8% (1,213,706) |
8:30am:
| Trenton: | 11.6% (274) |
| New York: | 13.9% (1,144,298) |
9am:
| Trenton: | 3.8% (89) |
| New York: | 7.5% (614,475) |
10am:
| Trenton: | 4.7% (112) |
| New York: | 7.2% (593,377) |
11am:
| Trenton: | 2.0% (48) |
| New York: | 2.7% (224,011) |
12pm:
| Trenton: | 0.8% (18) |
| New York: | 1.3% (105,049) |
4pm:
| Trenton: | 8.3% (196) |
| New York: | 6.3% (517,309) |
>4pm:
| Trenton: | 7.6% (179) |
| New York: | 6.1% (501,196) |
Travel time to work
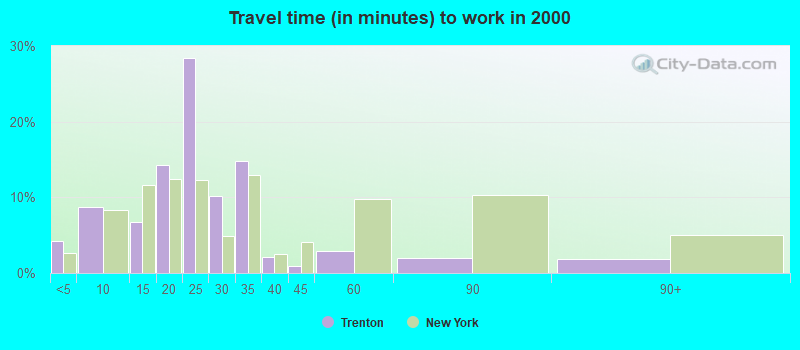
Less than 5 minutes:
| Trenton: | 4.2% (99) |
| New York: | 2.7% (219,036) |
5 to 9 minutes:
| Trenton: | 8.8% (207) |
| New York: | 8.3% (680,270) |
10 to 14 minutes:
| Trenton: | 6.7% (159) |
| New York: | 11.6% (956,590) |
15 to 19 minutes:
| Trenton: | 14.3% (337) |
| New York: | 12.4% (1,020,084) |
20 to 24 minutes:
| Trenton: | 28.5% (671) |
| New York: | 12.3% (1,013,757) |
25 to 29 minutes:
| Trenton: | 10.2% (240) |
| New York: | 4.9% (399,384) |
30 to 34 minutes:
| Trenton: | 14.8% (349) |
| New York: | 12.9% (1,058,688) |
35 to 39 minutes:
| Trenton: | 2.1% (49) |
| New York: | 2.5% (203,722) |
40 to 44 minutes:
| Trenton: | 0.9% (21) |
| New York: | 4.1% (340,311) |
45 to 59 minutes:
| Trenton: | 2.9% (69) |
| New York: | 9.8% (806,556) |
60 to 89 minutes:
| Trenton: | 2.0% (48) |
| New York: | 10.3% (848,185) |
90 or more minutes:
| Trenton: | 1.9% (45) |
| New York: | 5.1% (417,464) |
Means of transportation to work
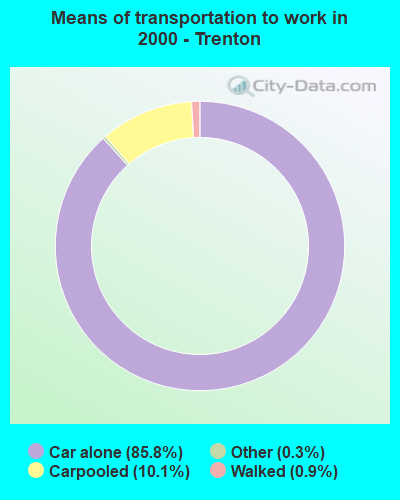

Drove car alone:
| Trenton: | 85.8% (2,022) |
| New York: | 56.3% (4,620,178) |
Carpooled:
| Trenton: | 10.1% (238) |
| New York: | 9.2% (756,918) |
Subway or elevated:
| Trenton: | 0.1% (2) |
| New York: | 14.8% (1,217,009) |
Motorcycle:
| Trenton: | 0.1% (2) |
| New York: | 0.0% (3,625) |
Walked:
| Trenton: | 0.9% (22) |
| New York: | 6.2% (511,721) |
Other means:
| Trenton: | 0.3% (8) |
| New York: | 0.5% (40,375) |
Private vehicle occupancy
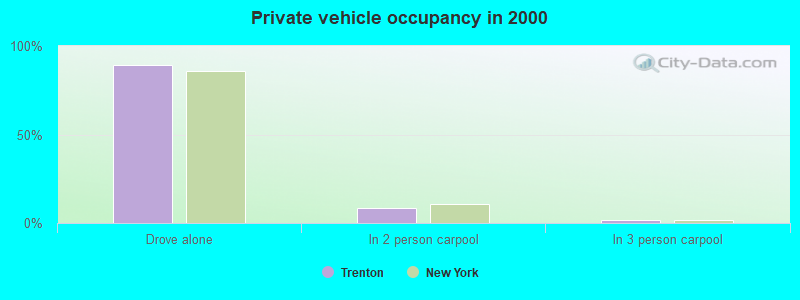
Drove alone:
| Trenton: | 89.5% (2,022) |
| New York: | 85.9% (4,620,178) |
In 2 person carpool:
| Trenton: | 8.6% (195) |
| New York: | 11.0% (590,255) |
In 3 person carpool:
| Trenton: | 1.7% (38) |
| New York: | 1.8% (96,470) |
In 4 person carpool:
| Trenton: | 0.2% (5) |
| New York: | 0.7% (36,112) |
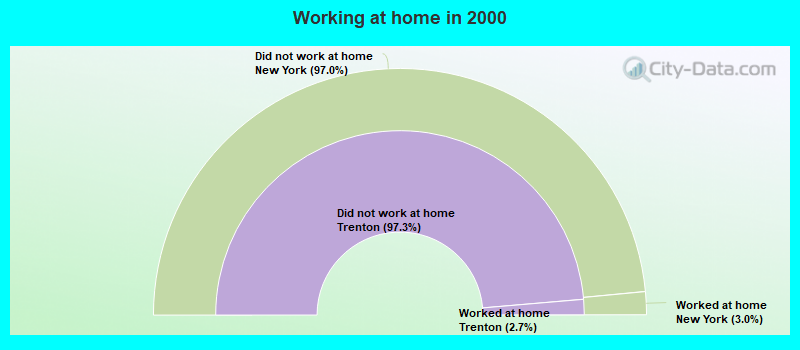
Class of workers
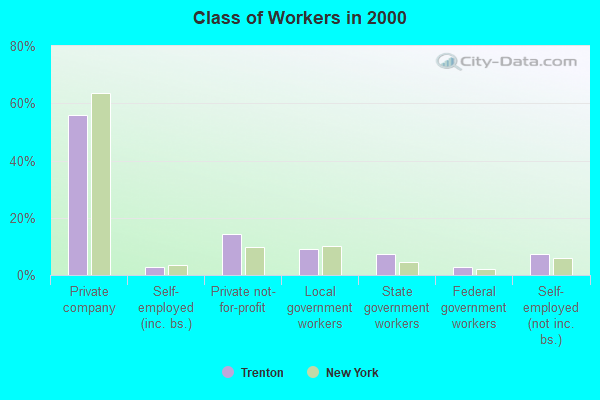
Employee of private company:
| Trenton: | 56.0% (1,344) |
| New York: | 63.7% (5,340,134) |
Self-employed in own incorporated business:
| Trenton: | 2.8% (67) |
| New York: | 3.4% (283,619) |
Private not-for-profit wage and salary workers:
| Trenton: | 14.4% (345) |
| New York: | 9.7% (810,356) |
Local government workers:
| Trenton: | 8.9% (214) |
| New York: | 10.2% (858,120) |
State government workers:
| Trenton: | 7.5% (180) |
| New York: | 4.6% (383,673) |
Federal government workers:
| Trenton: | 2.8% (67) |
| New York: | 2.2% (185,100) |
Self-employed workers in own not incorporated business:
| Trenton: | 7.4% (177) |
| New York: | 6.0% (501,068) |
Unpaid family workers:
| Trenton: | 0.2% (6) |
| New York: | 0.2% (20,918) |
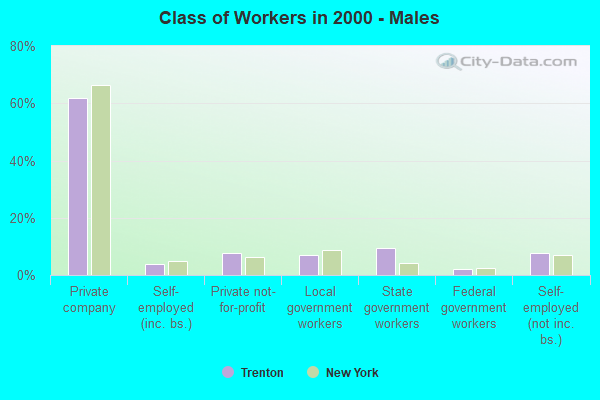
Employee of private company - Males:
| Trenton: | 61.7% (762) |
| New York: | 66.2% (2,902,064) |
Self-employed in own incorporated business - Males:
| Trenton: | 4.0% (49) |
| New York: | 4.9% (215,651) |
Private not-for-profit wage and salary workers - Males:
| Trenton: | 7.5% (93) |
| New York: | 6.3% (277,787) |
Local government workers - Males:
| Trenton: | 7.1% (88) |
| New York: | 8.7% (380,426) |
State government workers - Males:
| Trenton: | 9.5% (117) |
| New York: | 4.1% (181,784) |
Federal government workers - Males:
| Trenton: | 2.3% (28) |
| New York: | 2.3% (102,647) |
Self-employed workers in own not incorporated business - Males:
| Trenton: | 7.7% (95) |
| New York: | 7.1% (312,497) |
Unpaid family workers - Males:
| Trenton: | 0.2% (3) |
| New York: | 0.2% (9,470) |
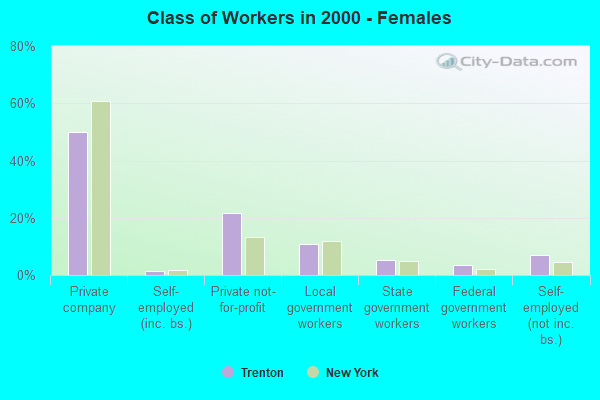
Employee of private company - Females:
| Trenton: | 50.0% (582) |
| New York: | 60.9% (2,438,070) |
Self-employed in own incorporated business - Females:
| Trenton: | 1.5% (18) |
| New York: | 1.7% (67,968) |
Private not-for-profit wage and salary workers - Females:
| Trenton: | 21.6% (252) |
| New York: | 13.3% (532,569) |
Local government workers - Females:
| Trenton: | 10.8% (126) |
| New York: | 11.9% (477,694) |
State government workers - Females:
| Trenton: | 5.4% (63) |
| New York: | 5.0% (201,889) |
Federal government workers - Females:
| Trenton: | 3.3% (39) |
| New York: | 2.1% (82,453) |
Self-employed workers in own not incorporated business - Females:
| Trenton: | 7.0% (82) |
| New York: | 4.7% (188,571) |
Unpaid family workers - Females:
| Trenton: | 0.3% (3) |
| New York: | 0.3% (11,448) |