Work and Jobs in Troy, New Hampshire (NH) Detailed Stats
Occupations, Industries, Unemployment, Workers, Commute
Settings
X


Recent posts about work in Troy, New Hampshire on our local forum with over 2,400,000 registered users:
 | Thinking about moving to Manchester NH (14 replies) |
| New Hampshire Rail Ideas (54 replies) |
| Life in Keene (5 replies) |
Latest news about work in Troy, NH collected exclusively by city-data.com from local newspapers, TV, and radio stations
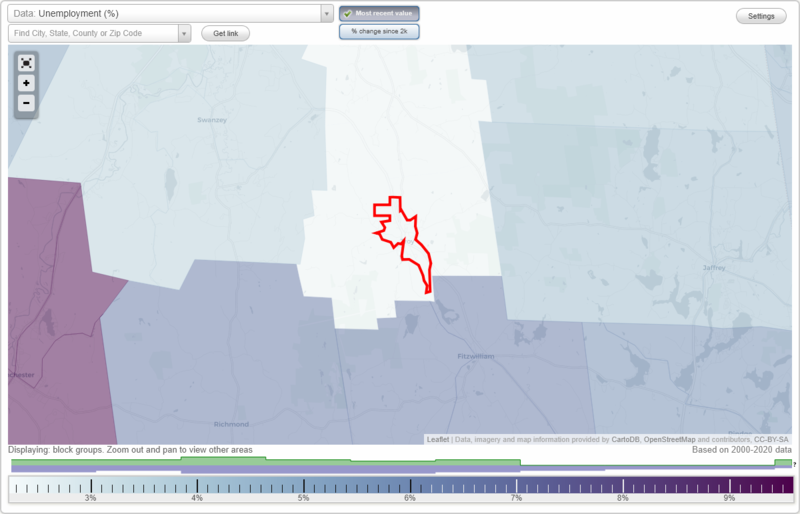
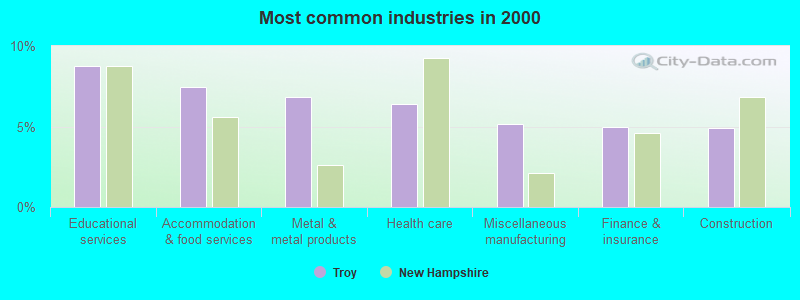
The unemployment rate in 2023 in Troy, NH was 2.4%, which was 4.2% less than the unemployment rate of 2.5% across the entire state of New Hampshire. Compared to the unemployment rate of 4.9% in 2013, this represents a decrease of 104.2%. The most common industries in Troy are: Educational services (8.8% of civilian employees), Accommodation & food services (7.5% of civilian employees), Metal & metal products (6.8% of civilian employees). 73.1% of workers are employees of private companies, which is 6.5% greater than the rate of 68.4% across the entire state of New Hampshire.
Most common industries
Most common industries | |||
|---|---|---|---|
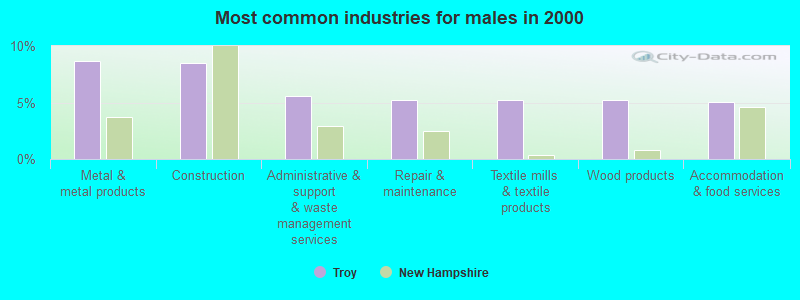
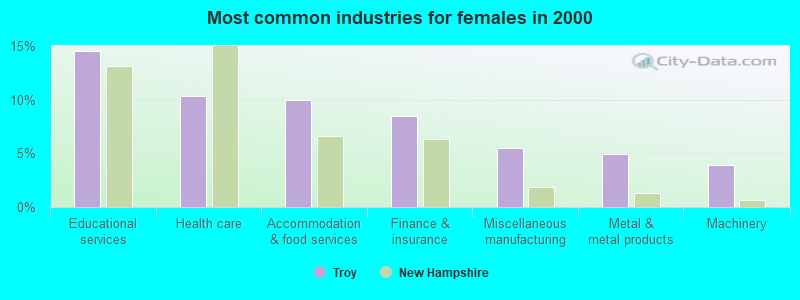
Industry | All | Males | Females |
| Educational services | 8.8% (95) | 3.3% (18) | 14.5% (77) |
| Accommodation and food services | 7.5% (81) | 5.1% (28) | 10.0% (53) |
| Metal and metal products | 6.8% (74) | 8.7% (48) | 4.9% (26) |
| Health care | 6.4% (69) | 2.5% (14) | 10.4% (55) |
| Miscellaneous manufacturing | 5.2% (56) | 4.9% (27) | 5.5% (29) |
| Finance and insurance | 5.0% (54) | 1.6% (9) | 8.5% (45) |
| Construction | 4.9% (53) | 8.5% (47) | 1.1% (6) |
| Textile mills and textile products | 4.3% (47) | 5.3% (29) | 3.4% (18) |
| Machinery | 4.2% (45) | 4.3% (24) | 4.0% (21) |
| Administrative and support and waste management services | 3.7% (40) | 5.6% (31) | 1.7% (9) |
| Social assistance | 2.9% (31) | 3.4% (19) | 2.3% (12) |
| Wood products | 2.9% (31) | 5.3% (29) | 0.4% (2) |
| Repair and maintenance | 2.9% (31) | 5.3% (29) | 0.4% (2) |
| Printing and related support activities | 2.4% (26) | 3.3% (18) | 1.5% (8) |
| Public administration | 2.4% (26) | 2.7% (15) | 2.1% (11) |
| Department and other general merchandise stores | 1.9% (21) | 1.1% (6) | 2.8% (15) |
| Food and beverage stores | 1.8% (20) | 0.9% (5) | 2.8% (15) |
| Groceries and related products merchant wholesalers | 1.7% (18) | 2.4% (13) | 0.9% (5) |
| Other transportation, and support activities, and couriers | 1.7% (18) | 2.7% (15) | 0.6% (3) |
| Personal and laundry services | 1.7% (18) | 0.4% (2) | 3.0% (16) |
| Truck transportation | 1.6% (17) | 3.1% (17) | 0.0% (0) |
| Building material and garden equipment and supplies dealers | 1.5% (16) | 2.5% (14) | 0.4% (2) |
| Professional, scientific, and technical services | 1.3% (14) | 1.1% (6) | 1.5% (8) |
| Religious, grantmaking, civic, professional, and similar organizations | 1.1% (12) | 0.5% (3) | 1.7% (9) |
| Plastics and rubber products | 1.0% (11) | 1.4% (8) | 0.6% (3) |
| Motor vehicle and parts dealers | 1.0% (11) | 0.9% (5) | 1.1% (6) |
| Pharmacies and drug stores | 0.9% (10) | 0.4% (2) | 1.5% (8) |
| Other direct selling establishments | 0.8% (9) | 0.4% (2) | 1.3% (7) |
| Computer and electronic products | 0.8% (9) | 0.4% (2) | 1.3% (7) |
| Nonmetallic mineral products | 0.7% (8) | 1.4% (8) | 0.0% (0) |
| Arts, entertainment, and recreation | 0.6% (7) | 0.9% (5) | 0.4% (2) |
| Electrical equipment, appliances, and components | 0.6% (7) | 0.5% (3) | 0.8% (4) |
| Fuel dealers | 0.6% (7) | 0.4% (2) | 0.9% (5) |
| Utilities | 0.6% (7) | 0.7% (4) | 0.6% (3) |
| Used merchandise, gift, novelty, and souvenir, and other miscellaneous stores | 0.6% (6) | 1.1% (6) | 0.0% (0) |
| Sporting goods, camera, and hobby and toy stores | 0.6% (6) | 0.4% (2) | 0.8% (4) |
| Real estate and rental and leasing | 0.6% (6) | 0.0% (0) | 1.1% (6) |
| U. S. Postal service | 0.6% (6) | 0.5% (3) | 0.6% (3) |
| Private households | 0.5% (5) | 0.0% (0) | 0.9% (5) |
| Agriculture, forestry, fishing and hunting | 0.5% (5) | 0.9% (5) | 0.0% (0) |
| Professional and commercial equipment and supplies merchant wholesalers | 0.5% (5) | 0.0% (0) | 0.9% (5) |
| Publishing, and motion picture and sound recording industries | 0.5% (5) | 0.0% (0) | 0.9% (5) |
| Food | 0.4% (4) | 0.7% (4) | 0.0% (0) |
| Lumber and other construction materials merchant wholesalers | 0.4% (4) | 0.4% (2) | 0.4% (2) |
| Vending machine operators | 0.4% (4) | 0.7% (4) | 0.0% (0) |
| Electronic shopping and mail-order houses | 0.3% (3) | 0.0% (0) | 0.6% (3) |
| Alcoholic beverages merchant wholesalers | 0.3% (3) | 0.5% (3) | 0.0% (0) |
| Apparel, fabrics, and notions merchant wholesalers | 0.2% (2) | 0.4% (2) | 0.0% (0) |
| Apparel | 0.2% (2) | 0.4% (2) | 0.0% (0) |
| Paper | 0.2% (2) | 0.0% (0) | 0.4% (2) |
| Transportation equipment | 0.2% (2) | 0.4% (2) | 0.0% (0) |
| Furniture and related product manufacturing | 0.2% (2) | 0.4% (2) | 0.0% (0) |
| Radio, TV, and computer stores | 0.2% (2) | 0.4% (2) | 0.0% (0) |
| Gasoline stations | 0.2% (2) | 0.4% (2) | 0.0% (0) |
| Clothing and accessories, including shoe, stores | 0.2% (2) | 0.0% (0) | 0.4% (2) |
| Petroleum and petroleum products merchant wholesalers | 0.2% (2) | 0.0% (0) | 0.4% (2) |
| Furniture and home furnishings, and household appliance stores | 0.2% (2) | 0.4% (2) | 0.0% (0) |
| Broadcasting and telecommunications | 0.2% (2) | 0.4% (2) | 0.0% (0) |
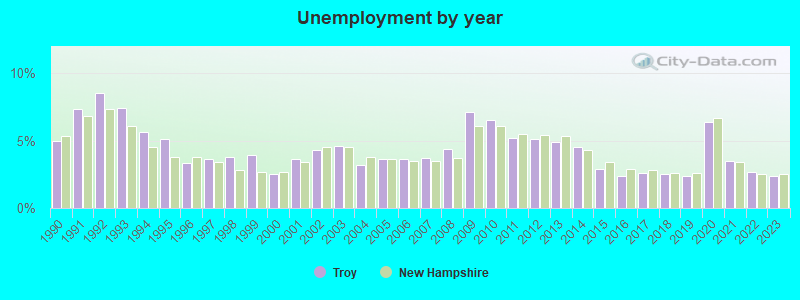
Unemployment in Troy
- Unemployment by race in 2000
- Unemployment rate for White non-Hispanic residents
- 2.5%Males
- 0.9%Females
Unemployment in 2023:
| Troy: | 2.4% |
| New Hampshire: | 2.5% |
Unemployment in 2022:
| Troy: | 2.7% |
| New Hampshire: | 2.5% |
Unemployment in 2021:
| Troy: | 3.5% |
| New Hampshire: | 3.4% |
Unemployment in 2020:
| Troy: | 6.4% |
| New Hampshire: | 6.7% |
Unemployment in 2019:
| Troy: | 2.4% |
| New Hampshire: | 2.6% |
Unemployment in 2018:
| Troy: | 2.5% |
| New Hampshire: | 2.6% |
Unemployment in 2017:
| Troy: | 2.6% |
| New Hampshire: | 2.8% |
Unemployment in 2016:
| Troy: | 2.4% |
| New Hampshire: | 2.9% |
Unemployment in 2015:
| Troy: | 2.9% |
| New Hampshire: | 3.4% |
Unemployment in 2014:
| Troy: | 4.5% |
| New Hampshire: | 4.3% |
Unemployment in 2013:
| Troy: | 4.9% |
| New Hampshire: | 5.3% |
Unemployment in 2012:
| Troy: | 5.1% |
| New Hampshire: | 5.4% |
Unemployment in 2011:
| Troy: | 5.2% |
| New Hampshire: | 5.5% |
Unemployment in 2010:
| Troy: | 6.5% |
| New Hampshire: | 6.1% |
Unemployment in 2009:
| Troy: | 7.1% |
| New Hampshire: | 6.1% |
Unemployment in 2008:
| Troy: | 4.4% |
| New Hampshire: | 3.7% |
Unemployment in 2007:
| Troy: | 3.7% |
| New Hampshire: | 3.5% |
Unemployment in 2006:
| Troy: | 3.6% |
| New Hampshire: | 3.5% |
Unemployment in 2005:
| Troy: | 3.6% |
| New Hampshire: | 3.6% |
Unemployment in 2004:
| Troy: | 3.2% |
| New Hampshire: | 3.8% |
Unemployment in 2003:
| Troy: | 4.6% |
| New Hampshire: | 4.5% |
Unemployment in 2002:
| Troy: | 4.3% |
| New Hampshire: | 4.5% |
Unemployment in 2001:
| Troy: | 3.6% |
| New Hampshire: | 3.4% |
Unemployment in 2000:
| Troy: | 2.5% |
| New Hampshire: | 2.7% |
Unemployment in 1999:
| Troy: | 3.9% |
| New Hampshire: | 2.7% |
Unemployment in 1998:
| Troy: | 3.8% |
| New Hampshire: | 2.8% |
Unemployment in 1997:
| Troy: | 3.6% |
| New Hampshire: | 3.4% |
Unemployment in 1996:
| Troy: | 3.3% |
| New Hampshire: | 3.8% |
Unemployment in 1995:
| Troy: | 5.1% |
| New Hampshire: | 3.8% |
Unemployment in 1994:
| Troy: | 5.6% |
| New Hampshire: | 4.5% |
Unemployment in 1993:
| Troy: | 7.4% |
| New Hampshire: | 6.1% |
Unemployment in 1992:
| Troy: | 8.5% |
| New Hampshire: | 7.3% |
Unemployment in 1991:
| Troy: | 7.3% |
| New Hampshire: | 6.8% |
Unemployment in 1990:
| Troy: | 5.0% |
| New Hampshire: | 5.3% |
Time leaving home to go to work
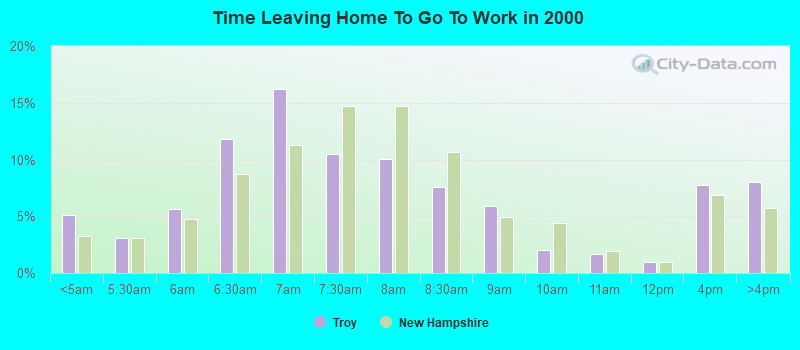
<5am:
| Troy: | 5.1% (55) |
| New Hampshire: | 3.3% (20,948) |
5:30am:
| Troy: | 3.1% (33) |
| New Hampshire: | 3.1% (19,529) |
6am:
| Troy: | 5.6% (60) |
| New Hampshire: | 4.8% (30,560) |
6:30am:
| Troy: | 11.8% (126) |
| New Hampshire: | 8.7% (55,574) |
7am:
| Troy: | 16.2% (174) |
| New Hampshire: | 11.3% (72,142) |
7:30am:
| Troy: | 10.5% (112) |
| New Hampshire: | 14.7% (93,945) |
8am:
| Troy: | 10.1% (108) |
| New Hampshire: | 14.7% (93,766) |
8:30am:
| Troy: | 7.6% (81) |
| New Hampshire: | 10.7% (68,355) |
9am:
| Troy: | 5.9% (63) |
| New Hampshire: | 4.9% (31,547) |
10am:
| Troy: | 2.1% (22) |
| New Hampshire: | 4.4% (28,251) |
11am:
| Troy: | 1.7% (18) |
| New Hampshire: | 1.9% (12,237) |
12pm:
| Troy: | 0.9% (10) |
| New Hampshire: | 0.9% (5,974) |
4pm:
| Troy: | 7.7% (83) |
| New Hampshire: | 6.8% (43,620) |
>4pm:
| Troy: | 8.0% (86) |
| New Hampshire: | 5.8% (36,810) |
Travel time to work
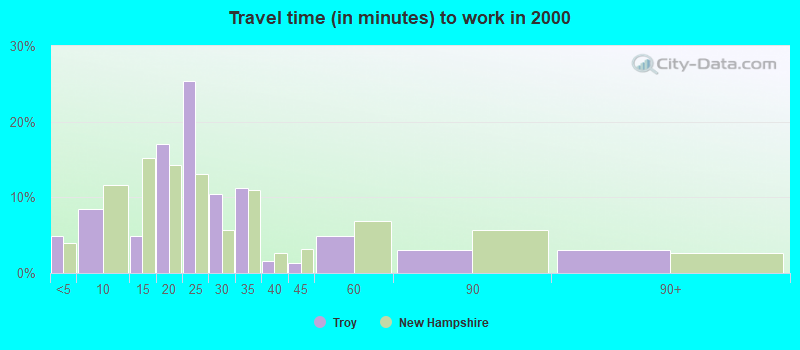
Less than 5 minutes:
| Troy: | 4.9% (52) |
| New Hampshire: | 3.9% (24,932) |
5 to 9 minutes:
| Troy: | 8.5% (91) |
| New Hampshire: | 11.7% (74,466) |
10 to 14 minutes:
| Troy: | 4.9% (52) |
| New Hampshire: | 15.2% (97,185) |
15 to 19 minutes:
| Troy: | 17.0% (182) |
| New Hampshire: | 14.3% (91,417) |
20 to 24 minutes:
| Troy: | 25.4% (272) |
| New Hampshire: | 13.1% (83,562) |
25 to 29 minutes:
| Troy: | 10.5% (112) |
| New Hampshire: | 5.7% (36,290) |
30 to 34 minutes:
| Troy: | 11.2% (120) |
| New Hampshire: | 10.9% (69,722) |
35 to 39 minutes:
| Troy: | 1.6% (17) |
| New Hampshire: | 2.7% (17,218) |
40 to 44 minutes:
| Troy: | 1.3% (14) |
| New Hampshire: | 3.2% (20,648) |
45 to 59 minutes:
| Troy: | 4.9% (53) |
| New Hampshire: | 6.9% (44,234) |
60 to 89 minutes:
| Troy: | 3.1% (33) |
| New Hampshire: | 5.7% (36,458) |
90 or more minutes:
| Troy: | 3.1% (33) |
| New Hampshire: | 2.7% (17,126) |
Means of transportation to work
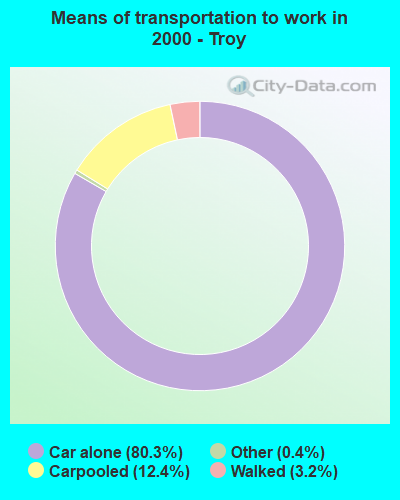
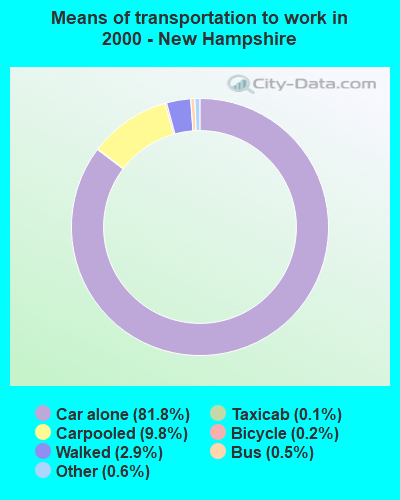
Drove car alone:
| Troy: | 80.3% (860) |
| New Hampshire: | 81.8% (522,043) |
Carpooled:
| Troy: | 12.4% (133) |
| New Hampshire: | 9.8% (62,763) |
Walked:
| Troy: | 3.2% (34) |
| New Hampshire: | 2.9% (18,545) |
Other means:
| Troy: | 0.4% (4) |
| New Hampshire: | 0.6% (3,656) |
Private vehicle occupancy
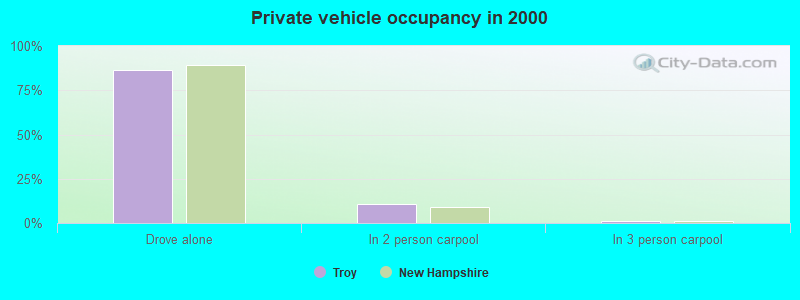
Drove alone:
| Troy: | 86.6% (860) |
| New Hampshire: | 89.3% (522,043) |
In 2 person carpool:
| Troy: | 10.8% (107) |
| New Hampshire: | 9.0% (52,861) |
In 3 person carpool:
| Troy: | 1.4% (14) |
| New Hampshire: | 1.2% (7,103) |
In 4 person carpool:
| Troy: | 0.5% (5) |
| New Hampshire: | 0.3% (1,588) |
In 5-6 person carpool:
| Troy: | 0.7% (7) |
| New Hampshire: | 0.1% (679) |
Class of workers
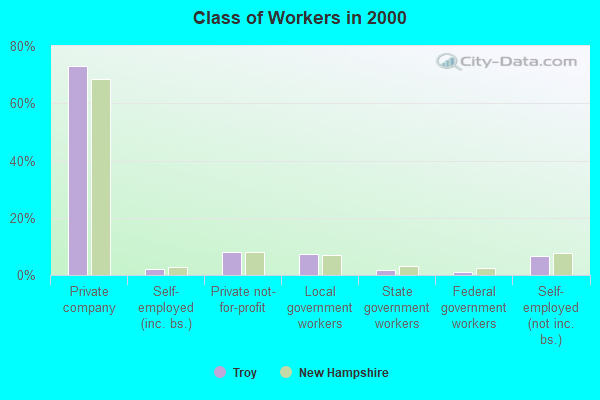
Employee of private company:
| Troy: | 73.1% (792) |
| New Hampshire: | 68.4% (445,255) |
Self-employed in own incorporated business:
| Troy: | 2.1% (23) |
| New Hampshire: | 2.9% (18,595) |
Private not-for-profit wage and salary workers:
| Troy: | 8.1% (88) |
| New Hampshire: | 8.1% (52,725) |
Local government workers:
| Troy: | 7.2% (78) |
| New Hampshire: | 7.2% (46,607) |
State government workers:
| Troy: | 1.8% (19) |
| New Hampshire: | 3.3% (21,558) |
Federal government workers:
| Troy: | 1.0% (11) |
| New Hampshire: | 2.3% (15,106) |
Self-employed workers in own not incorporated business:
| Troy: | 6.6% (72) |
| New Hampshire: | 7.6% (49,520) |
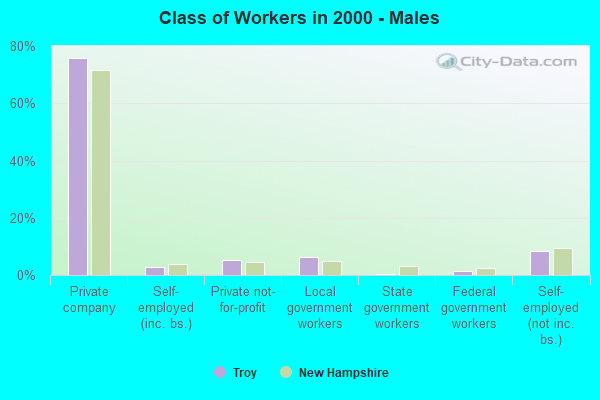
Employee of private company - Males:
| Troy: | 75.7% (418) |
| New Hampshire: | 71.5% (246,493) |
Self-employed in own incorporated business - Males:
| Troy: | 2.9% (16) |
| New Hampshire: | 4.0% (13,714) |
Private not-for-profit wage and salary workers - Males:
| Troy: | 5.1% (28) |
| New Hampshire: | 4.7% (16,096) |
Local government workers - Males:
| Troy: | 6.2% (34) |
| New Hampshire: | 4.8% (16,494) |
State government workers - Males:
| Troy: | 0.4% (2) |
| New Hampshire: | 3.0% (10,226) |
Federal government workers - Males:
| Troy: | 1.4% (8) |
| New Hampshire: | 2.6% (8,801) |
Self-employed workers in own not incorporated business - Males:
| Troy: | 8.3% (46) |
| New Hampshire: | 9.3% (32,158) |
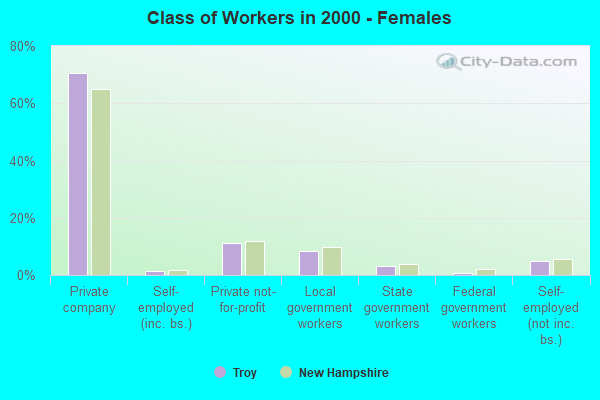
Employee of private company - Females:
| Troy: | 70.4% (374) |
| New Hampshire: | 64.9% (198,762) |
Self-employed in own incorporated business - Females:
| Troy: | 1.3% (7) |
| New Hampshire: | 1.6% (4,881) |
Private not-for-profit wage and salary workers - Females:
| Troy: | 11.3% (60) |
| New Hampshire: | 12.0% (36,629) |
Local government workers - Females:
| Troy: | 8.3% (44) |
| New Hampshire: | 9.8% (30,113) |
State government workers - Females:
| Troy: | 3.2% (17) |
| New Hampshire: | 3.7% (11,332) |
Federal government workers - Females:
| Troy: | 0.6% (3) |
| New Hampshire: | 2.1% (6,305) |
Self-employed workers in own not incorporated business - Females:
| Troy: | 4.9% (26) |
| New Hampshire: | 5.7% (17,362) |