Work and Jobs in Universal City, Texas (TX) Detailed Stats
Occupations, Industries, Unemployment, Workers, Commute
Settings
X


Recent posts about work in Universal City, Texas on our local forum with over 2,400,000 registered users:
 | Moving without a job lined up. Wdyt? (8 replies) |
| Job in Schertz - where to live with young kids? (3 replies) |
| DPS office on Babcock = rude worker/s (61 replies) |
| Considering moving my family of 5 to TX (from IL...) (25 replies) |
| Live oak, Selma, converse, universal city? (3 replies) |
| Thinking about moving to SA from Missouri.... advice please (12 replies) |
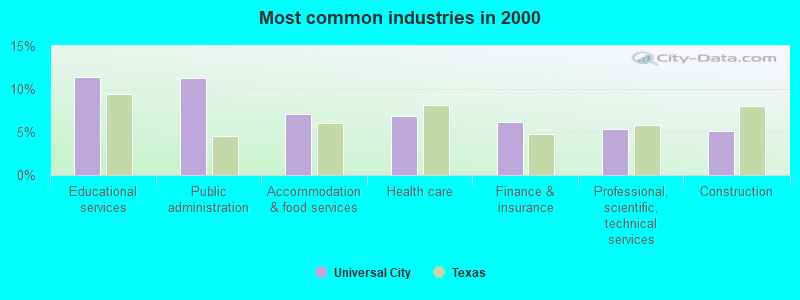
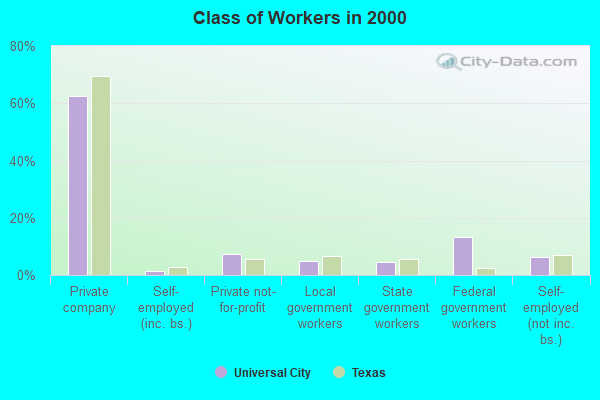
The most common industries in Universal City are: Educational services (11.4% of civilian employees), Public administration (11.3% of civilian employees), Accommodation & food services (7.1% of civilian employees). 83.5% of workers work in Bexar County and 5.8% of all workers work at home. 63.4% of workers are employees of private companies, which is 9.8% less than the rate of 69.6% across the entire state of Texas.
Whole page based on the data from 2000 / 2022 when the population of Universal City, Texas was 14,849 / 20,245
Whole page based on the data from 2000 / 2022 when the population of Universal City, Texas was 14,849 / 20,245
Most common industries
Most common industries | |||
|---|---|---|---|
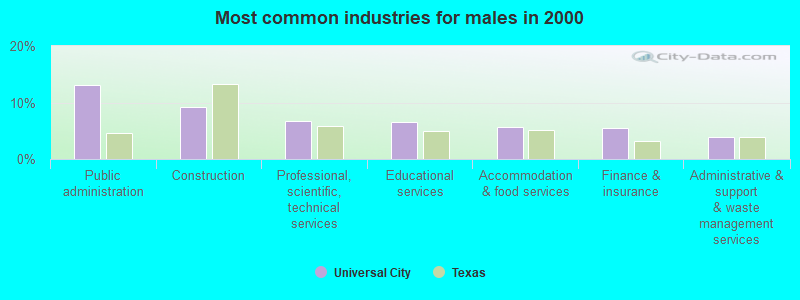
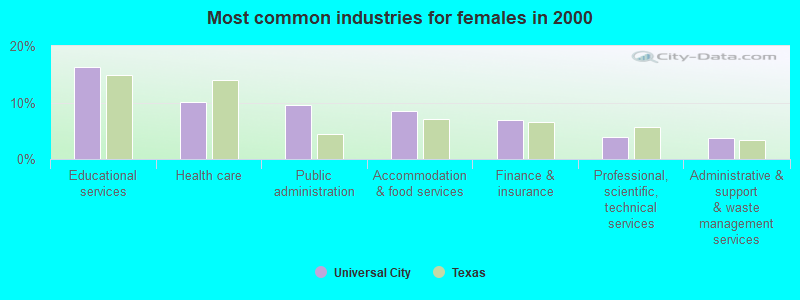
Industry | All | Males | Females |
| Educational services | 11.4% (820) | 6.6% (236) | 16.2% (584) |
| Public administration | 11.3% (811) | 13.0% (467) | 9.6% (344) |
| Accommodation and food services | 7.1% (513) | 5.7% (205) | 8.6% (308) |
| Health care | 6.9% (496) | 3.7% (132) | 10.1% (364) |
| Finance and insurance | 6.2% (446) | 5.5% (199) | 6.9% (247) |
| Professional, scientific, and technical services | 5.3% (382) | 6.7% (240) | 3.9% (142) |
| Construction | 5.1% (370) | 9.2% (331) | 1.1% (39) |
| Administrative and support and waste management services | 3.8% (271) | 3.9% (140) | 3.6% (131) |
| Food and beverage stores | 2.9% (205) | 2.9% (104) | 2.8% (101) |
| Broadcasting and telecommunications | 2.6% (185) | 3.3% (118) | 1.9% (67) |
| Truck transportation | 2.2% (155) | 2.7% (98) | 1.6% (57) |
| Department and other general merchandise stores | 2.1% (153) | 1.0% (35) | 3.3% (118) |
| Repair and maintenance | 2.1% (149) | 3.5% (126) | 0.6% (23) |
| Real estate and rental and leasing | 2.0% (147) | 1.2% (43) | 2.9% (104) |
| Other transportation, and support activities, and couriers | 1.6% (114) | 2.8% (99) | 0.4% (15) |
| Social assistance | 1.6% (112) | 0.0% (0) | 3.1% (112) |
| Religious, grantmaking, civic, professional, and similar organizations | 1.5% (107) | 1.3% (47) | 1.7% (60) |
| Building material and garden equipment and supplies dealers | 1.5% (105) | 2.1% (77) | 0.8% (28) |
| Motor vehicle and parts dealers | 1.4% (101) | 2.1% (77) | 0.7% (24) |
| U. S. Postal service | 1.2% (85) | 2.0% (70) | 0.4% (15) |
| Electronic shopping and mail-order houses | 1.2% (84) | 0.1% (4) | 2.2% (80) |
| Personal and laundry services | 1.2% (84) | 1.1% (40) | 1.2% (44) |
| Radio, TV, and computer stores | 0.9% (68) | 1.4% (49) | 0.5% (19) |
| Professional and commercial equipment and supplies merchant wholesalers | 0.9% (65) | 0.6% (21) | 1.2% (44) |
| Arts, entertainment, and recreation | 0.9% (63) | 0.4% (15) | 1.3% (48) |
| Miscellaneous manufacturing | 0.9% (63) | 0.6% (20) | 1.2% (43) |
| Used merchandise, gift, novelty, and souvenir, and other miscellaneous stores | 0.9% (63) | 0.3% (10) | 1.5% (53) |
| Utilities | 0.8% (58) | 1.3% (47) | 0.3% (11) |
| Metal and metal products | 0.8% (56) | 1.3% (48) | 0.2% (8) |
| Groceries and related products merchant wholesalers | 0.7% (52) | 0.5% (17) | 1.0% (35) |
| Transportation equipment | 0.7% (51) | 1.0% (36) | 0.4% (15) |
| Sporting goods, camera, and hobby and toy stores | 0.6% (45) | 0.7% (24) | 0.6% (21) |
| Miscellaneous nondurable goods merchant wholesalers | 0.6% (44) | 0.8% (27) | 0.5% (17) |
| Machinery, equipment, and supplies merchant wholesalers | 0.6% (44) | 1.2% (44) | 0.0% (0) |
| Pharmacies and drug stores | 0.6% (42) | 0.2% (8) | 0.9% (34) |
| Air transportation | 0.5% (38) | 0.6% (20) | 0.5% (18) |
| Textile mills and textile products | 0.5% (38) | 0.4% (16) | 0.6% (22) |
| Computer and electronic products | 0.5% (36) | 0.9% (31) | 0.1% (5) |
| Machinery | 0.4% (28) | 0.8% (28) | 0.0% (0) |
| Other direct selling establishments | 0.4% (27) | 0.2% (7) | 0.6% (20) |
| Water transportation | 0.4% (26) | 0.7% (26) | 0.0% (0) |
| Nonmetallic mineral products | 0.4% (26) | 0.5% (18) | 0.2% (8) |
| Food | 0.3% (24) | 0.1% (2) | 0.6% (22) |
| Data processing, libraries, and other information services | 0.3% (24) | 0.3% (12) | 0.3% (12) |
| Furniture and home furnishings, and household appliance stores | 0.3% (23) | 0.1% (5) | 0.5% (18) |
| Furniture and home furnishing merchant wholesalers | 0.3% (22) | 0.3% (12) | 0.3% (10) |
| Health and personal care, except drug, stores | 0.3% (22) | 0.1% (5) | 0.5% (17) |
| Clothing and accessories, including shoe, stores | 0.3% (21) | 0.0% (1) | 0.6% (20) |
| Rail transportation | 0.3% (20) | 0.6% (20) | 0.0% (0) |
| Gasoline stations | 0.3% (18) | 0.0% (0) | 0.5% (18) |
| Paper and paper products merchant wholesalers | 0.2% (17) | 0.3% (10) | 0.2% (7) |
| Printing and related support activities | 0.2% (16) | 0.3% (12) | 0.1% (4) |
| Office supplies and stationery stores | 0.2% (14) | 0.4% (14) | 0.0% (0) |
| Leather and allied products | 0.2% (11) | 0.3% (11) | 0.0% (0) |
| Publishing, and motion picture and sound recording industries | 0.2% (11) | 0.1% (5) | 0.2% (6) |
| Furniture and related product manufacturing | 0.1% (10) | 0.3% (10) | 0.0% (0) |
| Chemicals | 0.1% (9) | 0.3% (9) | 0.0% (0) |
| Mining, quarrying, and oil and gas extraction | 0.1% (8) | 0.2% (8) | 0.0% (0) |
| Jewelry, luggage, and leather goods stores | 0.1% (8) | 0.0% (0) | 0.2% (8) |
| Beverage and tobacco products | 0.1% (8) | 0.1% (5) | 0.1% (3) |
| Hardware, plumbing and heating equipment, and supplies merchant wholesalers | 0.1% (8) | 0.2% (8) | 0.0% (0) |
| Wood products | 0.1% (7) | 0.2% (7) | 0.0% (0) |
| Warehousing and storage | 0.1% (6) | 0.2% (6) | 0.0% (0) |
| Book stores and news dealers | 0.1% (6) | 0.2% (6) | 0.0% (0) |
| Music stores | 0.1% (6) | 0.2% (6) | 0.0% (0) |
| Electrical and electronic goods merchant wholesalers | 0.1% (6) | 0.2% (6) | 0.0% (0) |
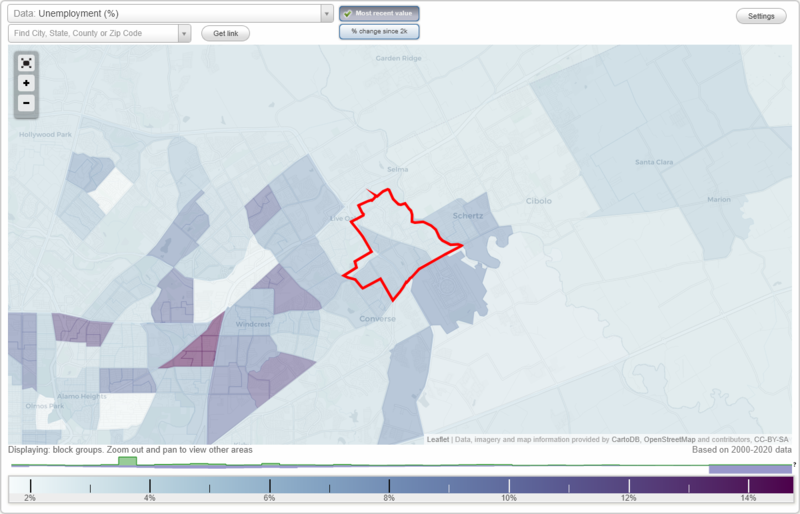
Unemployment in Universal City
- Unemployment by race in 2022
- Unemployment rate for White non-Hispanic residents
- 1.3%Males
- 6.0%Females
- Unemployment rate for Black residents
- 1.9%Females
- Unemployment rate for two or more race residents
- 14.0%Males
- 6.6%Females
- Unemployment rate for Hispanic or Latino residents
- 5.6%Males
- 5.1%Females
- Unemployment by race in 2000
- Unemployment rate for White non-Hispanic residents
- 3.6%Males
- 3.0%Females
- Unemployment rate for Black residents
- 2.7%Males
- Unemployment rate for other race residents
- 5.2%Females
- Unemployment rate for two or more race residents
- 10.9%Females
- Unemployment rate for Hispanic or Latino residents
- 5.0%Males
- 3.8%Females
Time leaving home to go to work
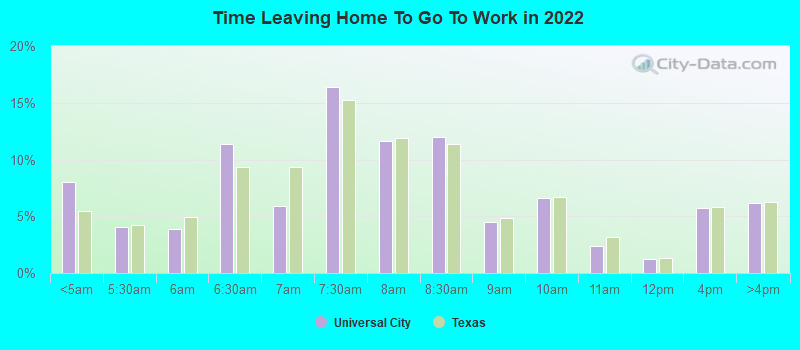
12:00 a.m. to 4:59 a.m.:
| Universal City: | 8.0% (742) |
| Texas: | 5.5% (678,264) |
5:00 a.m. to 5:29 a.m.:
| Universal City: | 4.0% (372) |
| Texas: | 4.3% (525,841) |
5:30 a.m. to 5:59 a.m.:
| Universal City: | 3.9% (361) |
| Texas: | 4.9% (603,953) |
6:00 a.m. to 6:29 a.m.:
| Universal City: | 11.4% (1,054) |
| Texas: | 9.4% (1,155,020) |
6:30 a.m. to 6:59 a.m.:
| Universal City: | 5.9% (551) |
| Texas: | 9.3% (1,152,822) |
7:00 a.m. to 7:29 a.m.:
| Universal City: | 16.4% (1,520) |
| Texas: | 15.3% (1,885,477) |
7:30 a.m. to 7:59 a.m.:
| Universal City: | 11.6% (1,075) |
| Texas: | 11.9% (1,469,628) |
8:00 a.m. to 8:29 a.m.:
| Universal City: | 12.0% (1,109) |
| Texas: | 11.3% (1,400,175) |
8:30 a.m. to 8:59 a.m.:
| Universal City: | 4.5% (417) |
| Texas: | 4.9% (599,574) |
9:00 a.m. to 9:59 a.m.:
| Universal City: | 6.6% (614) |
| Texas: | 6.7% (829,367) |
10:00 a.m. to 10:59 a.m.:
| Universal City: | 2.4% (223) |
| Texas: | 3.2% (390,354) |
11:00 a.m. to 11:59 a.m.:
| Universal City: | 1.3% (118) |
| Texas: | 1.3% (162,330) |
12:00 p.m. to 3:59 p.m.:
| Universal City: | 5.8% (535) |
| Texas: | 5.8% (720,594) |
4:00 p.m. to 11:59 p.m.:
| Universal City: | 6.2% (573) |
| Texas: | 6.3% (777,072) |
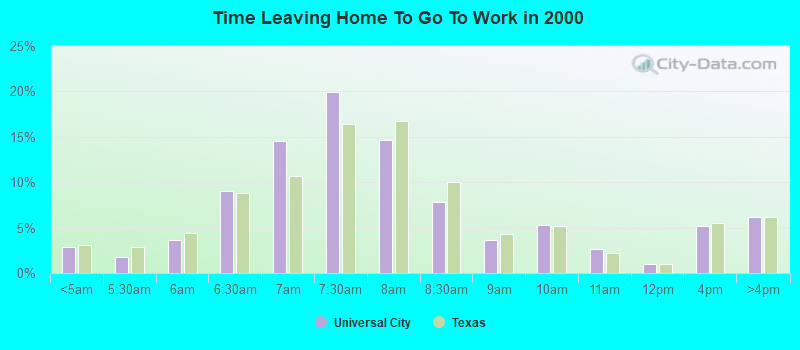
<5am:
| Universal City: | 2.8% (215) |
| Texas: | 3.1% (281,361) |
5:30am:
| Universal City: | 1.8% (137) |
| Texas: | 2.9% (262,060) |
6am:
| Universal City: | 3.6% (274) |
| Texas: | 4.4% (403,423) |
6:30am:
| Universal City: | 9.1% (684) |
| Texas: | 8.8% (808,876) |
7am:
| Universal City: | 14.6% (1,100) |
| Texas: | 10.7% (976,557) |
7:30am:
| Universal City: | 19.9% (1,503) |
| Texas: | 16.4% (1,500,904) |
8am:
| Universal City: | 14.6% (1,104) |
| Texas: | 16.8% (1,536,308) |
8:30am:
| Universal City: | 7.8% (590) |
| Texas: | 10.0% (913,601) |
9am:
| Universal City: | 3.6% (275) |
| Texas: | 4.4% (398,656) |
10am:
| Universal City: | 5.3% (403) |
| Texas: | 5.2% (472,592) |
11am:
| Universal City: | 2.6% (197) |
| Texas: | 2.2% (197,844) |
12pm:
| Universal City: | 1.0% (73) |
| Texas: | 0.9% (86,997) |
4pm:
| Universal City: | 5.1% (389) |
| Texas: | 5.5% (503,565) |
>4pm:
| Universal City: | 6.1% (464) |
| Texas: | 6.1% (563,107) |
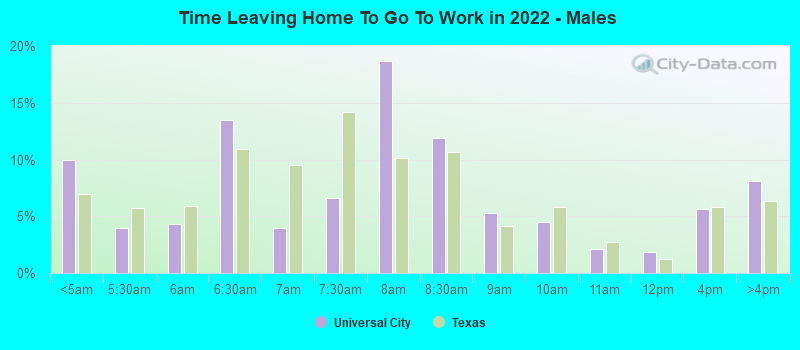
12:00 a.m. to 4:59 a.m. - Males:
| Universal City: | 9.9% (511) |
| Texas: | 7.0% (477,284) |
5:00 a.m. to 5:29 a.m. - Males:
| Universal City: | 3.9% (202) |
| Texas: | 5.8% (394,876) |
5:30 a.m. to 5:59 a.m. - Males:
| Universal City: | 4.3% (223) |
| Texas: | 5.9% (402,788) |
6:00 a.m. to 6:29 a.m. - Males:
| Universal City: | 13.5% (693) |
| Texas: | 10.9% (751,118) |
6:30 a.m. to 6:59 a.m. - Males:
| Universal City: | 4.0% (205) |
| Texas: | 9.5% (652,306) |
7:00 a.m. to 7:29 a.m. - Males:
| Universal City: | 6.6% (339) |
| Texas: | 14.1% (970,598) |
7:30 a.m. to 7:59 a.m. - Males:
| Universal City: | 18.7% (961) |
| Texas: | 10.2% (696,429) |
8:00 a.m. to 8:29 a.m. - Males:
| Universal City: | 11.9% (613) |
| Texas: | 10.6% (729,041) |
8:30 a.m. to 8:59 a.m. - Males:
| Universal City: | 5.3% (270) |
| Texas: | 4.1% (281,762) |
9:00 a.m. to 9:59 a.m. - Males:
| Universal City: | 4.5% (232) |
| Texas: | 5.8% (401,071) |
10:00 a.m. to 10:59 a.m. - Males:
| Universal City: | 2.1% (108) |
| Texas: | 2.7% (186,469) |
11:00 a.m. to 11:59 a.m. - Males:
| Universal City: | 1.8% (95) |
| Texas: | 1.2% (82,242) |
12:00 p.m. to 3:59 p.m. - Males:
| Universal City: | 5.6% (287) |
| Texas: | 5.8% (397,795) |
4:00 p.m. to 11:59 p.m. - Males:
| Universal City: | 8.1% (418) |
| Texas: | 6.4% (435,950) |
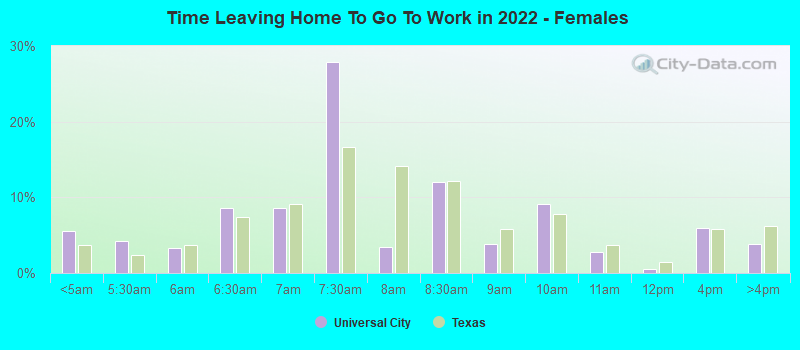
12:00 a.m. to 4:59 a.m. - Females:
| Universal City: | 5.6% (232) |
| Texas: | 3.7% (200,980) |
5:00 a.m. to 5:29 a.m. - Females:
| Universal City: | 4.2% (174) |
| Texas: | 2.4% (130,965) |
5:30 a.m. to 5:59 a.m. - Females:
| Universal City: | 3.2% (134) |
| Texas: | 3.7% (201,165) |
6:00 a.m. to 6:29 a.m. - Females:
| Universal City: | 8.6% (357) |
| Texas: | 7.4% (403,902) |
6:30 a.m. to 6:59 a.m. - Females:
| Universal City: | 8.5% (353) |
| Texas: | 9.1% (500,516) |
7:00 a.m. to 7:29 a.m. - Females:
| Universal City: | 27.9% (1,155) |
| Texas: | 16.7% (914,879) |
7:30 a.m. to 7:59 a.m. - Females:
| Universal City: | 3.4% (141) |
| Texas: | 14.1% (773,199) |
8:00 a.m. to 8:29 a.m. - Females:
| Universal City: | 12.0% (497) |
| Texas: | 12.2% (671,134) |
8:30 a.m. to 8:59 a.m. - Females:
| Universal City: | 3.8% (159) |
| Texas: | 5.8% (317,812) |
9:00 a.m. to 9:59 a.m. - Females:
| Universal City: | 9.2% (379) |
| Texas: | 7.8% (428,296) |
10:00 a.m. to 10:59 a.m. - Females:
| Universal City: | 2.8% (115) |
| Texas: | 3.7% (203,885) |
11:00 a.m. to 11:59 a.m. - Females:
| Universal City: | 0.5% (19) |
| Texas: | 1.5% (80,088) |
12:00 p.m. to 3:59 p.m. - Females:
| Universal City: | 6.0% (248) |
| Texas: | 5.9% (322,799) |
4:00 p.m. to 11:59 p.m. - Females:
| Universal City: | 3.8% (159) |
| Texas: | 6.2% (341,122) |
Travel time to work
Percentage of workers working in this county: 83.5%
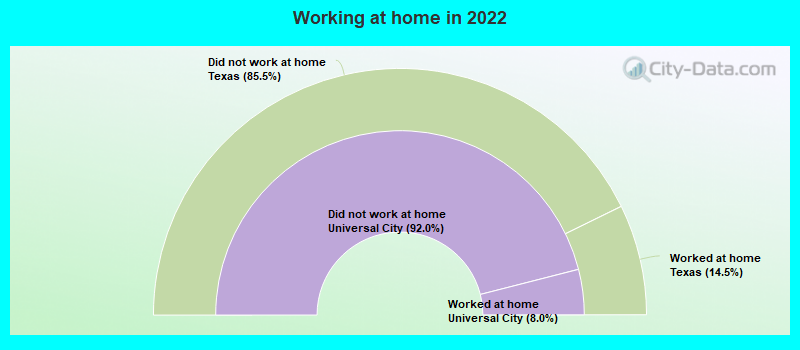
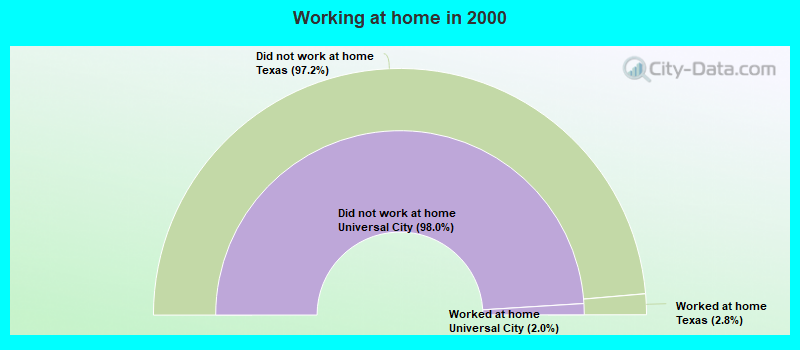
Number of people working at home: 595 (5.8% of all workers)
Daytime population change due to commuting: -1,861 (-12.5%)
Workers who live and work in this city: 1,128 (14.9%)
Number of people working at home: 595 (5.8% of all workers)
Daytime population change due to commuting: -1,861 (-12.5%)
Workers who live and work in this city: 1,128 (14.9%)
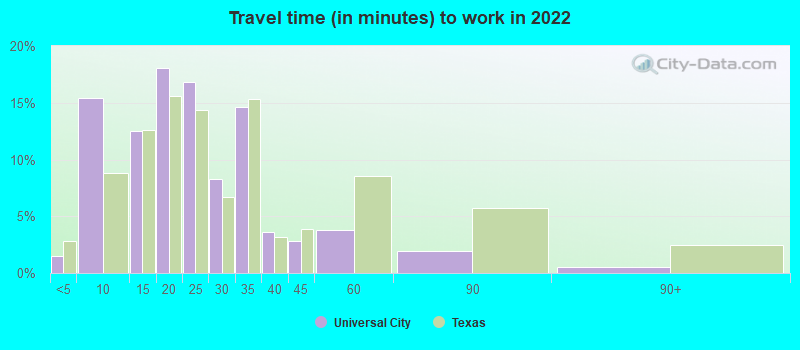
Less than 5 minutes:
| Universal City: | 1.5% (69) |
| Texas: | 2.8% (350,462) |
5 to 9 minutes:
| Universal City: | 15.4% (715) |
| Texas: | 8.8% (1,087,762) |
10 to 14 minutes:
| Universal City: | 12.5% (581) |
| Texas: | 12.6% (1,550,271) |
15 to 19 minutes:
| Universal City: | 18.0% (838) |
| Texas: | 15.6% (1,918,353) |
20 to 24 minutes:
| Universal City: | 16.9% (783) |
| Texas: | 14.4% (1,772,079) |
25 to 29 minutes:
| Universal City: | 8.3% (387) |
| Texas: | 6.7% (827,833) |
30 to 34 minutes:
| Universal City: | 14.6% (680) |
| Texas: | 15.3% (1,887,878) |
35 to 39 minutes:
| Universal City: | 3.6% (168) |
| Texas: | 3.2% (394,170) |
40 to 44 minutes:
| Universal City: | 2.8% (129) |
| Texas: | 3.9% (476,118) |
45 to 59 minutes:
| Universal City: | 3.8% (175) |
| Texas: | 8.6% (1,058,376) |
60 to 89 minutes:
| Universal City: | 2.0% (91) |
| Texas: | 5.7% (706,002) |
90 or more minutes:
| Universal City: | 0.5% (23) |
| Texas: | 2.4% (299,884) |
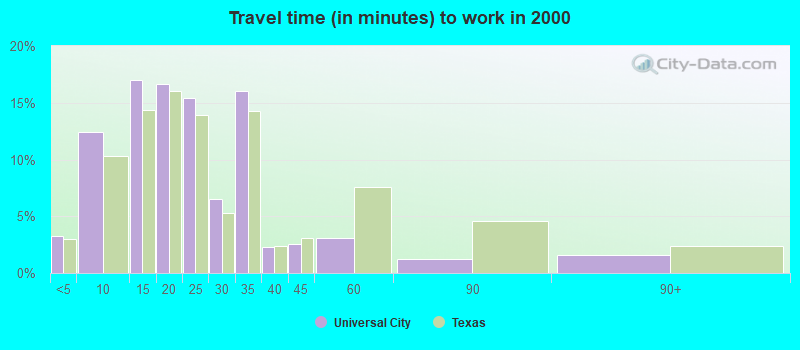
Less than 5 minutes:
| Universal City: | 3.3% (247) |
| Texas: | 3.0% (277,642) |
5 to 9 minutes:
| Universal City: | 12.4% (937) |
| Texas: | 10.3% (942,891) |
10 to 14 minutes:
| Universal City: | 17.0% (1,284) |
| Texas: | 14.4% (1,317,555) |
15 to 19 minutes:
| Universal City: | 16.6% (1,258) |
| Texas: | 16.0% (1,467,945) |
20 to 24 minutes:
| Universal City: | 15.4% (1,163) |
| Texas: | 13.9% (1,276,781) |
25 to 29 minutes:
| Universal City: | 6.5% (494) |
| Texas: | 5.3% (482,838) |
30 to 34 minutes:
| Universal City: | 16.0% (1,212) |
| Texas: | 14.3% (1,309,699) |
35 to 39 minutes:
| Universal City: | 2.3% (173) |
| Texas: | 2.4% (219,873) |
40 to 44 minutes:
| Universal City: | 2.5% (192) |
| Texas: | 3.1% (280,916) |
45 to 59 minutes:
| Universal City: | 3.1% (236) |
| Texas: | 7.6% (692,006) |
60 to 89 minutes:
| Universal City: | 1.2% (92) |
| Texas: | 4.6% (418,905) |
90 or more minutes:
| Universal City: | 1.6% (120) |
| Texas: | 2.4% (218,800) |
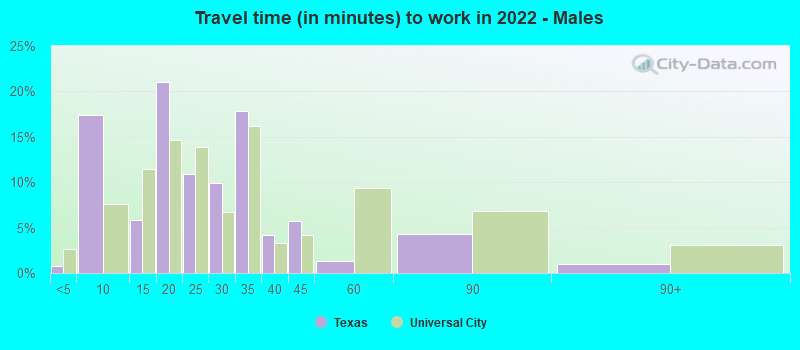
Less than 5 minutes - Males:
| Universal City: | 0.7% (16) |
| Texas: | 2.7% (181,937) |
5 to 9 minutes - Males:
| Universal City: | 17.4% (390) |
| Texas: | 7.6% (522,166) |
10 to 14 minutes - Males:
| Universal City: | 5.9% (132) |
| Texas: | 11.5% (785,572) |
15 to 19 minutes - Males:
| Universal City: | 21.0% (471) |
| Texas: | 14.6% (1,001,179) |
20 to 24 minutes - Males:
| Universal City: | 10.9% (244) |
| Texas: | 13.9% (950,043) |
25 to 29 minutes - Males:
| Universal City: | 9.9% (221) |
| Texas: | 6.7% (457,259) |
30 to 34 minutes - Males:
| Universal City: | 17.9% (401) |
| Texas: | 16.2% (1,110,357) |
35 to 39 minutes - Males:
| Universal City: | 4.2% (94) |
| Texas: | 3.3% (223,512) |
40 to 44 minutes - Males:
| Universal City: | 5.7% (128) |
| Texas: | 4.2% (289,434) |
45 to 59 minutes - Males:
| Universal City: | 1.3% (29) |
| Texas: | 9.3% (639,122) |
60 to 89 minutes - Males:
| Universal City: | 4.3% (96) |
| Texas: | 6.8% (467,154) |
90 or more minutes - Males:
| Universal City: | 1.0% (22) |
| Texas: | 3.1% (211,313) |
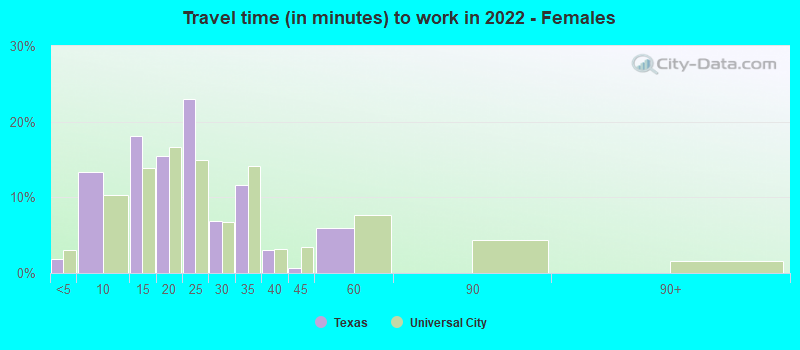
Less than 5 minutes - Females:
| Universal City: | 1.8% (43) |
| Texas: | 3.1% (168,525) |
5 to 9 minutes - Females:
| Universal City: | 13.4% (320) |
| Texas: | 10.3% (565,596) |
10 to 14 minutes - Females:
| Universal City: | 18.1% (432) |
| Texas: | 13.9% (764,699) |
15 to 19 minutes - Females:
| Universal City: | 15.5% (369) |
| Texas: | 16.7% (917,174) |
20 to 24 minutes - Females:
| Universal City: | 23.0% (550) |
| Texas: | 15.0% (822,036) |
25 to 29 minutes - Females:
| Universal City: | 6.9% (165) |
| Texas: | 6.7% (370,574) |
30 to 34 minutes - Females:
| Universal City: | 11.6% (278) |
| Texas: | 14.2% (777,521) |
35 to 39 minutes - Females:
| Universal City: | 3.1% (73) |
| Texas: | 3.1% (170,658) |
40 to 44 minutes - Females:
| Universal City: | 0.6% (15) |
| Texas: | 3.4% (186,684) |
45 to 59 minutes - Females:
| Universal City: | 6.0% (143) |
| Texas: | 7.6% (419,254) |
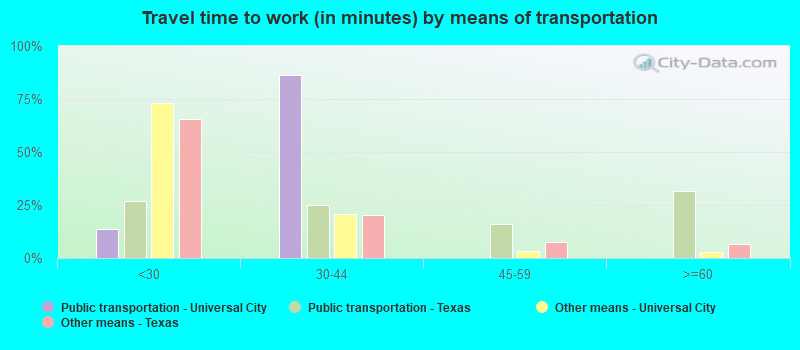
Means of transportation to work
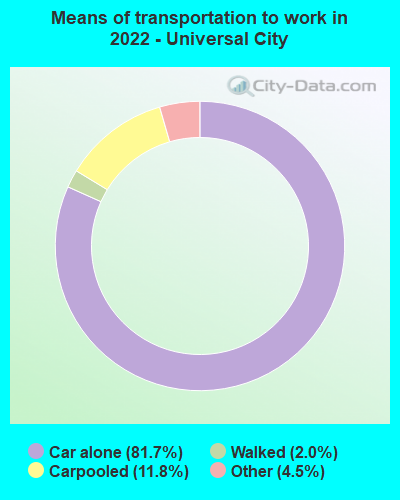

Drove car alone:
| Universal City: | 81.7% (3,964) |
| Texas: | 83.3% (4,557,023) |
Carpooled:
| Universal City: | 11.8% (574) |
| Texas: | 11.7% (674,818) |
Walked:
| Universal City: | 2.0% (99) |
| Texas: | 1.7% (99,911) |
Other means:
| Universal City: | 4.5% (217) |
| Texas: | 2.0% (95,481) |
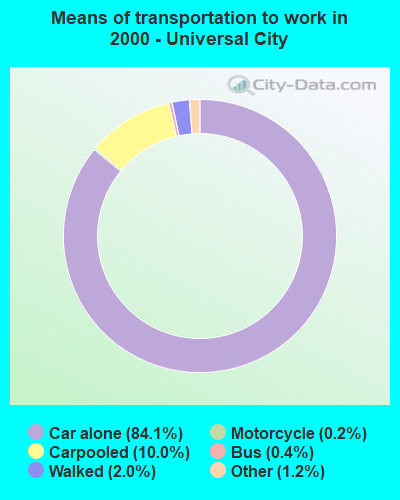

Drove car alone:
| Universal City: | 84.1% (6,355) |
| Texas: | 77.7% (7,115,590) |
Carpooled:
| Universal City: | 10.0% (757) |
| Texas: | 14.5% (1,326,012) |
Bus or trolley bus:
| Universal City: | 0.4% (29) |
| Texas: | 1.7% (157,014) |
Taxicab:
| Universal City: | 0.1% (7) |
| Texas: | 0.1% (6,102) |
Motorcycle:
| Universal City: | 0.2% (14) |
| Texas: | 0.1% (12,068) |
Bicycle:
| Universal City: | 0.1% (7) |
| Texas: | 0.2% (21,551) |
Walked:
| Universal City: | 2.0% (151) |
| Texas: | 1.9% (173,670) |
Other means:
| Universal City: | 1.2% (88) |
| Texas: | 0.9% (86,692) |
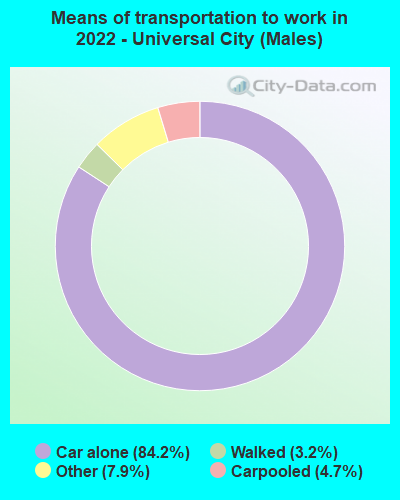

Drove car alone - Males:
| Universal City: | 84.2% (1,958) |
| Texas: | 83.6% (4,557,023) |
Carpooled - Males:
| Universal City: | 4.7% (110) |
| Texas: | 11.2% (674,818) |
Walked - Males:
| Universal City: | 3.2% (75) |
| Texas: | 1.7% (99,911) |
Other means - Males:
| Universal City: | 7.9% (184) |
| Texas: | 2.2% (95,481) |
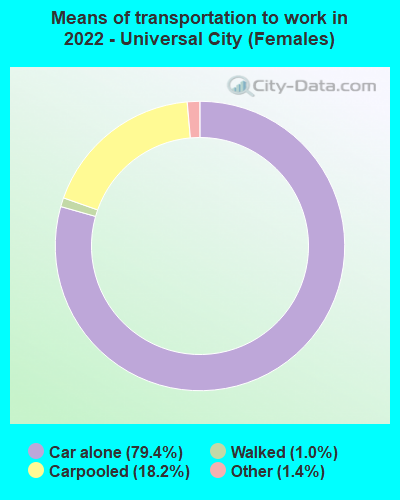

Drove car alone - Females:
| Universal City: | 79.4% (2,001) |
| Texas: | 83.0% (4,557,023) |
Carpooled - Females:
| Universal City: | 18.2% (460) |
| Texas: | 12.3% (674,818) |
Walked - Females:
| Universal City: | 1.0% (25) |
| Texas: | 1.8% (99,911) |
Other means - Females:
| Universal City: | 1.4% (35) |
| Texas: | 1.7% (95,481) |
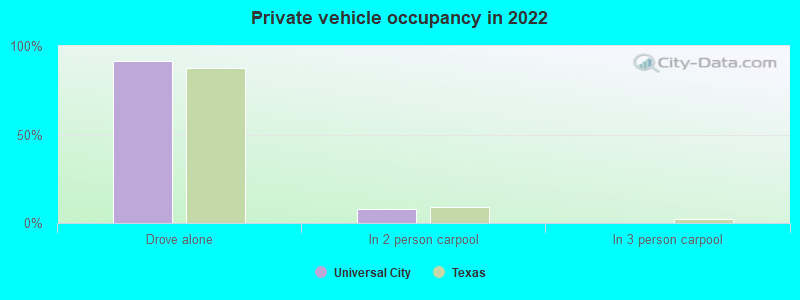
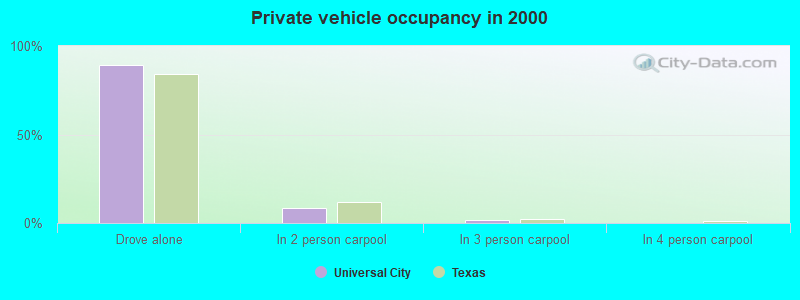
Private vehicle occupancy
Drove alone:
| Universal City: | 91.3% (8,108) |
| Texas: | 87.6% (10,283,021) |
In 2 person carpool:
| Universal City: | 8.1% (719) |
| Texas: | 9.0% (1,052,595) |
In 4 person carpool:
| Universal City: | 0.2% (17) |
| Texas: | 0.8% (92,732) |
Drove alone:
| Universal City: | 89.4% (6,355) |
| Texas: | 84.3% (7,115,590) |
In 2 person carpool:
| Universal City: | 8.3% (593) |
| Texas: | 11.6% (982,994) |
In 3 person carpool:
| Universal City: | 1.6% (117) |
| Texas: | 2.4% (201,602) |
In 4 person carpool:
| Universal City: | 0.2% (14) |
| Texas: | 1.0% (83,518) |
In 5-6 person carpool:
| Universal City: | 0.2% (17) |
| Texas: | 0.5% (40,662) |
In 7+ person carpool:
| Universal City: | 0.2% (16) |
| Texas: | 0.2% (17,236) |
Class of workers

Employee of private company:
| Universal City: | 63.4% (6,459) |
| Texas: | 69.6% (10,139,666) |
Self-employed in own incorporated business:
| Universal City: | 2.6% (265) |
| Texas: | 3.5% (516,446) |
Private not-for-profit wage and salary workers:
| Universal City: | 5.2% (531) |
| Texas: | 6.0% (870,454) |
Local government workers:
| Universal City: | 9.8% (999) |
| Texas: | 7.6% (1,109,799) |
State government workers:
| Universal City: | 3.1% (314) |
| Texas: | 3.8% (558,618) |
Federal government workers:
| Universal City: | 9.6% (982) |
| Texas: | 2.5% (357,298) |
Self-employed workers in own not incorporated business:
| Universal City: | 5.7% (584) |
| Texas: | 6.8% (998,270) |
Unpaid family workers:
| Universal City: | 0.6% (58) |
| Texas: | 0.2% (27,882) |
Employee of private company:
| Universal City: | 62.4% (4,487) |
| Texas: | 69.6% (6,425,274) |
Self-employed in own incorporated business:
| Universal City: | 1.3% (92) |
| Texas: | 2.7% (250,864) |
Private not-for-profit wage and salary workers:
| Universal City: | 7.3% (526) |
| Texas: | 5.7% (526,631) |
Local government workers:
| Universal City: | 4.7% (339) |
| Texas: | 6.6% (608,479) |
State government workers:
| Universal City: | 4.7% (337) |
| Texas: | 5.4% (501,082) |
Federal government workers:
| Universal City: | 13.1% (944) |
| Texas: | 2.6% (237,177) |
Self-employed workers in own not incorporated business:
| Universal City: | 6.2% (449) |
| Texas: | 7.1% (653,527) |
Unpaid family workers:
| Universal City: | 0.2% (13) |
| Texas: | 0.3% (31,338) |
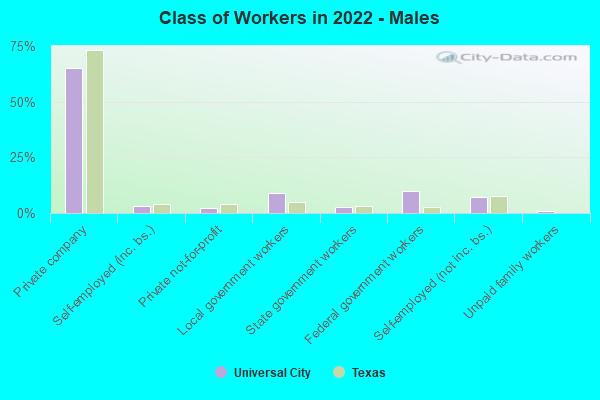
Employee of private company - Males:
| Universal City: | 64.9% (3,552) |
| Texas: | 73.1% (5,788,450) |
Self-employed in own incorporated business - Males:
| Universal City: | 3.2% (173) |
| Texas: | 4.2% (332,655) |
Private not-for-profit wage and salary workers - Males:
| Universal City: | 2.5% (135) |
| Texas: | 4.1% (323,476) |
Local government workers - Males:
| Universal City: | 8.8% (483) |
| Texas: | 5.1% (405,467) |
State government workers - Males:
| Universal City: | 2.5% (137) |
| Texas: | 3.0% (236,706) |
Federal government workers - Males:
| Universal City: | 10.0% (546) |
| Texas: | 2.7% (211,629) |
Self-employed workers in own not incorporated business - Males:
| Universal City: | 7.1% (389) |
| Texas: | 7.7% (609,246) |
Unpaid family workers - Males:
| Universal City: | 1.1% (58) |
| Texas: | 0.2% (12,606) |
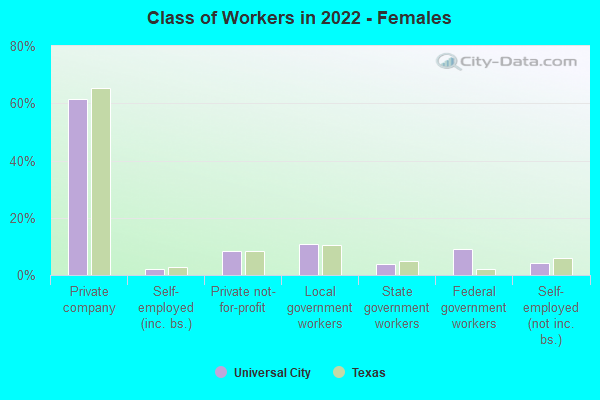
Employee of private company - Females:
| Universal City: | 61.6% (2,907) |
| Texas: | 65.4% (4,351,216) |
Self-employed in own incorporated business - Females:
| Universal City: | 2.0% (92) |
| Texas: | 2.8% (183,791) |
Private not-for-profit wage and salary workers - Females:
| Universal City: | 8.4% (396) |
| Texas: | 8.2% (546,978) |
Local government workers - Females:
| Universal City: | 10.9% (516) |
| Texas: | 10.6% (704,332) |
State government workers - Females:
| Universal City: | 3.8% (177) |
| Texas: | 4.8% (321,912) |
Federal government workers - Females:
| Universal City: | 9.2% (435) |
| Texas: | 2.2% (145,669) |
Self-employed workers in own not incorporated business - Females:
| Universal City: | 4.1% (195) |
| Texas: | 5.8% (389,024) |