Latest news about work in Utica, PA collected exclusively by city-data.com from local newspapers, TV, and radio stations
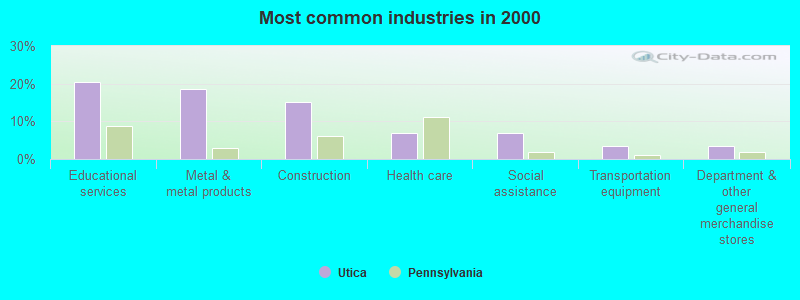
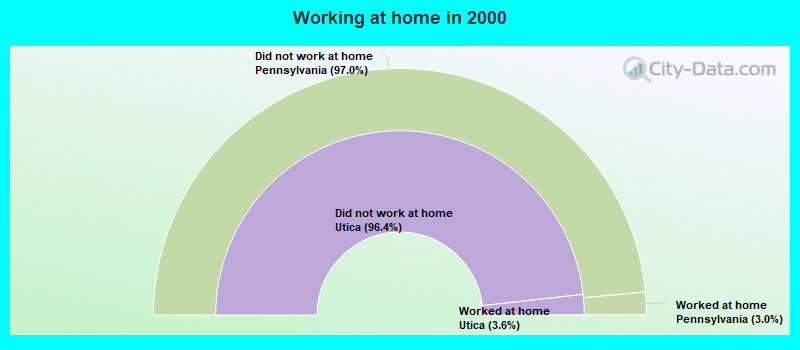
The most common industries in Utica are: Educational services (20.3% of civilian employees), Metal & metal products (18.6% of civilian employees), Construction (15.3% of civilian employees). 49.2% of workers work in Venango County and 3.4% of all workers work at home. 75.0% of workers are employees of private companies, which is 9.7% greater than the rate of 67.7% across the entire state of Pennsylvania.
Whole page based on the data from 2000 / 2022 when the population of Utica, Pennsylvania was 211 / 123
Most common industries
Most common industries
Industry
All
Males
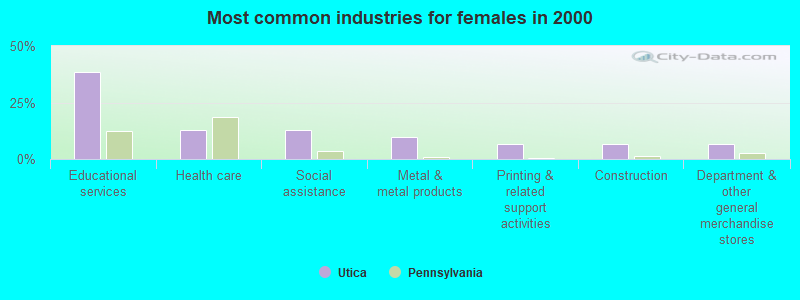
Females
Educational services
20.3% (12)
0.0% (0)
38.7% (12)
Metal and metal products
18.6% (11)
28.6% (8)
9.7% (3)
Construction
15.3% (9)
25.0% (7)
6.5% (2)
Health care
6.8% (4)
0.0% (0)
12.9% (4)
Social assistance
6.8% (4)
0.0% (0)
12.9% (4)
Transportation equipment
3.4% (2)
7.1% (2)
0.0% (0)
Department and other general merchandise stores
3.4% (2)
0.0% (0)
6.5% (2)
Printing and related support activities
3.4% (2)
0.0% (0)
6.5% (2)
Public administration
3.4% (2)
7.1% (2)
0.0% (0)
Machinery
3.4% (2)
7.1% (2)
0.0% (0)
Food and beverage stores
3.4% (2)
7.1% (2)
0.0% (0)
Truck transportation
3.4% (2)
7.1% (2)
0.0% (0)
Arts, entertainment, and recreation
3.4% (2)
0.0% (0)
6.5% (2)
Accommodation and food services
3.4% (2)
7.1% (2)
0.0% (0)
Administrative and support and waste management services
1.7% (1)
3.6% (1)
0.0% (0)
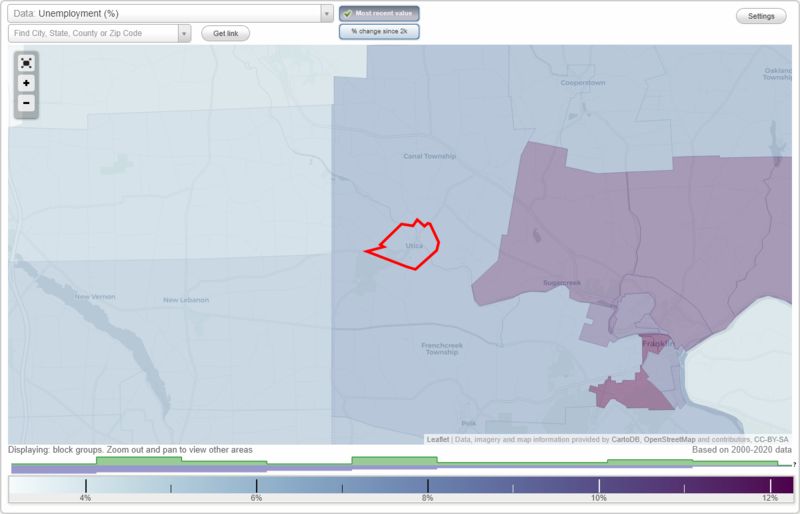
Unemployment in Utica
Unemployment by race in 2022
Unemployment rate for White non-Hispanic residents
4.0%Males
Unemployment by race in 2000
Unemployment rate for White non-Hispanic residents
9.7%Males
13.9%Females
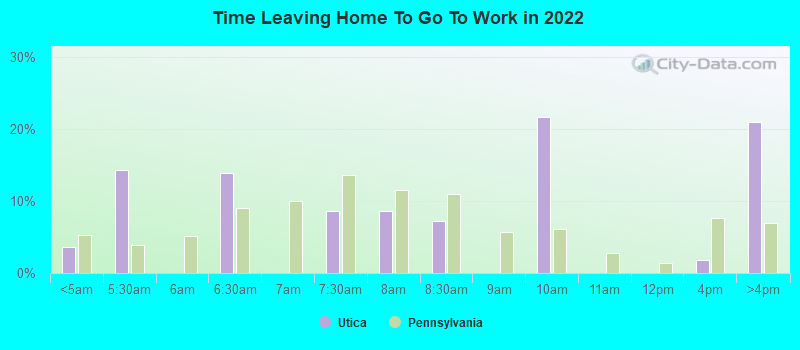
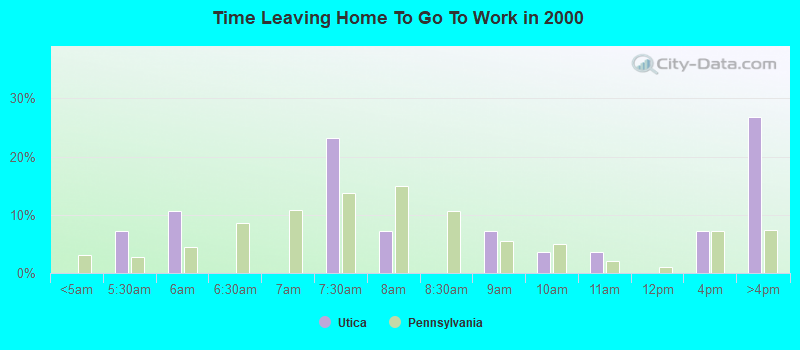
Time leaving home to go to work
12:00 a.m. to 4:59 a.m.:
Utica:
3.6% (2)
Pennsylvania:
5.2% (278,903)
5:00 a.m. to 5:29 a.m.:
Utica:
14.3% (8)
Pennsylvania:
3.9% (210,362)
6:00 a.m. to 6:29 a.m.:
Utica:
13.9% (8)
Pennsylvania:
9.0% (480,402)
7:00 a.m. to 7:29 a.m.:
Utica:
8.6% (5)
Pennsylvania:
13.6% (726,980)
7:30 a.m. to 7:59 a.m.:
Utica:
8.6% (5)
Pennsylvania:
11.5% (611,627)
8:00 a.m. to 8:29 a.m.:
Utica:
7.2% (4)
Pennsylvania:
11.0% (585,665)
9:00 a.m. to 9:59 a.m.:
Utica:
21.7% (12)
Pennsylvania:
6.1% (324,576)
12:00 p.m. to 3:59 p.m.:
Utica:
1.8% (1)
Pennsylvania:
7.6% (407,255)
4:00 p.m. to 11:59 p.m.:
Utica:
21.0% (12)
Pennsylvania:
6.9% (369,524)
5:30am:
Utica:
7.1% (4)
Pennsylvania:
2.7% (150,168)
6am:
Utica:
10.7% (6)
Pennsylvania:
4.4% (245,004)
7:30am:
Utica:
23.2% (13)
Pennsylvania:
13.7% (759,372)
8am:
Utica:
7.1% (4)
Pennsylvania:
14.9% (826,968)
9am:
Utica:
7.1% (4)
Pennsylvania:
5.5% (304,765)
10am:
Utica:
3.6% (2)
Pennsylvania:
5.1% (280,812)
11am:
Utica:
3.6% (2)
Pennsylvania:
2.1% (114,676)
4pm:
Utica:
7.1% (4)
Pennsylvania:
7.3% (404,775)
>4pm:
Utica:
26.8% (15)
Pennsylvania:
7.3% (408,070)
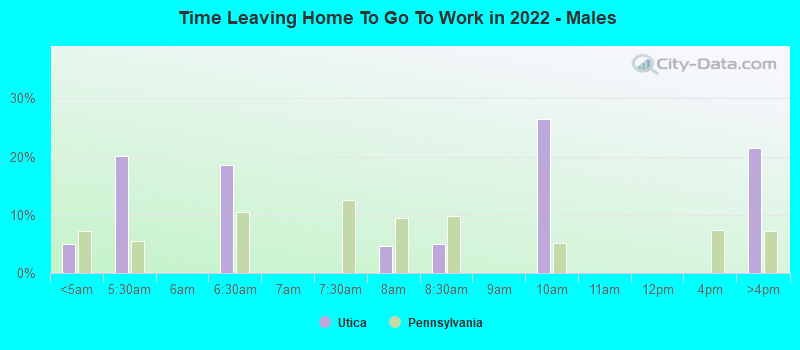
12:00 a.m. to 4:59 a.m. - Males:
Utica:
5.0% (2)
Pennsylvania:
7.2% (203,028)
5:00 a.m. to 5:29 a.m. - Males:
Utica:
20.0% (8)
Pennsylvania:
5.6% (157,829)
6:00 a.m. to 6:29 a.m. - Males:
Utica:
18.6% (8)
Pennsylvania:
10.5% (296,669)
7:30 a.m. to 7:59 a.m. - Males:
Utica:
4.6% (2)
Pennsylvania:
9.5% (268,895)
8:00 a.m. to 8:29 a.m. - Males:
Utica:
4.9% (2)
Pennsylvania:
9.7% (274,966)
9:00 a.m. to 9:59 a.m. - Males:
Utica:
26.5% (11)
Pennsylvania:
5.1% (145,545)
4:00 p.m. to 11:59 p.m. - Males:
Utica:
21.5% (9)
Pennsylvania:
7.1% (202,203)
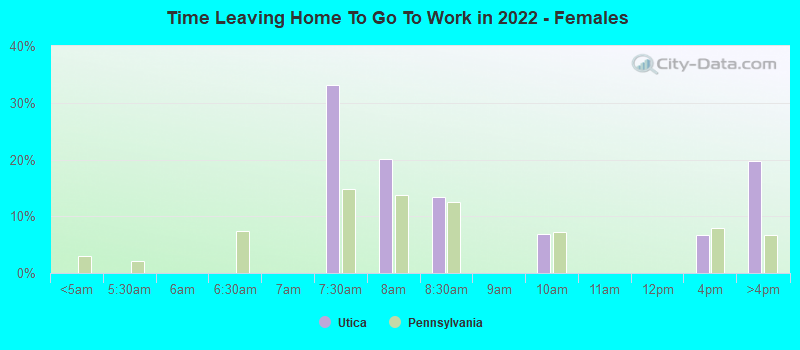
7:00 a.m. to 7:29 a.m. - Females:
Utica:
33.1% (5)
Pennsylvania:
14.8% (370,723)
7:30 a.m. to 7:59 a.m. - Females:
Utica:
20.1% (3)
Pennsylvania:
13.7% (342,732)
8:00 a.m. to 8:29 a.m. - Females:
Utica:
13.4% (2)
Pennsylvania:
12.4% (310,699)
9:00 a.m. to 9:59 a.m. - Females:
Utica:
7.0% (1)
Pennsylvania:
7.2% (179,031)
12:00 p.m. to 3:59 p.m. - Females:
Utica:
6.7% (1)
Pennsylvania:
7.9% (196,654)
4:00 p.m. to 11:59 p.m. - Females:
Utica:
19.7% (3)
Pennsylvania:
6.7% (167,321)
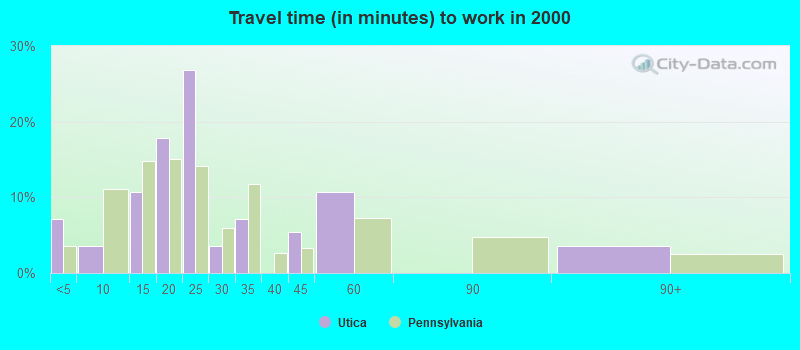
Travel time to work
Percentage of workers working in this county: 49.2% Number of people working at home: 2 (3.4% of all workers)
Less than 5 minutes:
Utica:
7.1% (4)
Pennsylvania:
3.5% (196,492)
5 to 9 minutes:
Utica:
3.6% (2)
Pennsylvania:
11.1% (615,919)
10 to 14 minutes:
Utica:
10.7% (6)
Pennsylvania:
14.9% (825,199)
15 to 19 minutes:
Utica:
17.9% (10)
Pennsylvania:
15.0% (836,006)
20 to 24 minutes:
Utica:
26.8% (15)
Pennsylvania:
14.1% (782,790)
25 to 29 minutes:
Utica:
3.6% (2)
Pennsylvania:
5.9% (327,459)
30 to 34 minutes:
Utica:
7.1% (4)
Pennsylvania:
11.8% (655,811)
40 to 44 minutes:
Utica:
5.4% (3)
Pennsylvania:
3.4% (187,483)
45 to 59 minutes:
Utica:
10.7% (6)
Pennsylvania:
7.3% (407,516)
90 or more minutes:
Utica:
3.6% (2)
Pennsylvania:
2.6% (142,325)
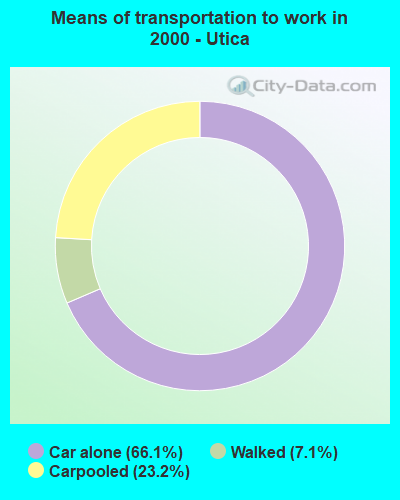
Means of transportation to work
Drove car alone:
Utica:
66.1% (37)
Pennsylvania:
76.5% (4,247,836)
Carpooled:
Utica:
23.2% (13)
Pennsylvania:
10.4% (577,364)
Walked:
Utica:
7.1% (4)
Pennsylvania:
4.1% (229,725)
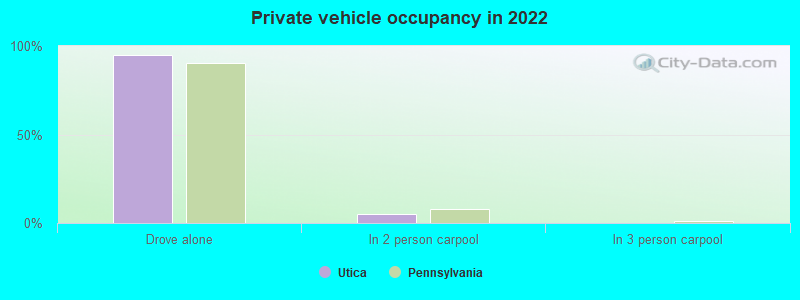
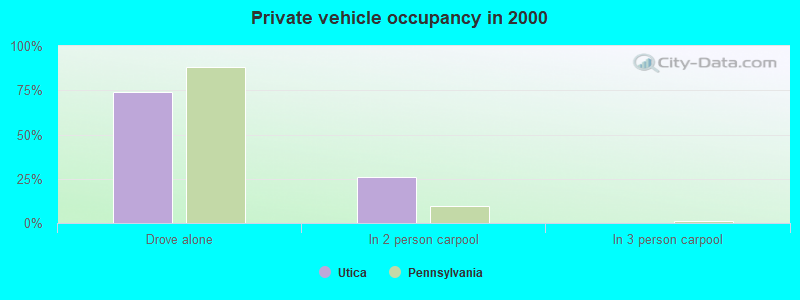
Private vehicle occupancy
Drove alone:
Utica:
94.7% (53)
Pennsylvania:
90.2% (4,322,003)
In 2 person carpool:
Utica:
5.3% (3)
Pennsylvania:
7.7% (367,639)
Drove alone:
Utica:
74.0% (37)
Pennsylvania:
88.0% (4,247,836)
In 2 person carpool:
Utica:
26.0% (13)
Pennsylvania:
9.7% (470,174)
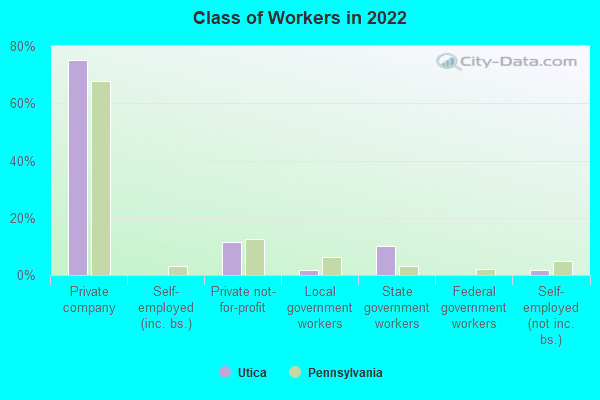
Class of workers
Employee of private company:
Utica:
75.0% (46)
Pennsylvania:
67.7% (4,333,849)
Private not-for-profit wage and salary workers:
Utica:
11.7% (7)
Pennsylvania:
12.7% (810,562)
Local government workers:
Utica:
1.7% (1)
Pennsylvania:
6.2% (397,120)
State government workers:
Utica:
10.0% (6)
Pennsylvania:
3.0% (193,490)
Self-employed workers in own not incorporated business:
Utica:
1.7% (1)
Pennsylvania:
5.0% (318,118)
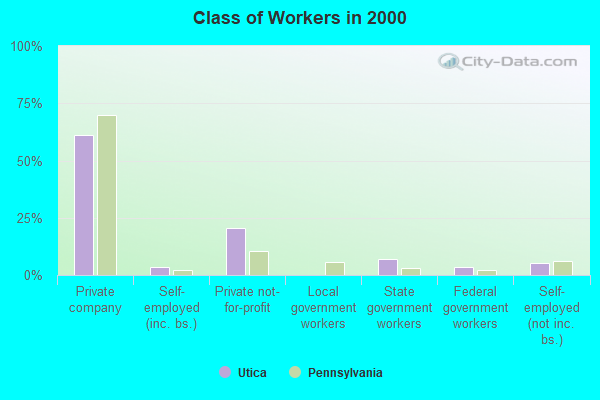
Employee of private company:
Utica:
61.0% (36)
Pennsylvania:
69.7% (3,942,119)
Self-employed in own incorporated business:
Utica:
3.4% (2)
Pennsylvania:
2.4% (134,871)
Private not-for-profit wage and salary workers:
Utica:
20.3% (12)
Pennsylvania:
10.3% (580,382)
State government workers:
Utica:
6.8% (4)
Pennsylvania:
3.2% (182,232)
Federal government workers:
Utica:
3.4% (2)
Pennsylvania:
2.3% (130,634)
Self-employed workers in own not incorporated business:
Utica:
5.1% (3)
Pennsylvania:
6.0% (339,631)
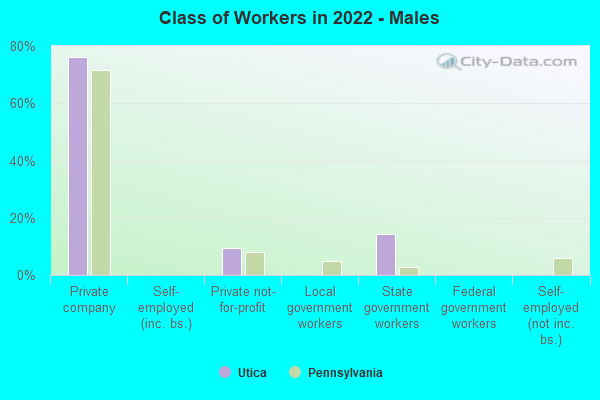
Employee of private company - Males:
Utica:
76.2% (32)
Pennsylvania:
71.5% (2,388,579)
Private not-for-profit wage and salary workers - Males:
Utica:
9.5% (4)
Pennsylvania:
8.1% (270,498)
State government workers - Males:
Utica:
14.3% (6)
Pennsylvania:
2.9% (97,540)
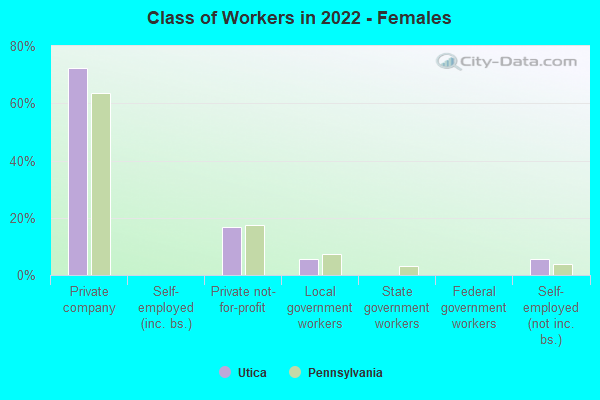
Employee of private company - Females:
Utica:
72.2% (13)
Pennsylvania:
63.5% (1,945,270)
Private not-for-profit wage and salary workers - Females:
Utica:
16.7% (3)
Pennsylvania:
17.6% (540,064)
Local government workers - Females:
Utica:
5.6% (1)
Pennsylvania:
7.5% (228,810)
Self-employed workers in own not incorporated business - Females:
Utica:
5.6% (1)
Pennsylvania:
3.9% (118,697)
Discuss Utica, Pennsylvania (PA) on our hugely popular Pennsylvania forum.