Work and Jobs in Valleyford, Washington (WA) Detailed Stats
Occupations, Industries, Unemployment, Workers, Commute
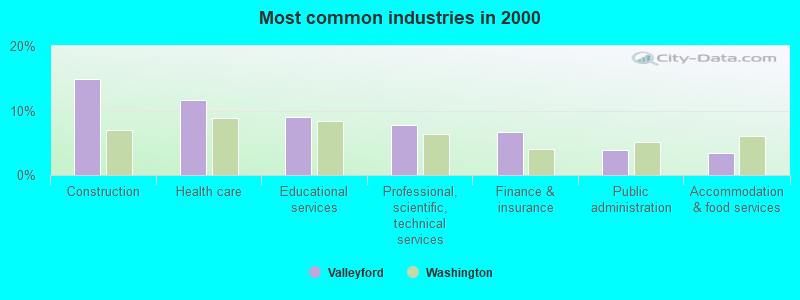
The most common industries in Valleyford are: Construction (14.8% of civilian employees), Health care (11.6% of civilian employees), Educational services (9.0% of civilian employees). 55.7% of workers are employees of private companies, which is 18.4% less than the rate of 66.0% across the entire state of Washington.
Most common industries
Most common industries | |||
|---|---|---|---|
Industry | All | Males | Females |
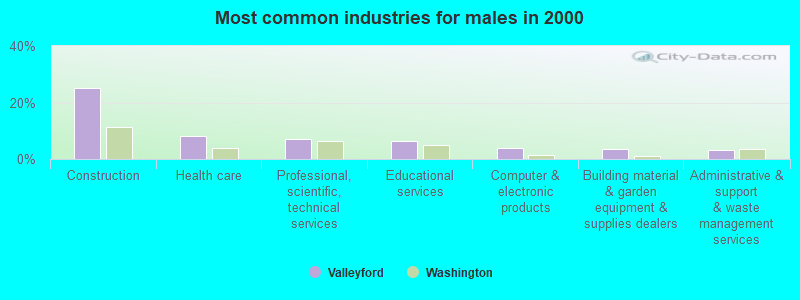
| Construction | 14.8% (163) | 25.1% (150) | 2.6% (13) |
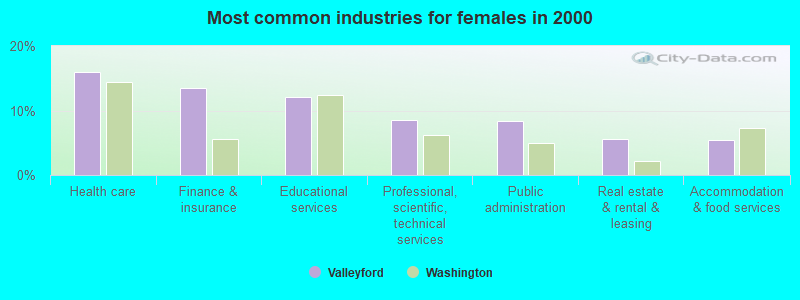
| Health care | 11.6% (128) | 8.0% (48) | 15.9% (80) |
| Educational services | 9.0% (99) | 6.4% (38) | 12.1% (61) |
| Professional, scientific, and technical services | 7.8% (86) | 7.2% (43) | 8.5% (43) |
| Finance and insurance | 6.7% (74) | 1.0% (6) | 13.5% (68) |
| Public administration | 3.8% (42) | 0.0% (0) | 8.3% (42) |
| Accommodation and food services | 3.4% (37) | 1.7% (10) | 5.4% (27) |
| Real estate and rental and leasing | 3.3% (36) | 1.3% (8) | 5.6% (28) |
| Agriculture, forestry, fishing and hunting | 2.5% (27) | 2.7% (16) | 2.2% (11) |
| Religious, grantmaking, civic, professional, and similar organizations | 2.3% (25) | 1.7% (10) | 3.0% (15) |
| Metal and metal products | 2.3% (25) | 2.0% (12) | 2.6% (13) |
| Administrative and support and waste management services | 2.2% (24) | 3.4% (20) | 0.8% (4) |
| Computer and electronic products | 2.2% (24) | 4.0% (24) | 0.0% (0) |
| Food and beverage stores | 1.9% (21) | 1.5% (9) | 2.4% (12) |
| Building material and garden equipment and supplies dealers | 1.9% (21) | 3.5% (21) | 0.0% (0) |
| Social assistance | 1.9% (21) | 0.0% (0) | 4.2% (21) |
| Utilities | 1.5% (17) | 2.8% (17) | 0.0% (0) |
| Truck transportation | 1.4% (15) | 2.5% (15) | 0.0% (0) |
| Repair and maintenance | 1.4% (15) | 2.5% (15) | 0.0% (0) |
| Arts, entertainment, and recreation | 1.3% (14) | 2.3% (14) | 0.0% (0) |
| Health and personal care, except drug, stores | 1.2% (13) | 0.0% (0) | 2.6% (13) |
| Motor vehicle and parts dealers | 1.1% (12) | 0.0% (0) | 2.4% (12) |
| Personal and laundry services | 1.1% (12) | 1.0% (6) | 1.2% (6) |
| Machinery | 1.0% (11) | 1.8% (11) | 0.0% (0) |
| Radio, TV, and computer stores | 1.0% (11) | 1.8% (11) | 0.0% (0) |
| Mining, quarrying, and oil and gas extraction | 1.0% (11) | 0.7% (4) | 1.4% (7) |
| Electrical and electronic goods merchant wholesalers | 0.9% (10) | 1.7% (10) | 0.0% (0) |
| Broadcasting and telecommunications | 0.9% (10) | 1.7% (10) | 0.0% (0) |
| Hardware, plumbing and heating equipment, and supplies merchant wholesalers | 0.7% (8) | 0.0% (0) | 1.6% (8) |
| Office supplies and stationery stores | 0.7% (8) | 1.3% (8) | 0.0% (0) |
| Publishing, and motion picture and sound recording industries | 0.6% (7) | 1.2% (7) | 0.0% (0) |
| Plastics and rubber products | 0.6% (7) | 0.0% (0) | 1.4% (7) |
| Petroleum and petroleum products merchant wholesalers | 0.6% (7) | 1.2% (7) | 0.0% (0) |
| Machinery, equipment, and supplies merchant wholesalers | 0.6% (7) | 1.2% (7) | 0.0% (0) |
| Transportation equipment | 0.6% (7) | 0.0% (0) | 1.4% (7) |
| Used merchandise, gift, novelty, and souvenir, and other miscellaneous stores | 0.6% (7) | 1.2% (7) | 0.0% (0) |
| Other direct selling establishments | 0.6% (7) | 1.2% (7) | 0.0% (0) |
| Air transportation | 0.5% (6) | 1.0% (6) | 0.0% (0) |
| Rail transportation | 0.5% (5) | 0.8% (5) | 0.0% (0) |
| Groceries and related products merchant wholesalers | 0.5% (5) | 0.8% (5) | 0.0% (0) |
| Miscellaneous nondurable goods merchant wholesalers | 0.5% (5) | 0.0% (0) | 1.0% (5) |
| Wood products | 0.5% (5) | 0.8% (5) | 0.0% (0) |
| Gasoline stations | 0.5% (5) | 0.8% (5) | 0.0% (0) |
Unemployment in Valleyford
- Unemployment by race in 2000
- Unemployment rate for White non-Hispanic residents
- 7.6%Males
- 1.8%Females
Time leaving home to go to work
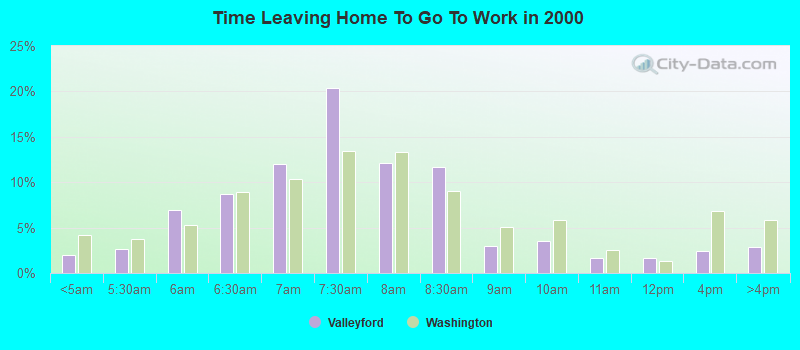
<5am:
| Valleyford: | 2.0% (21) |
| Washington: | 4.2% (115,997) |
5:30am:
| Valleyford: | 2.6% (28) |
| Washington: | 3.7% (102,868) |
6am:
| Valleyford: | 7.0% (74) |
| Washington: | 5.3% (147,812) |
6:30am:
| Valleyford: | 8.7% (92) |
| Washington: | 8.9% (248,462) |
7am:
| Valleyford: | 12.0% (127) |
| Washington: | 10.3% (288,005) |
7:30am:
| Valleyford: | 20.3% (216) |
| Washington: | 13.5% (375,030) |
8am:
| Valleyford: | 12.1% (129) |
| Washington: | 13.4% (372,576) |
8:30am:
| Valleyford: | 11.7% (124) |
| Washington: | 9.0% (252,058) |
9am:
| Valleyford: | 2.9% (31) |
| Washington: | 5.1% (141,936) |
10am:
| Valleyford: | 3.5% (37) |
| Washington: | 5.8% (161,204) |
11am:
| Valleyford: | 1.6% (17) |
| Washington: | 2.5% (70,123) |
12pm:
| Valleyford: | 1.7% (18) |
| Washington: | 1.3% (35,612) |
4pm:
| Valleyford: | 2.4% (26) |
| Washington: | 6.8% (190,565) |
>4pm:
| Valleyford: | 2.8% (30) |
| Washington: | 5.8% (162,401) |
Travel time to work
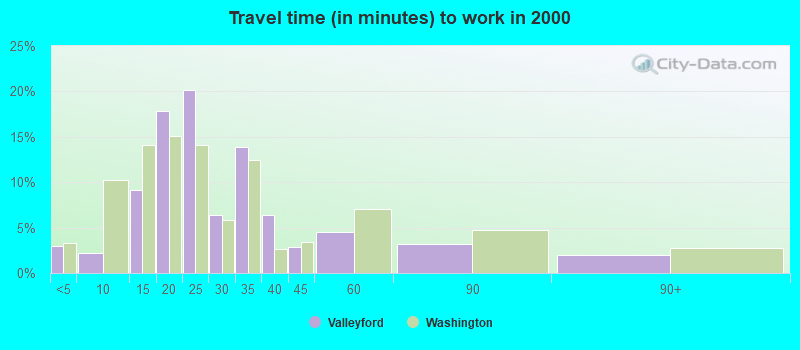
Less than 5 minutes:
| Valleyford: | 2.9% (31) |
| Washington: | 3.3% (91,132) |
5 to 9 minutes:
| Valleyford: | 2.2% (23) |
| Washington: | 10.3% (286,517) |
10 to 14 minutes:
| Valleyford: | 9.1% (97) |
| Washington: | 14.1% (391,606) |
15 to 19 minutes:
| Valleyford: | 17.8% (189) |
| Washington: | 15.0% (418,990) |
20 to 24 minutes:
| Valleyford: | 20.2% (214) |
| Washington: | 14.2% (394,209) |
25 to 29 minutes:
| Valleyford: | 6.4% (68) |
| Washington: | 5.8% (162,590) |
30 to 34 minutes:
| Valleyford: | 13.8% (147) |
| Washington: | 12.5% (348,311) |
35 to 39 minutes:
| Valleyford: | 6.4% (68) |
| Washington: | 2.6% (73,592) |
40 to 44 minutes:
| Valleyford: | 2.8% (30) |
| Washington: | 3.4% (95,182) |
45 to 59 minutes:
| Valleyford: | 4.5% (48) |
| Washington: | 7.0% (195,343) |
60 to 89 minutes:
| Valleyford: | 3.2% (34) |
| Washington: | 4.7% (131,691) |
90 or more minutes:
| Valleyford: | 2.0% (21) |
| Washington: | 2.7% (75,486) |
Means of transportation to work
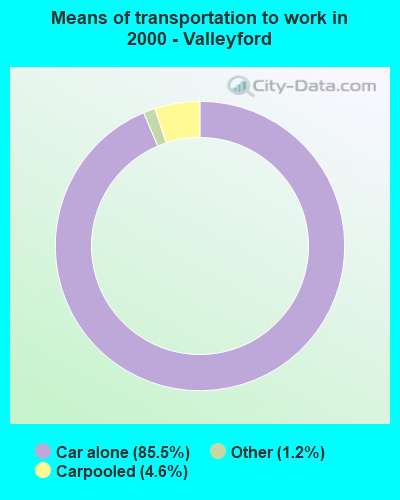

Drove car alone:
| Valleyford: | 85.5% (908) |
| Washington: | 73.3% (2,040,833) |
Carpooled:
| Valleyford: | 4.6% (49) |
| Washington: | 12.8% (357,742) |
Other means:
| Valleyford: | 1.2% (13) |
| Washington: | 0.7% (19,499) |
Private vehicle occupancy
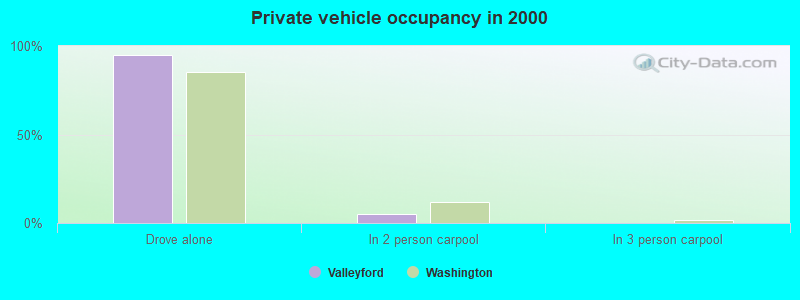
Drove alone:
| Valleyford: | 94.9% (908) |
| Washington: | 85.1% (2,040,833) |
In 2 person carpool:
| Valleyford: | 5.1% (49) |
| Washington: | 11.8% (282,638) |
Class of workers
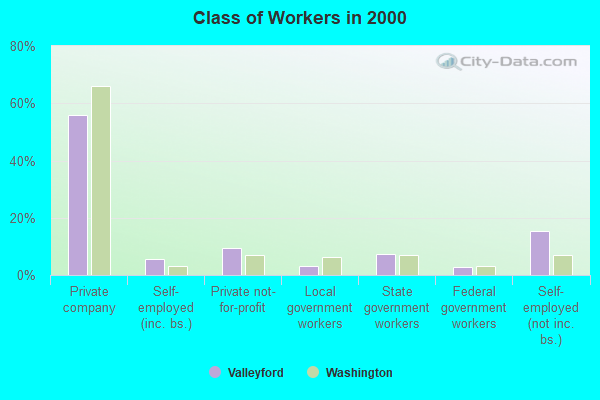
Employee of private company:
| Valleyford: | 55.7% (613) |
| Washington: | 66.0% (1,843,000) |
Self-employed in own incorporated business:
| Valleyford: | 5.7% (63) |
| Washington: | 3.2% (90,102) |
Private not-for-profit wage and salary workers:
| Valleyford: | 9.5% (105) |
| Washington: | 6.9% (191,927) |
Local government workers:
| Valleyford: | 3.1% (34) |
| Washington: | 6.4% (178,161) |
State government workers:
| Valleyford: | 7.4% (81) |
| Washington: | 6.9% (192,408) |
Federal government workers:
| Valleyford: | 2.7% (30) |
| Washington: | 3.2% (89,153) |
Self-employed workers in own not incorporated business:
| Valleyford: | 15.3% (168) |
| Washington: | 7.2% (199,827) |
Unpaid family workers:
| Valleyford: | 0.5% (6) |
| Washington: | 0.3% (9,144) |
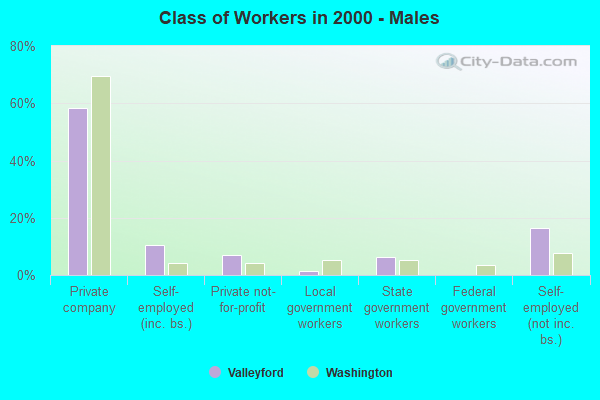
Employee of private company - Males:
| Valleyford: | 58.5% (349) |
| Washington: | 69.7% (1,044,674) |
Self-employed in own incorporated business - Males:
| Valleyford: | 10.6% (63) |
| Washington: | 4.3% (64,169) |
Private not-for-profit wage and salary workers - Males:
| Valleyford: | 7.0% (42) |
| Washington: | 4.2% (63,257) |
Local government workers - Males:
| Valleyford: | 1.5% (9) |
| Washington: | 5.3% (79,844) |
State government workers - Males:
| Valleyford: | 6.2% (37) |
| Washington: | 5.1% (76,834) |
Self-employed workers in own not incorporated business - Males:
| Valleyford: | 16.2% (97) |
| Washington: | 7.6% (114,199) |
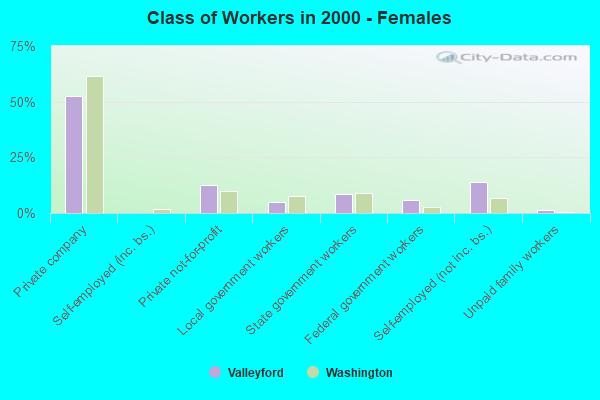
Employee of private company - Females:
| Valleyford: | 52.5% (264) |
| Washington: | 61.7% (798,326) |
Private not-for-profit wage and salary workers - Females:
| Valleyford: | 12.5% (63) |
| Washington: | 9.9% (128,670) |
Local government workers - Females:
| Valleyford: | 5.0% (25) |
| Washington: | 7.6% (98,317) |
State government workers - Females:
| Valleyford: | 8.7% (44) |
| Washington: | 8.9% (115,574) |
Federal government workers - Females:
| Valleyford: | 6.0% (30) |
| Washington: | 2.8% (36,390) |
Self-employed workers in own not incorporated business - Females:
| Valleyford: | 14.1% (71) |
| Washington: | 6.6% (85,628) |
Unpaid family workers - Females:
| Valleyford: | 1.2% (6) |
| Washington: | 0.4% (5,255) |