Work and Jobs in Walnut Grove, California (CA) Detailed Stats
Data:
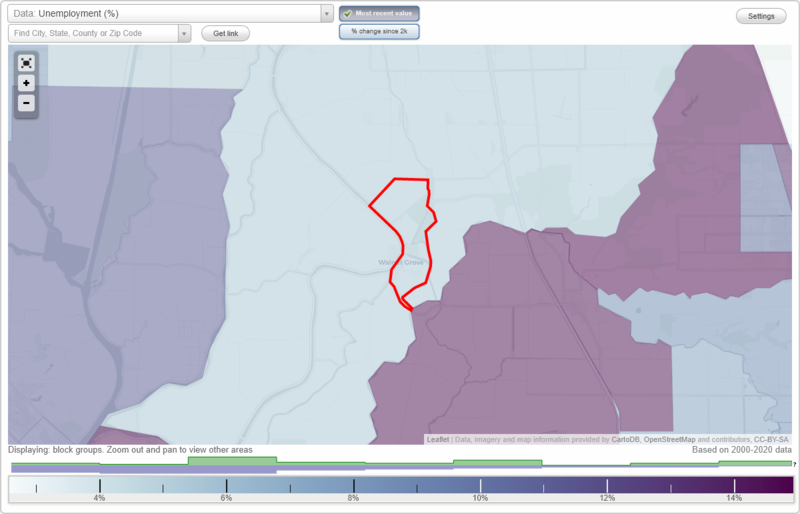
Unemployment (%)
Unemployment (% change since 2000)
Unemployment (%) - White
Unemployment (% change since 2000) - White
Unemployment (%) - Black or African American
Unemployment (% change since 2000) - Black or African American
Unemployment (%) - Asian
Unemployment (% change since 2000) - Asian
Unemployment (%) - Hispanic or Latino
Unemployment (% change since 2000) - Hispanic or Latino
Unemployment (%) - American Indian and Alaska Native
Unemployment (% change since 2000) - American Indian and Alaska Native
Unemployment (%) - Multirace
Unemployment (% change since 2000) - Multirace
Unemployment (%) - Other Race
Unemployment (% change since 2000) - Other Race
Industry diversity
Most Common Industries - Agriculture, forestry, fishing and hunting, and mining (%)
Most Common Industries - Agriculture, forestry, fishing and hunting (%)
Most Common Industries - Mining, quarrying, and oil and gas extraction (%)
Most Common Industries - Construction (%)
Most Common Industries - Manufacturing (%)
Most Common Industries - Wholesale trade (%)
Most Common Industries - Retail trade (%)
Most Common Industries - Transportation and warehousing, and utilities (%)
Most Common Industries - Transportation and warehousing (%)
Most Common Industries - Utilities (%)
Most Common Industries - Information (%)
Most Common Industries - Finance and insurance, and real estate and rental and leasing (%)
Most Common Industries - Finance and insurance (%)
Most Common Industries - Real estate and rental and leasing (%)
Most Common Industries - Professional, scientific, and management, and administrative and waste management services (%)
Most Common Industries - Professional, scientific, and technical services (%)
Most Common Industries - Management of companies and enterprises (%)
Most Common Industries - Administrative and support and waste management services (%)
Most Common Industries - Educational services, and health care and social assistance (%)
Most Common Industries - Educational services (%)
Most Common Industries - Health care and social assistance (%)
Most Common Industries - Arts, entertainment, and recreation, and accommodation and food services (%)
Most Common Industries - Arts, entertainment, and recreation (%)
Most Common Industries - Accommodation and food services (%)
Most Common Industries - Other services, except public administration (%)
Most Common Industries - Public administration (%)
Occupation diversity
Most Common Occupations - Management, business, science, and arts occupations (%)
Most Common Occupations - Management, business, and financial occupations (%)
Most Common Occupations - Management occupations (%)
Most Common Occupations - Business and financial operations occupations (%)
Most Common Occupations - Computer, engineering, and science occupations (%)
Most Common Occupations - Computer and mathematical occupations (%)
Most Common Occupations - Architecture and engineering occupations (%)
Most Common Occupations - Life, physical, and social science occupations (%)
Most Common Occupations - Education, legal, community service, arts, and media occupations (%)
Most Common Occupations - Community and social service occupations (%)
Most Common Occupations - Legal occupations (%)
Most Common Occupations - Education, training, and library occupations (%)
Most Common Occupations - Arts, design, entertainment, sports, and media occupations (%)
Most Common Occupations - Healthcare practitioners and technical occupations (%)
Most Common Occupations - Health diagnosing and treating practitioners and other technical occupations (%)
Most Common Occupations - Health technologists and technicians (%)
Most Common Occupations - Service occupations (%)
Most Common Occupations - Healthcare support occupations (%)
Most Common Occupations - Protective service occupations (%)
Most Common Occupations - Fire fighting and prevention, and other protective service workers including supervisors (%)
Most Common Occupations - Law enforcement workers including supervisors (%)
Most Common Occupations - Food preparation and serving related occupations (%)
Most Common Occupations - Building and grounds cleaning and maintenance occupations (%)
Most Common Occupations - Personal care and service occupations (%)
Most Common Occupations - Sales and office occupations (%)
Most Common Occupations - Sales and related occupations (%)
Most Common Occupations - Office and administrative support occupations (%)
Most Common Occupations - Natural resources, construction, and maintenance occupations (%)
Most Common Occupations - Farming, fishing, and forestry occupations (%)
Most Common Occupations - Construction and extraction occupations (%)
Most Common Occupations - Installation, maintenance, and repair occupations (%)
Most Common Occupations - Production, transportation, and material moving occupations (%)
Most Common Occupations - Production occupations (%)
Most Common Occupations - Transportation occupations (%)
Most Common Occupations - Material moving occupations (%)
Private vehicle occupancy - Drove alone (% change since 2000)
Private vehicle occupancy - Carpooled (%)
Private vehicle occupancy - Carpooled (% change since 2000)
Private vehicle occupancy - In 2-person carpool (%)
Private vehicle occupancy - In 2-person carpool (% change since 2000)
Private vehicle occupancy - In 3-person carpool (%)
Private vehicle occupancy - In 3-person carpool (% change since 2000)
Private vehicle occupancy - In 4-person carpool (%)
Private vehicle occupancy - In 4-person carpool (% change since 2000)
Private vehicle occupancy - In 5- or 6-person carpool (%)
Private vehicle occupancy - In 5- or 6-person carpool (% change since 2000)
Private vehicle occupancy - In 7-or-more-person carpool (%)
Private vehicle occupancy - In 7-or-more-person carpool (% change since 2000)
Time Leaving Home To Go To Work - 12:00 a.m. to 4:59 a.m. (%)
Time Leaving Home To Go To Work - 12:00 a.m. to 4:59 a.m. (% change since 2000)
Time Leaving Home To Go To Work - 5:00 a.m. to 5:59 a.m. (%)
Time Leaving Home To Go To Work - 5:00 a.m. to 5:59 a.m. (% change since 2000)
Time Leaving Home To Go To Work - 6:00 a.m. to 6:59 a.m. (%)
Time Leaving Home To Go To Work - 6:00 a.m. to 6:59 a.m. (% change since 2000)
Time Leaving Home To Go To Work - 7:00 a.m. to 7:59 a.m. (%)
Time Leaving Home To Go To Work - 7:00 a.m. to 7:59 a.m. (% change since 2000)
Time Leaving Home To Go To Work - 8:00 a.m. to 8:59 a.m. (%)
Time Leaving Home To Go To Work - 8:00 a.m. to 8:59 a.m. (% change since 2000)
Time Leaving Home To Go To Work - 9:00 a.m. to 9:59 a.m. (%)
Time Leaving Home To Go To Work - 9:00 a.m. to 9:59 a.m. (% change since 2000)
Time Leaving Home To Go To Work - 10:00 a.m. to 10:59 a.m. (%)
Time Leaving Home To Go To Work - 10:00 a.m. to 10:59 a.m. (% change since 2000)
Time Leaving Home To Go To Work - 11:00 a.m. to 11:59 a.m. (%)
Time Leaving Home To Go To Work - 11:00 a.m. to 11:59 a.m. (% change since 2000)
Time Leaving Home To Go To Work - 12:00 p.m. to 3:59 p.m. (%)
Time Leaving Home To Go To Work - 12:00 p.m. to 3:59 p.m. (% change since 2000)
Time Leaving Home To Go To Work - 4:00 p.m. to 11:59 p.m. (%)
Time Leaving Home To Go To Work - 4:00 p.m. to 11:59 p.m. (% change since 2000)
Class of Workers - Employee of private company (%)
Class of Workers - Employee of private company (% change since 2000)
Class of Workers - Self-employed in own incorporated business (%)
Class of Workers - Self-employed in own incorporated business (% change since 2000)
Class of Workers - Private not-for-profit wage and salary workers (%)
Class of Workers - Private not-for-profit wage and salary workers (% change since 2000)
Class of Workers - Local government workers (%)
Class of Workers - Local government workers (% change since 2000)
Class of Workers - State government workers (%)
Class of Workers - State government workers (% change since 2000)
Class of Workers - Federal government workers (%)
Class of Workers - Federal government workers (% change since 2000)
Class of Workers - Self-employed workers in own not incorporated business and Unpaid family workers (%)
Class of Workers - Self-employed workers in own not incorporated business and Unpaid family workers (% change since 2000)
Means of transportation to work - Drove car alone (%)
Means of transportation to work - Drove car alone (% change since 2000)
Means of transportation to work - Carpooled (%)
Means of transportation to work - Carpooled (% change since 2000)
Means of transportation to work - Public transportation (%)
Means of transportation to work - Public transportation (% change since 2000)
Means of transportation to work - Bus or trolley bus (%)
Means of transportation to work - Bus or trolley bus (% change since 2000)
Means of transportation to work - Streetcar or trolley car (%)
Means of transportation to work - Streetcar or trolley car (% change since 2000)
Means of transportation to work - Subway or elevated (%)
Means of transportation to work - Subway or elevated (% change since 2000)
Means of transportation to work - Railroad (%)
Means of transportation to work - Railroad (% change since 2000)
Means of transportation to work - Ferryboat (%)
Means of transportation to work - Ferryboat (% change since 2000)
Means of transportation to work - Taxicab (%)
Means of transportation to work - Taxicab (% change since 2000)
Means of transportation to work - Motorcycle (%)
Means of transportation to work - Motorcycle (% change since 2000)
Means of transportation to work - Bicycle (%)
Means of transportation to work - Bicycle (% change since 2000)
Means of transportation to work - Walked (%)
Means of transportation to work - Walked (% change since 2000)
Means of transportation to work - Other means (%)
Means of transportation to work - Other means (% change since 2000)
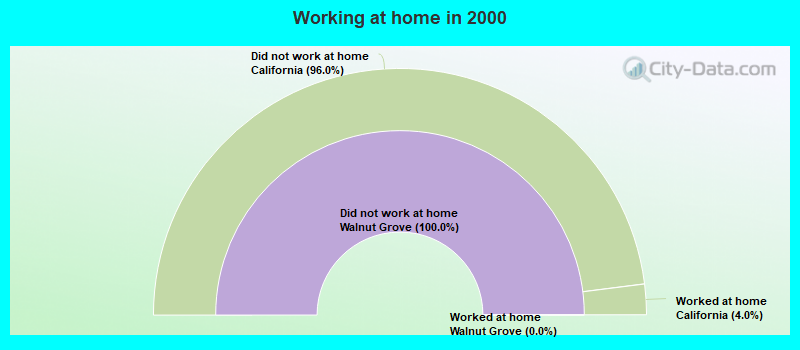
Working at home (%)
Working at home (% change since 2000)
Travel time to work - Less than 5 minutes (%)
Travel time to work - Less than 5 minutes (% change since 2000)
Travel time to work - 5 to 9 minutes (%)
Travel time to work - 5 to 9 minutes (% change since 2000)
Travel time to work - 10 to 19 minutes (%)
Travel time to work - 10 to 19 minutes (% change since 2000)
Travel time to work - 20 to 29 minutes (%)
Travel time to work - 20 to 29 minutes (% change since 2000)
Travel time to work - 30 to 39 minutes (%)
Travel time to work - 30 to 39 minutes (% change since 2000)
Travel time to work - 40 to 59 minutes (%)
Travel time to work - 40 to 59 minutes (% change since 2000)
Travel time to work - 60 to 89 minutes (%)
Travel time to work - 60 to 89 minutes (% change since 2000)
Travel time to work - 90 or more minutes (%)
Travel time to work - 90 or more minutes (% change since 2000)
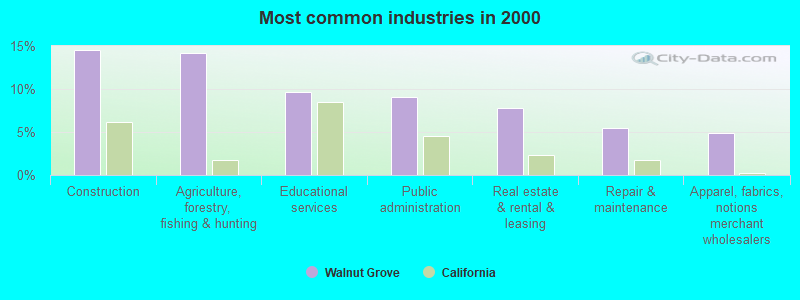
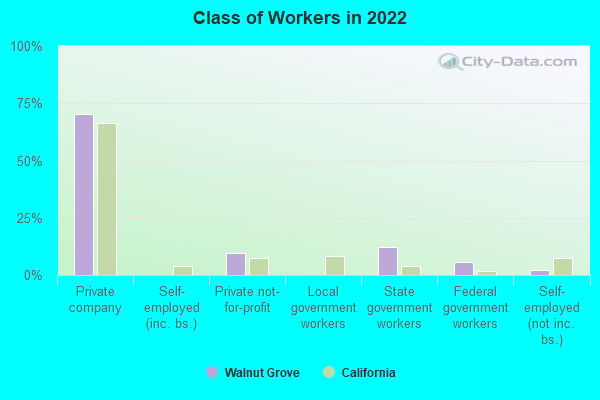
The most common industries in Walnut Grove are: Construction (14.6% of civilian employees), Agriculture, forestry, fishing & hunting (14.2% of civilian employees), Educational services (9.7% of civilian employees). 82.5% of workers work in Sacramento County and 24.0% of all workers work at home. 70.5% of workers are employees of private companies, which is 5.7% greater than the rate of 66.5% across the entire state of California.
Whole page based on the data from 2000 / 2022 when the population of Walnut Grove, California was 669 / 817
Most common industries
Most common industries Industry All Males Females
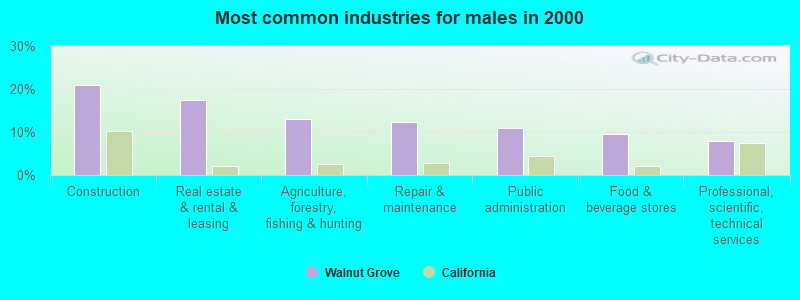
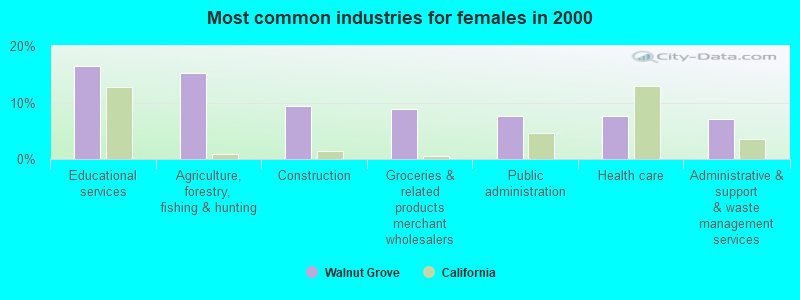
Construction 14.6% 21.0% 9.4% Agriculture, forestry, fishing and hunting 14.2% 13.0% 15.2% Educational services 9.7% 1.4% 16.4% Public administration 9.1% 10.9% 7.6% Real estate and rental and leasing 7.8% 17.4% 0.0% Repair and maintenance 5.5% 12.3% 0.0% Apparel, fabrics, and notions merchant wholesalers 4.9% 6.5% 3.5% Groceries and related products merchant wholesalers 4.9% 0.0% 8.8% Food and beverage stores 4.2% 9.4% 0.0% Health care 4.2% 0.0% 7.6% Administrative and support and waste management services 3.9% 0.0% 7.0% Wood products 3.6% 0.0% 6.4% Data processing, libraries, and other information services 3.6% 0.0% 6.4% Professional, scientific, and technical services 3.6% 8.0% 0.0% Social assistance 2.3% 0.0% 4.1% Accommodation and food services 2.3% 0.0% 4.1% Miscellaneous nondurable goods merchant wholesalers 1.3% 0.0% 2.3% Private households 0.6% 0.0% 1.2%
Unemployment in Walnut Grove Unemployment by race in 2022
Unemployment rate for Hispanic or Latino residents 8.3% MalesUnemployment by race in 2000
Unemployment rate for other race residents 27.3% Males16.7% FemalesUnemployment rate for Hispanic or Latino residents 26.8% Males16.2% Females
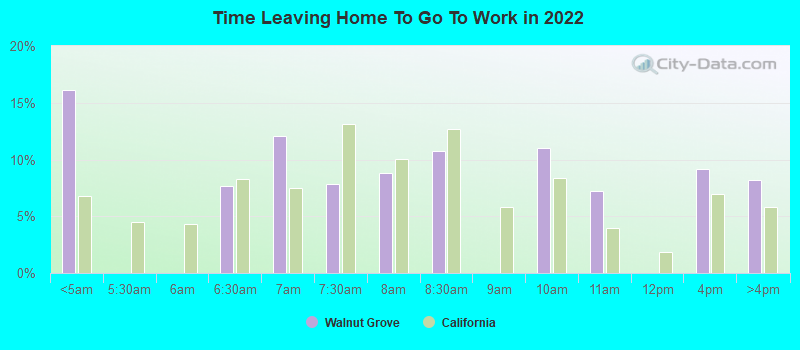
Time leaving home to go to work 12:00 a.m. to 4:59 a.m.: Walnut Grove:
16.1% (51)California:
6.8% (1,050,902)
6:00 a.m. to 6:29 a.m.: Walnut Grove:
7.7% (25)California:
8.3% (1,273,588)
6:30 a.m. to 6:59 a.m.: Walnut Grove:
12.1% (39)California:
7.5% (1,156,338)
7:00 a.m. to 7:29 a.m.: Walnut Grove:
7.8% (25)California:
13.2% (2,027,702)
7:30 a.m. to 7:59 a.m.: Walnut Grove:
8.8% (28)California:
10.1% (1,550,402)
8:00 a.m. to 8:29 a.m.: Walnut Grove:
10.8% (35)California:
12.7% (1,953,986)
9:00 a.m. to 9:59 a.m.: Walnut Grove:
11.0% (35)California:
8.4% (1,288,499)
10:00 a.m. to 10:59 a.m.: Walnut Grove:
7.2% (23)California:
4.0% (613,193)
12:00 p.m. to 3:59 p.m.: Walnut Grove:
9.2% (29)California:
7.0% (1,075,505)
4:00 p.m. to 11:59 p.m.: Walnut Grove:
8.2% (26)California:
5.8% (891,240)
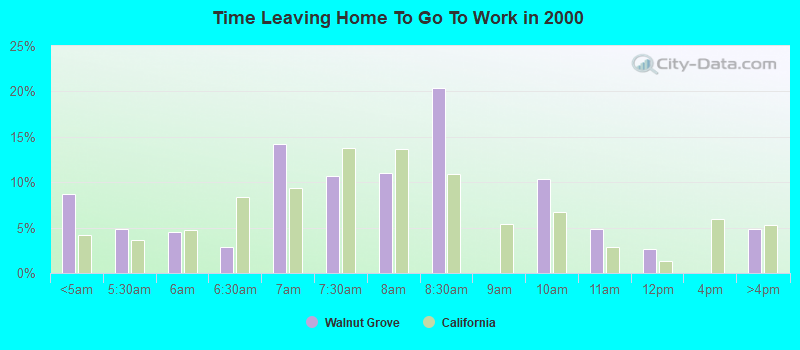
<5am: Walnut Grove:
8.7% (27)California:
4.2% (606,086)
5:30am: Walnut Grove:
4.9% (15)California:
3.6% (523,209)
6am: Walnut Grove:
4.5% (14)California:
4.8% (692,256)
6:30am: Walnut Grove:
2.9% (9)California:
8.4% (1,216,867)
7am: Walnut Grove:
14.2% (44)California:
9.4% (1,362,830)
7:30am: Walnut Grove:
10.7% (33)California:
13.8% (2,006,950)
8am: Walnut Grove:
11.0% (34)California:
13.7% (1,986,831)
8:30am: Walnut Grove:
20.4% (63)California:
10.9% (1,577,815)
10am: Walnut Grove:
10.4% (32)California:
6.7% (972,355)
11am: Walnut Grove:
4.9% (15)California:
2.9% (414,479)
12pm: Walnut Grove:
2.6% (8)California:
1.3% (189,005)
>4pm: Walnut Grove:
4.9% (15)California:
5.3% (776,167)
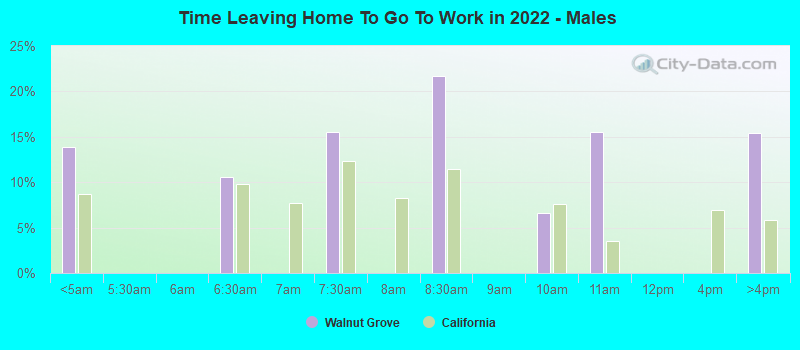
12:00 a.m. to 4:59 a.m. - Males: Walnut Grove:
13.9% (23)California:
8.7% (747,612)
6:00 a.m. to 6:29 a.m. - Males: Walnut Grove:
10.5% (17)California:
9.8% (842,941)
7:00 a.m. to 7:29 a.m. - Males: Walnut Grove:
15.5% (26)California:
12.4% (1,058,532)
8:00 a.m. to 8:29 a.m. - Males: Walnut Grove:
21.7% (36)California:
11.5% (984,538)
9:00 a.m. to 9:59 a.m. - Males: Walnut Grove:
6.6% (11)California:
7.7% (655,038)
10:00 a.m. to 10:59 a.m. - Males: Walnut Grove:
15.5% (26)California:
3.5% (301,425)
4:00 p.m. to 11:59 p.m. - Males: Walnut Grove:
15.4% (26)California:
5.8% (499,471)
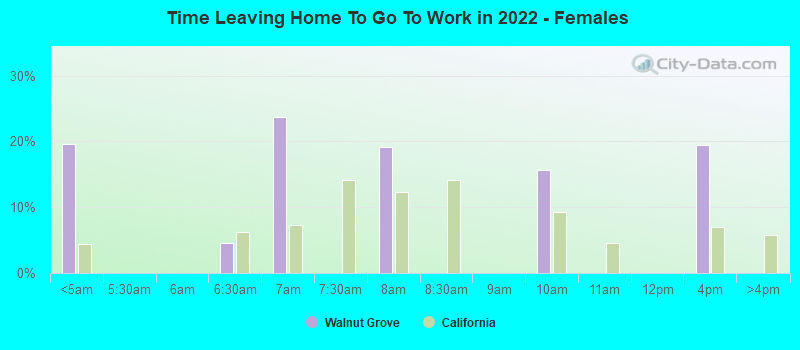
12:00 a.m. to 4:59 a.m. - Females: Walnut Grove:
19.6% (30)California:
4.4% (303,290)
6:00 a.m. to 6:29 a.m. - Females: Walnut Grove:
4.6% (7)California:
6.3% (430,647)
6:30 a.m. to 6:59 a.m. - Females: Walnut Grove:
23.7% (36)California:
7.3% (498,781)
7:30 a.m. to 7:59 a.m. - Females: Walnut Grove:
19.1% (29)California:
12.4% (847,675)
9:00 a.m. to 9:59 a.m. - Females: Walnut Grove:
15.6% (24)California:
9.2% (633,461)
12:00 p.m. to 3:59 p.m. - Females: Walnut Grove:
19.4% (30)California:
7.0% (480,658)
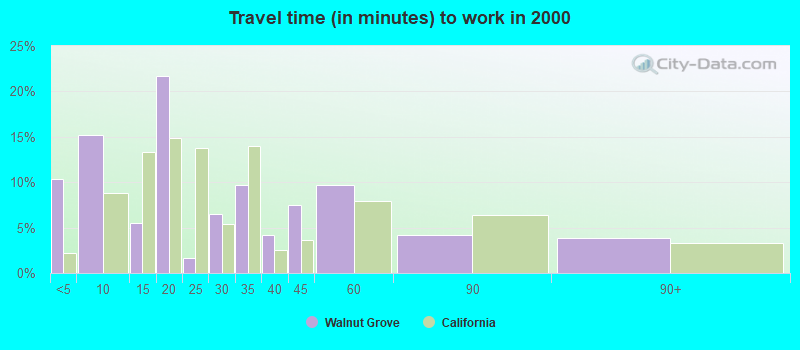
Travel time to work Percentage of workers working in this county: 82.5%Number of people working at home: 106 (24.0% of all workers )
Less than 5 minutes: Walnut Grove:
10.4% (32)California:
2.2% (324,703)
5 to 9 minutes: Walnut Grove:
15.2% (47)California:
8.8% (1,280,443)
10 to 14 minutes: Walnut Grove:
5.5% (17)California:
13.3% (1,930,263)
15 to 19 minutes: Walnut Grove:
21.7% (67)California:
14.9% (2,157,970)
20 to 24 minutes: Walnut Grove:
1.6% (5)California:
13.8% (2,004,060)
25 to 29 minutes: Walnut Grove:
6.5% (20)California:
5.4% (782,241)
30 to 34 minutes: Walnut Grove:
9.7% (30)California:
13.9% (2,025,657)
35 to 39 minutes: Walnut Grove:
4.2% (13)California:
2.5% (366,487)
40 to 44 minutes: Walnut Grove:
7.4% (23)California:
3.6% (528,043)
45 to 59 minutes: Walnut Grove:
9.7% (30)California:
7.9% (1,151,598)
60 to 89 minutes: Walnut Grove:
4.2% (13)California:
6.4% (933,123)
90 or more minutes: Walnut Grove:
3.9% (12)California:
3.3% (483,698)
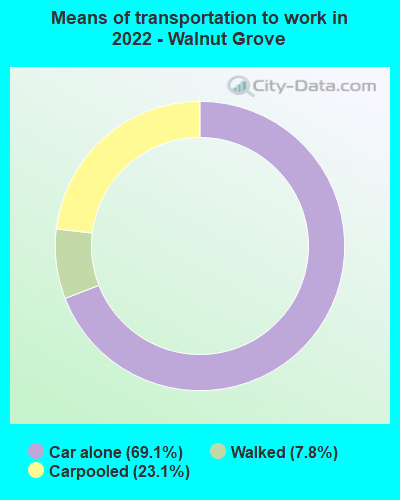
Means of transportation to work Drove car alone: Walnut Grove:
69.1% (553)California:
79.1% (5,345,368)
Carpooled: Walnut Grove:
23.1% (185)California:
11.9% (878,699)
Walked: Walnut Grove:
7.8% (62)California:
2.9% (218,374)
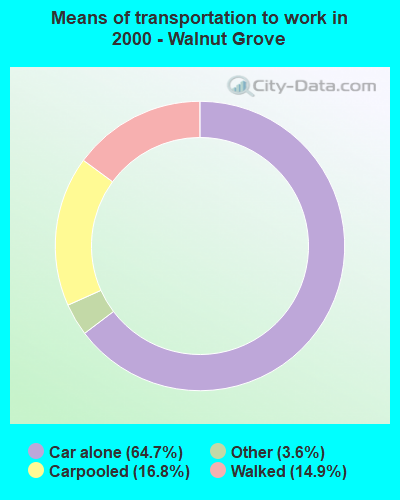
Drove car alone: Walnut Grove:
64.7% (200)California:
71.8% (10,432,462)
Carpooled: Walnut Grove:
16.8% (52)California:
14.5% (2,113,313)
Walked: Walnut Grove:
14.9% (46)California:
2.9% (414,581)
Other means: Walnut Grove:
3.6% (11)California:
0.8% (115,064)
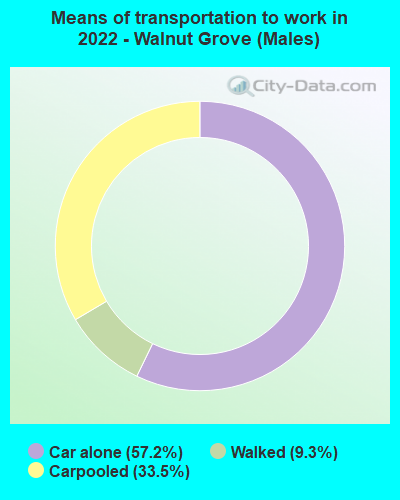
Drove car alone - Males: Walnut Grove:
57.2% (224)California:
80.0% (5,345,368)
Carpooled - Males: Walnut Grove:
33.5% (131)California:
11.1% (878,699)
Walked - Males: Walnut Grove:
9.3% (36)California:
2.7% (218,374)
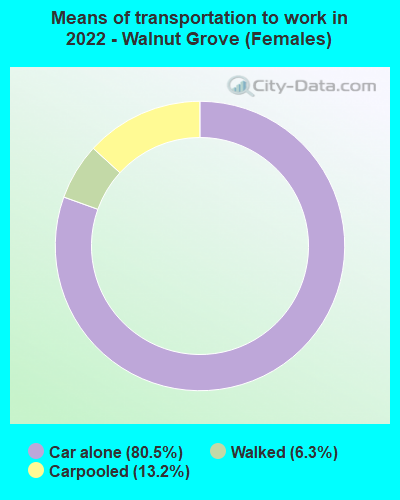
Drove car alone - Females: Walnut Grove:
80.5% (329)California:
77.9% (5,345,368)
Carpooled - Females: Walnut Grove:
13.2% (54)California:
12.8% (878,699)
Walked - Females: Walnut Grove:
6.3% (26)California:
3.2% (218,374)
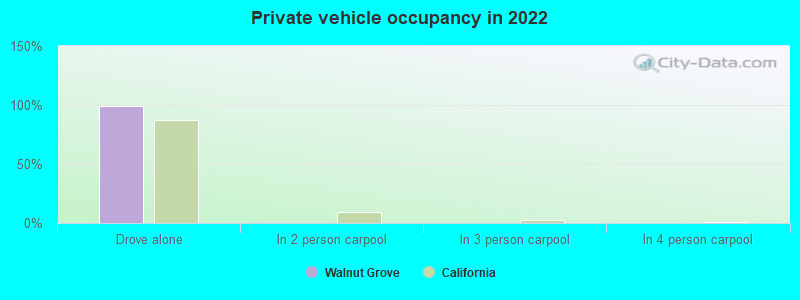
Private vehicle occupancy Drove alone: Walnut Grove:
99.0% (320)California:
86.9% (12,187,486)
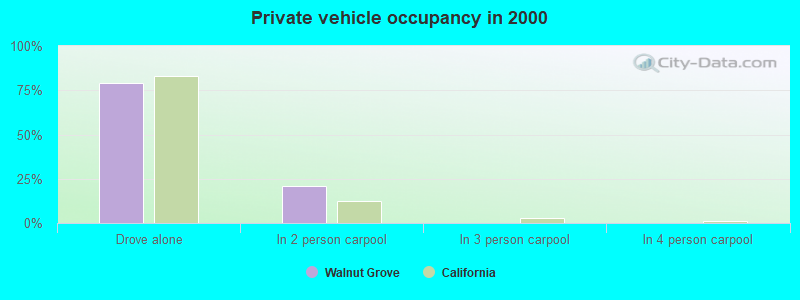
Drove alone: Walnut Grove:
79.4% (200)California:
83.2% (10,432,462)
In 2 person carpool: Walnut Grove:
20.6% (52)California:
12.5% (1,564,905)
Class of workers
Employee of private company: Walnut Grove:
70.5% (313)California:
66.5% (12,596,030)
Private not-for-profit wage and salary workers: Walnut Grove:
9.4% (42)California:
7.5% (1,417,407)
State government workers: Walnut Grove:
12.2% (54)California:
4.1% (780,915)
Federal government workers: Walnut Grove:
5.8% (26)California:
2.0% (369,858)
Self-employed workers in own not incorporated business: Walnut Grove:
2.1% (9)California:
7.4% (1,410,735)
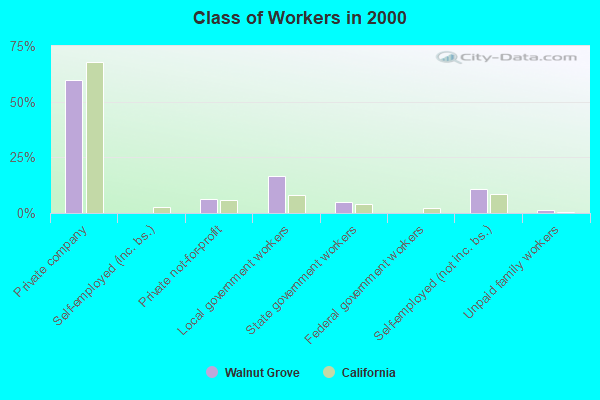
Employee of private company: Walnut Grove:
59.9% (185)California:
68.0% (10,009,465)
Private not-for-profit wage and salary workers: Walnut Grove:
6.5% (20)California:
5.7% (845,536)
Local government workers: Walnut Grove:
16.8% (52)California:
8.3% (1,218,764)
State government workers: Walnut Grove:
4.9% (15)California:
4.0% (594,953)
Self-employed workers in own not incorporated business: Walnut Grove:
10.7% (33)California:
8.5% (1,249,530)
Unpaid family workers: Walnut Grove:
1.3% (4)California:
0.4% (53,934)
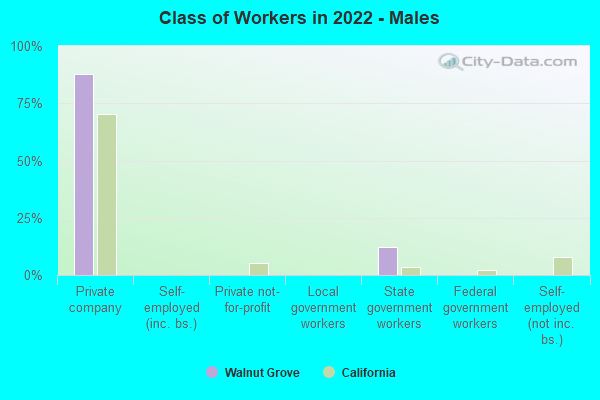
Employee of private company - Males: Walnut Grove:
87.7% (203)California:
70.3% (7,191,252)
State government workers - Males: Walnut Grove:
12.3% (29)California:
3.4% (343,636)
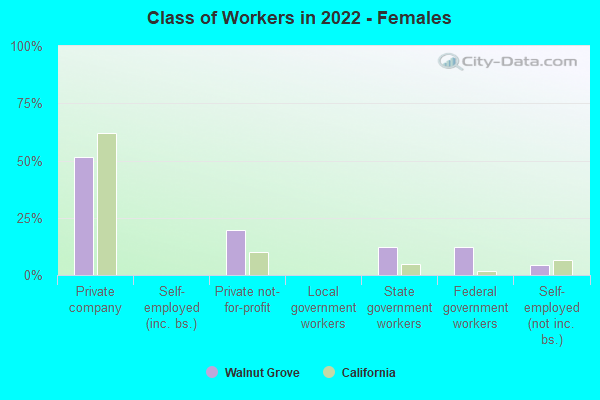
Employee of private company - Females: Walnut Grove:
51.7% (109)California:
62.0% (5,404,778)
Private not-for-profit wage and salary workers - Females: Walnut Grove:
19.8% (42)California:
10.2% (888,285)
State government workers - Females: Walnut Grove:
12.1% (26)California:
5.0% (437,279)
Federal government workers - Females: Walnut Grove:
12.1% (26)California:
1.8% (159,984)
Self-employed workers in own not incorporated business - Females: Walnut Grove:
4.3% (9)California:
6.7% (586,376)