Work and Jobs in Westley, California (CA) Detailed Stats
Data:
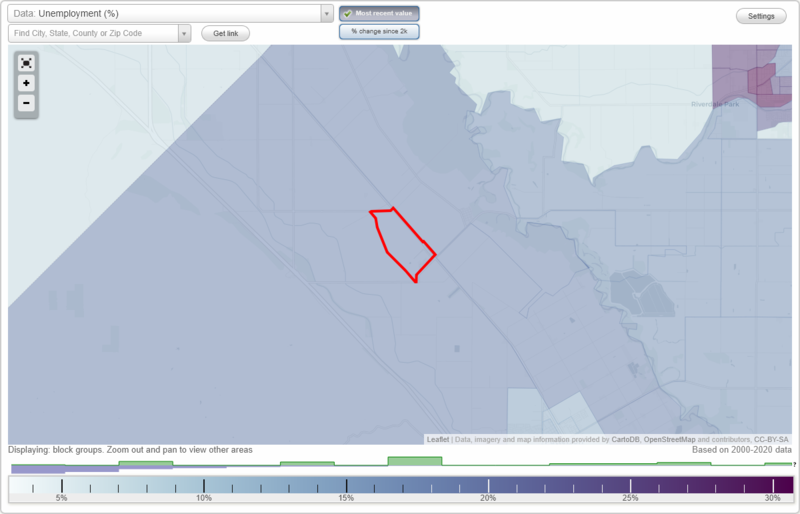
Unemployment (%)
Unemployment (% change since 2000)
Unemployment (%) - White
Unemployment (% change since 2000) - White
Unemployment (%) - Black or African American
Unemployment (% change since 2000) - Black or African American
Unemployment (%) - Asian
Unemployment (% change since 2000) - Asian
Unemployment (%) - Hispanic or Latino
Unemployment (% change since 2000) - Hispanic or Latino
Unemployment (%) - American Indian and Alaska Native
Unemployment (% change since 2000) - American Indian and Alaska Native
Unemployment (%) - Multirace
Unemployment (% change since 2000) - Multirace
Unemployment (%) - Other Race
Unemployment (% change since 2000) - Other Race
Industry diversity
Most Common Industries - Agriculture, forestry, fishing and hunting, and mining (%)
Most Common Industries - Agriculture, forestry, fishing and hunting (%)
Most Common Industries - Mining, quarrying, and oil and gas extraction (%)
Most Common Industries - Construction (%)
Most Common Industries - Manufacturing (%)
Most Common Industries - Wholesale trade (%)
Most Common Industries - Retail trade (%)
Most Common Industries - Transportation and warehousing, and utilities (%)
Most Common Industries - Transportation and warehousing (%)
Most Common Industries - Utilities (%)
Most Common Industries - Information (%)
Most Common Industries - Finance and insurance, and real estate and rental and leasing (%)
Most Common Industries - Finance and insurance (%)
Most Common Industries - Real estate and rental and leasing (%)
Most Common Industries - Professional, scientific, and management, and administrative and waste management services (%)
Most Common Industries - Professional, scientific, and technical services (%)
Most Common Industries - Management of companies and enterprises (%)
Most Common Industries - Administrative and support and waste management services (%)
Most Common Industries - Educational services, and health care and social assistance (%)
Most Common Industries - Educational services (%)
Most Common Industries - Health care and social assistance (%)
Most Common Industries - Arts, entertainment, and recreation, and accommodation and food services (%)
Most Common Industries - Arts, entertainment, and recreation (%)
Most Common Industries - Accommodation and food services (%)
Most Common Industries - Other services, except public administration (%)
Most Common Industries - Public administration (%)
Occupation diversity
Most Common Occupations - Management, business, science, and arts occupations (%)
Most Common Occupations - Management, business, and financial occupations (%)
Most Common Occupations - Management occupations (%)
Most Common Occupations - Business and financial operations occupations (%)
Most Common Occupations - Computer, engineering, and science occupations (%)
Most Common Occupations - Computer and mathematical occupations (%)
Most Common Occupations - Architecture and engineering occupations (%)
Most Common Occupations - Life, physical, and social science occupations (%)
Most Common Occupations - Education, legal, community service, arts, and media occupations (%)
Most Common Occupations - Community and social service occupations (%)
Most Common Occupations - Legal occupations (%)
Most Common Occupations - Education, training, and library occupations (%)
Most Common Occupations - Arts, design, entertainment, sports, and media occupations (%)
Most Common Occupations - Healthcare practitioners and technical occupations (%)
Most Common Occupations - Health diagnosing and treating practitioners and other technical occupations (%)
Most Common Occupations - Health technologists and technicians (%)
Most Common Occupations - Service occupations (%)
Most Common Occupations - Healthcare support occupations (%)
Most Common Occupations - Protective service occupations (%)
Most Common Occupations - Fire fighting and prevention, and other protective service workers including supervisors (%)
Most Common Occupations - Law enforcement workers including supervisors (%)
Most Common Occupations - Food preparation and serving related occupations (%)
Most Common Occupations - Building and grounds cleaning and maintenance occupations (%)
Most Common Occupations - Personal care and service occupations (%)
Most Common Occupations - Sales and office occupations (%)
Most Common Occupations - Sales and related occupations (%)
Most Common Occupations - Office and administrative support occupations (%)
Most Common Occupations - Natural resources, construction, and maintenance occupations (%)
Most Common Occupations - Farming, fishing, and forestry occupations (%)
Most Common Occupations - Construction and extraction occupations (%)
Most Common Occupations - Installation, maintenance, and repair occupations (%)
Most Common Occupations - Production, transportation, and material moving occupations (%)
Most Common Occupations - Production occupations (%)
Most Common Occupations - Transportation occupations (%)
Most Common Occupations - Material moving occupations (%)
Private vehicle occupancy - Drove alone (% change since 2000)
Private vehicle occupancy - Carpooled (%)
Private vehicle occupancy - Carpooled (% change since 2000)
Private vehicle occupancy - In 2-person carpool (%)
Private vehicle occupancy - In 2-person carpool (% change since 2000)
Private vehicle occupancy - In 3-person carpool (%)
Private vehicle occupancy - In 3-person carpool (% change since 2000)
Private vehicle occupancy - In 4-person carpool (%)
Private vehicle occupancy - In 4-person carpool (% change since 2000)
Private vehicle occupancy - In 5- or 6-person carpool (%)
Private vehicle occupancy - In 5- or 6-person carpool (% change since 2000)
Private vehicle occupancy - In 7-or-more-person carpool (%)
Private vehicle occupancy - In 7-or-more-person carpool (% change since 2000)
Time Leaving Home To Go To Work - 12:00 a.m. to 4:59 a.m. (%)
Time Leaving Home To Go To Work - 12:00 a.m. to 4:59 a.m. (% change since 2000)
Time Leaving Home To Go To Work - 5:00 a.m. to 5:59 a.m. (%)
Time Leaving Home To Go To Work - 5:00 a.m. to 5:59 a.m. (% change since 2000)
Time Leaving Home To Go To Work - 6:00 a.m. to 6:59 a.m. (%)
Time Leaving Home To Go To Work - 6:00 a.m. to 6:59 a.m. (% change since 2000)
Time Leaving Home To Go To Work - 7:00 a.m. to 7:59 a.m. (%)
Time Leaving Home To Go To Work - 7:00 a.m. to 7:59 a.m. (% change since 2000)
Time Leaving Home To Go To Work - 8:00 a.m. to 8:59 a.m. (%)
Time Leaving Home To Go To Work - 8:00 a.m. to 8:59 a.m. (% change since 2000)
Time Leaving Home To Go To Work - 9:00 a.m. to 9:59 a.m. (%)
Time Leaving Home To Go To Work - 9:00 a.m. to 9:59 a.m. (% change since 2000)
Time Leaving Home To Go To Work - 10:00 a.m. to 10:59 a.m. (%)
Time Leaving Home To Go To Work - 10:00 a.m. to 10:59 a.m. (% change since 2000)
Time Leaving Home To Go To Work - 11:00 a.m. to 11:59 a.m. (%)
Time Leaving Home To Go To Work - 11:00 a.m. to 11:59 a.m. (% change since 2000)
Time Leaving Home To Go To Work - 12:00 p.m. to 3:59 p.m. (%)
Time Leaving Home To Go To Work - 12:00 p.m. to 3:59 p.m. (% change since 2000)
Time Leaving Home To Go To Work - 4:00 p.m. to 11:59 p.m. (%)
Time Leaving Home To Go To Work - 4:00 p.m. to 11:59 p.m. (% change since 2000)
Class of Workers - Employee of private company (%)
Class of Workers - Employee of private company (% change since 2000)
Class of Workers - Self-employed in own incorporated business (%)
Class of Workers - Self-employed in own incorporated business (% change since 2000)
Class of Workers - Private not-for-profit wage and salary workers (%)
Class of Workers - Private not-for-profit wage and salary workers (% change since 2000)
Class of Workers - Local government workers (%)
Class of Workers - Local government workers (% change since 2000)
Class of Workers - State government workers (%)
Class of Workers - State government workers (% change since 2000)
Class of Workers - Federal government workers (%)
Class of Workers - Federal government workers (% change since 2000)
Class of Workers - Self-employed workers in own not incorporated business and Unpaid family workers (%)
Class of Workers - Self-employed workers in own not incorporated business and Unpaid family workers (% change since 2000)
Means of transportation to work - Drove car alone (%)
Means of transportation to work - Drove car alone (% change since 2000)
Means of transportation to work - Carpooled (%)
Means of transportation to work - Carpooled (% change since 2000)
Means of transportation to work - Public transportation (%)
Means of transportation to work - Public transportation (% change since 2000)
Means of transportation to work - Bus or trolley bus (%)
Means of transportation to work - Bus or trolley bus (% change since 2000)
Means of transportation to work - Streetcar or trolley car (%)
Means of transportation to work - Streetcar or trolley car (% change since 2000)
Means of transportation to work - Subway or elevated (%)
Means of transportation to work - Subway or elevated (% change since 2000)
Means of transportation to work - Railroad (%)
Means of transportation to work - Railroad (% change since 2000)
Means of transportation to work - Ferryboat (%)
Means of transportation to work - Ferryboat (% change since 2000)
Means of transportation to work - Taxicab (%)
Means of transportation to work - Taxicab (% change since 2000)
Means of transportation to work - Motorcycle (%)
Means of transportation to work - Motorcycle (% change since 2000)
Means of transportation to work - Bicycle (%)
Means of transportation to work - Bicycle (% change since 2000)
Means of transportation to work - Walked (%)
Means of transportation to work - Walked (% change since 2000)
Means of transportation to work - Other means (%)
Means of transportation to work - Other means (% change since 2000)
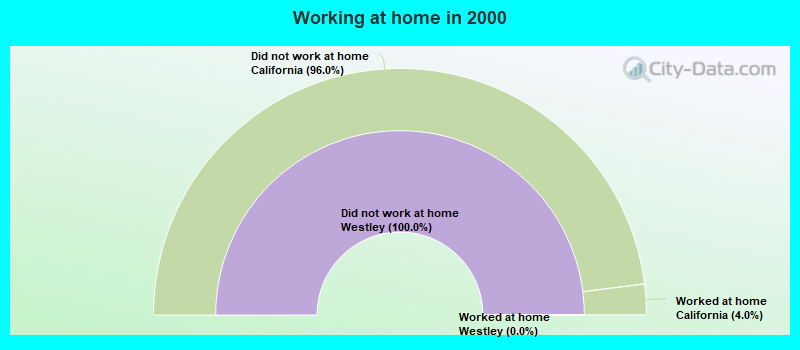
Working at home (%)
Working at home (% change since 2000)
Travel time to work - Less than 5 minutes (%)
Travel time to work - Less than 5 minutes (% change since 2000)
Travel time to work - 5 to 9 minutes (%)
Travel time to work - 5 to 9 minutes (% change since 2000)
Travel time to work - 10 to 19 minutes (%)
Travel time to work - 10 to 19 minutes (% change since 2000)
Travel time to work - 20 to 29 minutes (%)
Travel time to work - 20 to 29 minutes (% change since 2000)
Travel time to work - 30 to 39 minutes (%)
Travel time to work - 30 to 39 minutes (% change since 2000)
Travel time to work - 40 to 59 minutes (%)
Travel time to work - 40 to 59 minutes (% change since 2000)
Travel time to work - 60 to 89 minutes (%)
Travel time to work - 60 to 89 minutes (% change since 2000)
Travel time to work - 90 or more minutes (%)
Travel time to work - 90 or more minutes (% change since 2000)
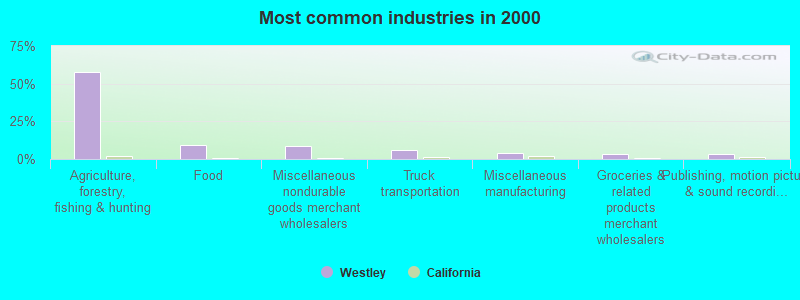
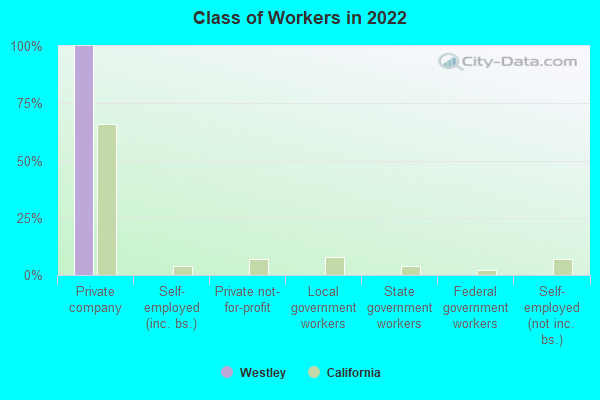
The most common industries in Westley are: Agriculture, forestry, fishing & hunting (58.0% of civilian employees), Food (9.1% of civilian employees), Miscellaneous nondurable goods merchant wholesalers (8.4% of civilian employees). 48.1% of workers work in Stanislaus County. 100.0% of workers are employees of private companies, which is 33.5% greater than the rate of 66.5% across the entire state of California.
Whole page based on the data from 2000 / 2022 when the population of Westley, California was 747 / 601
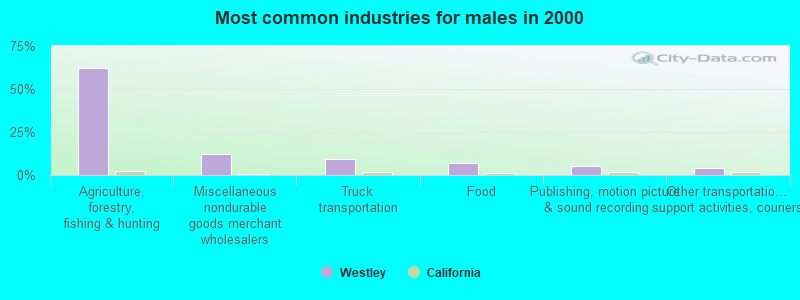
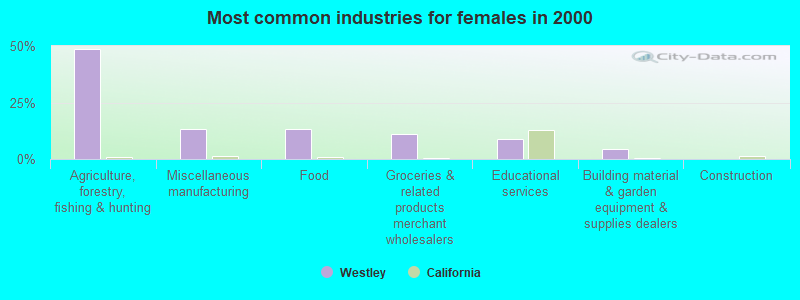
Most common industries
Most common industries Industry All Males Females
Agriculture, forestry, fishing and hunting 58.0% 62.2% 48.9% Food 9.1% 7.1% 13.3% Miscellaneous nondurable goods merchant wholesalers 8.4% 12.2% 0.0% Truck transportation 6.3% 9.2% 0.0% Miscellaneous manufacturing 4.2% 0.0% 13.3% Groceries and related products merchant wholesalers 3.5% 0.0% 11.1% Publishing, and motion picture and sound recording industries 3.5% 5.1% 0.0% Other transportation, and support activities, and couriers 2.8% 4.1% 0.0% Educational services 2.8% 0.0% 8.9% Building material and garden equipment and supplies dealers 1.4% 0.0% 4.4%
Unemployment in Westley Unemployment by race in 2022
Unemployment rate for American Indian and Alaska Native residents 100.0% FemalesUnemployment rate for two or more race residents 100.0% MalesUnemployment rate for Hispanic or Latino residents 47.9% Males55.7% FemalesUnemployment by race in 2000
Unemployment rate for other race residents 30.9% Males67.0% FemalesUnemployment rate for Hispanic or Latino residents 39.9% Males61.9% Females
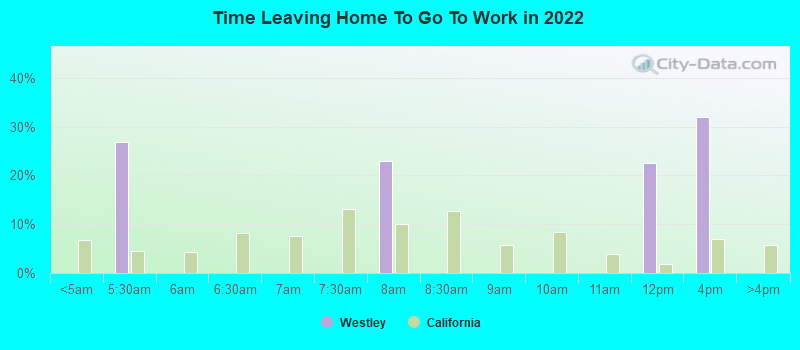
Time leaving home to go to work 5:00 a.m. to 5:29 a.m.: Westley:
26.9% (22)California:
4.5% (692,772)
7:30 a.m. to 7:59 a.m.: Westley:
23.0% (19)California:
10.1% (1,550,402)
11:00 a.m. to 11:59 a.m.: Westley:
22.4% (19)California:
1.8% (280,975)
12:00 p.m. to 3:59 p.m.: Westley:
32.0% (27)California:
7.0% (1,075,505)
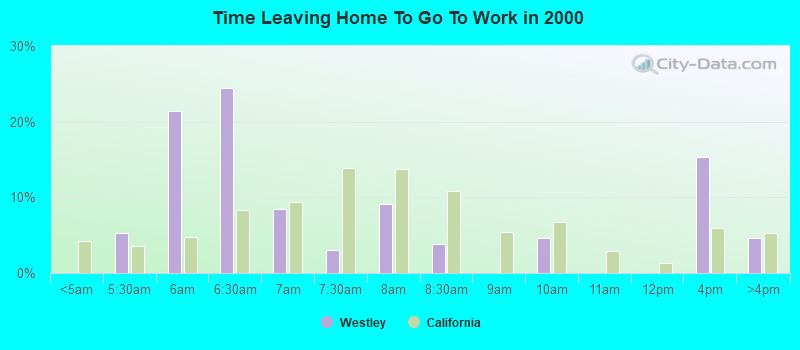
5:30am: Westley:
5.3% (7)California:
3.6% (523,209)
6am: Westley:
21.4% (28)California:
4.8% (692,256)
6:30am: Westley:
24.4% (32)California:
8.4% (1,216,867)
7am: Westley:
8.4% (11)California:
9.4% (1,362,830)
7:30am: Westley:
3.1% (4)California:
13.8% (2,006,950)
8am: Westley:
9.2% (12)California:
13.7% (1,986,831)
8:30am: Westley:
3.8% (5)California:
10.9% (1,577,815)
10am: Westley:
4.6% (6)California:
6.7% (972,355)
4pm: Westley:
15.3% (20)California:
6.0% (865,284)
>4pm: Westley:
4.6% (6)California:
5.3% (776,167)
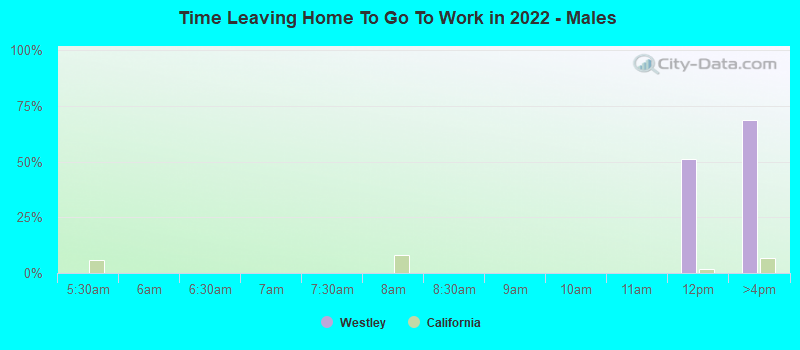
11:00 a.m. to 11:59 a.m. - Males: Westley:
51.2% (22)California:
1.7% (141,620)
12:00 p.m. to 3:59 p.m. - Males: Westley:
68.8% (30)California:
7.0% (594,847)
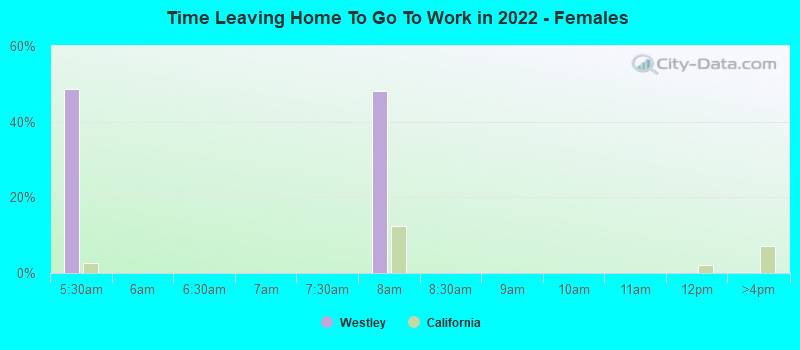
5:00 a.m. to 5:29 a.m. - Females: Westley:
48.6% (19)California:
2.7% (183,352)
7:30 a.m. to 7:59 a.m. - Females: Westley:
48.1% (19)California:
12.4% (847,675)
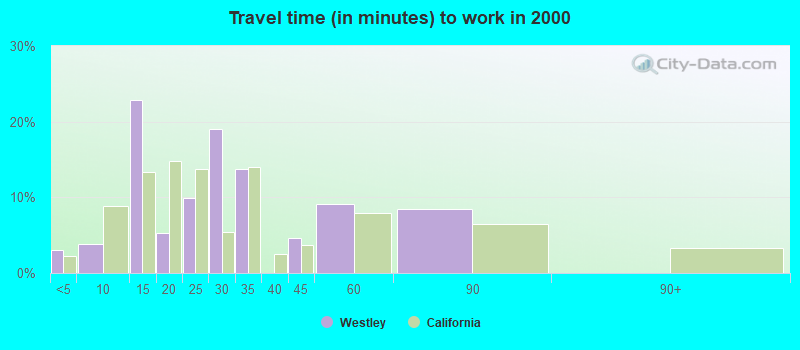
Travel time to work Percentage of workers working in this county: 48.1%
Less than 5 minutes: Westley:
3.1% (4)California:
2.2% (324,703)
5 to 9 minutes: Westley:
3.8% (5)California:
8.8% (1,280,443)
10 to 14 minutes: Westley:
22.9% (30)California:
13.3% (1,930,263)
15 to 19 minutes: Westley:
5.3% (7)California:
14.9% (2,157,970)
20 to 24 minutes: Westley:
9.9% (13)California:
13.8% (2,004,060)
25 to 29 minutes: Westley:
19.1% (25)California:
5.4% (782,241)
30 to 34 minutes: Westley:
13.7% (18)California:
13.9% (2,025,657)
40 to 44 minutes: Westley:
4.6% (6)California:
3.6% (528,043)
45 to 59 minutes: Westley:
9.2% (12)California:
7.9% (1,151,598)
60 to 89 minutes: Westley:
8.4% (11)California:
6.4% (933,123)
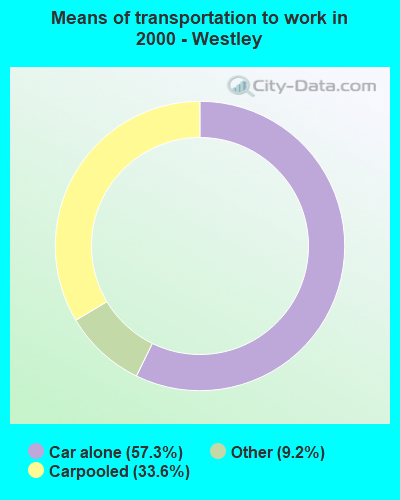
Means of transportation to work Drove car alone: Westley:
57.3% (75)California:
71.8% (10,432,462)
Carpooled: Westley:
33.6% (44)California:
14.5% (2,113,313)
Other means: Westley:
9.2% (12)California:
0.8% (115,064)
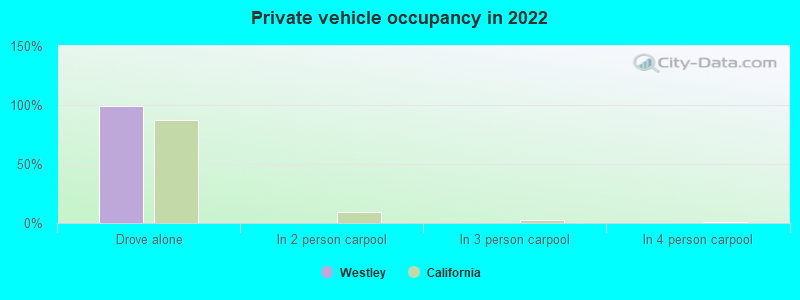
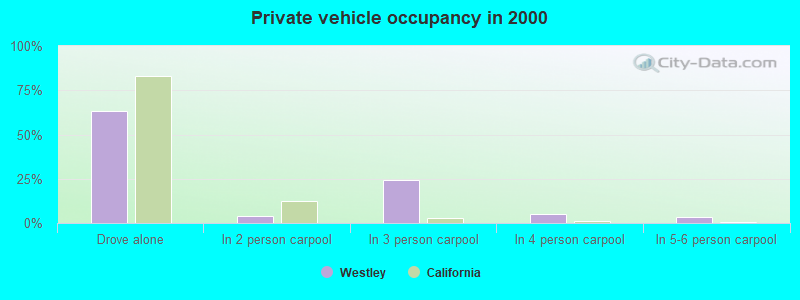
Private vehicle occupancy Drove alone: Westley:
99.3% (82)California:
86.9% (12,187,486)
Drove alone: Westley:
63.0% (75)California:
83.2% (10,432,462)
In 2 person carpool: Westley:
4.2% (5)California:
12.5% (1,564,905)
In 3 person carpool: Westley:
24.4% (29)California:
2.6% (330,732)
In 4 person carpool: Westley:
5.0% (6)California:
1.0% (119,364)
In 5-6 person carpool: Westley:
3.4% (4)California:
0.5% (57,036)
Class of workers
Employee of private company: Westley:
100.0% (84)California:
66.5% (12,596,030)
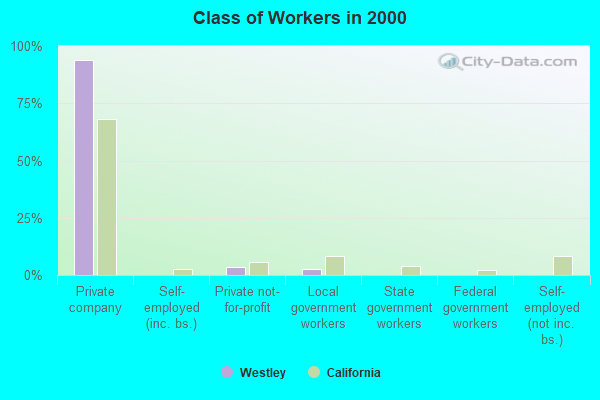
Employee of private company: Westley:
93.7% (134)California:
68.0% (10,009,465)
Private not-for-profit wage and salary workers: Westley:
3.5% (5)California:
5.7% (845,536)
Local government workers: Westley:
2.8% (4)California:
8.3% (1,218,764)
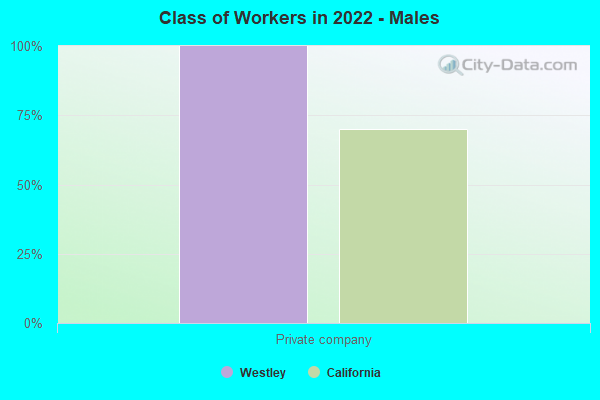
Employee of private company - Males: Westley:
100.0% (43)California:
70.3% (7,191,252)
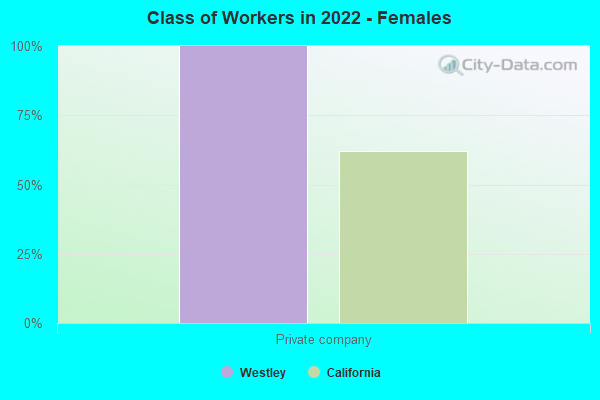
Employee of private company - Females: Westley:
100.0% (40)California:
62.0% (5,404,778)