Work and Jobs in Winchester, California (CA) Detailed Stats
Data:
Unemployment (%)
Unemployment (% change since 2000)
Unemployment (%) - White
Unemployment (% change since 2000) - White
Unemployment (%) - Black or African American
Unemployment (% change since 2000) - Black or African American
Unemployment (%) - Asian
Unemployment (% change since 2000) - Asian
Unemployment (%) - Hispanic or Latino
Unemployment (% change since 2000) - Hispanic or Latino
Unemployment (%) - American Indian and Alaska Native
Unemployment (% change since 2000) - American Indian and Alaska Native
Unemployment (%) - Multirace
Unemployment (% change since 2000) - Multirace
Unemployment (%) - Other Race
Unemployment (% change since 2000) - Other Race
Industry diversity
Most Common Industries - Agriculture, forestry, fishing and hunting, and mining (%)
Most Common Industries - Agriculture, forestry, fishing and hunting (%)
Most Common Industries - Mining, quarrying, and oil and gas extraction (%)
Most Common Industries - Construction (%)
Most Common Industries - Manufacturing (%)
Most Common Industries - Wholesale trade (%)
Most Common Industries - Retail trade (%)
Most Common Industries - Transportation and warehousing, and utilities (%)
Most Common Industries - Transportation and warehousing (%)
Most Common Industries - Utilities (%)
Most Common Industries - Information (%)
Most Common Industries - Finance and insurance, and real estate and rental and leasing (%)
Most Common Industries - Finance and insurance (%)
Most Common Industries - Real estate and rental and leasing (%)
Most Common Industries - Professional, scientific, and management, and administrative and waste management services (%)
Most Common Industries - Professional, scientific, and technical services (%)
Most Common Industries - Management of companies and enterprises (%)
Most Common Industries - Administrative and support and waste management services (%)
Most Common Industries - Educational services, and health care and social assistance (%)
Most Common Industries - Educational services (%)
Most Common Industries - Health care and social assistance (%)
Most Common Industries - Arts, entertainment, and recreation, and accommodation and food services (%)
Most Common Industries - Arts, entertainment, and recreation (%)
Most Common Industries - Accommodation and food services (%)
Most Common Industries - Other services, except public administration (%)
Most Common Industries - Public administration (%)
Occupation diversity
Most Common Occupations - Management, business, science, and arts occupations (%)
Most Common Occupations - Management, business, and financial occupations (%)
Most Common Occupations - Management occupations (%)
Most Common Occupations - Business and financial operations occupations (%)
Most Common Occupations - Computer, engineering, and science occupations (%)
Most Common Occupations - Computer and mathematical occupations (%)
Most Common Occupations - Architecture and engineering occupations (%)
Most Common Occupations - Life, physical, and social science occupations (%)
Most Common Occupations - Education, legal, community service, arts, and media occupations (%)
Most Common Occupations - Community and social service occupations (%)
Most Common Occupations - Legal occupations (%)
Most Common Occupations - Education, training, and library occupations (%)
Most Common Occupations - Arts, design, entertainment, sports, and media occupations (%)
Most Common Occupations - Healthcare practitioners and technical occupations (%)
Most Common Occupations - Health diagnosing and treating practitioners and other technical occupations (%)
Most Common Occupations - Health technologists and technicians (%)
Most Common Occupations - Service occupations (%)
Most Common Occupations - Healthcare support occupations (%)
Most Common Occupations - Protective service occupations (%)
Most Common Occupations - Fire fighting and prevention, and other protective service workers including supervisors (%)
Most Common Occupations - Law enforcement workers including supervisors (%)
Most Common Occupations - Food preparation and serving related occupations (%)
Most Common Occupations - Building and grounds cleaning and maintenance occupations (%)
Most Common Occupations - Personal care and service occupations (%)
Most Common Occupations - Sales and office occupations (%)
Most Common Occupations - Sales and related occupations (%)
Most Common Occupations - Office and administrative support occupations (%)
Most Common Occupations - Natural resources, construction, and maintenance occupations (%)
Most Common Occupations - Farming, fishing, and forestry occupations (%)
Most Common Occupations - Construction and extraction occupations (%)
Most Common Occupations - Installation, maintenance, and repair occupations (%)
Most Common Occupations - Production, transportation, and material moving occupations (%)
Most Common Occupations - Production occupations (%)
Most Common Occupations - Transportation occupations (%)
Most Common Occupations - Material moving occupations (%)
Private vehicle occupancy - Drove alone (% change since 2000)
Private vehicle occupancy - Carpooled (%)
Private vehicle occupancy - Carpooled (% change since 2000)
Private vehicle occupancy - In 2-person carpool (%)
Private vehicle occupancy - In 2-person carpool (% change since 2000)
Private vehicle occupancy - In 3-person carpool (%)
Private vehicle occupancy - In 3-person carpool (% change since 2000)
Private vehicle occupancy - In 4-person carpool (%)
Private vehicle occupancy - In 4-person carpool (% change since 2000)
Private vehicle occupancy - In 5- or 6-person carpool (%)
Private vehicle occupancy - In 5- or 6-person carpool (% change since 2000)
Private vehicle occupancy - In 7-or-more-person carpool (%)
Private vehicle occupancy - In 7-or-more-person carpool (% change since 2000)
Time Leaving Home To Go To Work - 12:00 a.m. to 4:59 a.m. (%)
Time Leaving Home To Go To Work - 12:00 a.m. to 4:59 a.m. (% change since 2000)
Time Leaving Home To Go To Work - 5:00 a.m. to 5:59 a.m. (%)
Time Leaving Home To Go To Work - 5:00 a.m. to 5:59 a.m. (% change since 2000)
Time Leaving Home To Go To Work - 6:00 a.m. to 6:59 a.m. (%)
Time Leaving Home To Go To Work - 6:00 a.m. to 6:59 a.m. (% change since 2000)
Time Leaving Home To Go To Work - 7:00 a.m. to 7:59 a.m. (%)
Time Leaving Home To Go To Work - 7:00 a.m. to 7:59 a.m. (% change since 2000)
Time Leaving Home To Go To Work - 8:00 a.m. to 8:59 a.m. (%)
Time Leaving Home To Go To Work - 8:00 a.m. to 8:59 a.m. (% change since 2000)
Time Leaving Home To Go To Work - 9:00 a.m. to 9:59 a.m. (%)
Time Leaving Home To Go To Work - 9:00 a.m. to 9:59 a.m. (% change since 2000)
Time Leaving Home To Go To Work - 10:00 a.m. to 10:59 a.m. (%)
Time Leaving Home To Go To Work - 10:00 a.m. to 10:59 a.m. (% change since 2000)
Time Leaving Home To Go To Work - 11:00 a.m. to 11:59 a.m. (%)
Time Leaving Home To Go To Work - 11:00 a.m. to 11:59 a.m. (% change since 2000)
Time Leaving Home To Go To Work - 12:00 p.m. to 3:59 p.m. (%)
Time Leaving Home To Go To Work - 12:00 p.m. to 3:59 p.m. (% change since 2000)
Time Leaving Home To Go To Work - 4:00 p.m. to 11:59 p.m. (%)
Time Leaving Home To Go To Work - 4:00 p.m. to 11:59 p.m. (% change since 2000)
Class of Workers - Employee of private company (%)
Class of Workers - Employee of private company (% change since 2000)
Class of Workers - Self-employed in own incorporated business (%)
Class of Workers - Self-employed in own incorporated business (% change since 2000)
Class of Workers - Private not-for-profit wage and salary workers (%)
Class of Workers - Private not-for-profit wage and salary workers (% change since 2000)
Class of Workers - Local government workers (%)
Class of Workers - Local government workers (% change since 2000)
Class of Workers - State government workers (%)
Class of Workers - State government workers (% change since 2000)
Class of Workers - Federal government workers (%)
Class of Workers - Federal government workers (% change since 2000)
Class of Workers - Self-employed workers in own not incorporated business and Unpaid family workers (%)
Class of Workers - Self-employed workers in own not incorporated business and Unpaid family workers (% change since 2000)
Means of transportation to work - Drove car alone (%)
Means of transportation to work - Drove car alone (% change since 2000)
Means of transportation to work - Carpooled (%)
Means of transportation to work - Carpooled (% change since 2000)
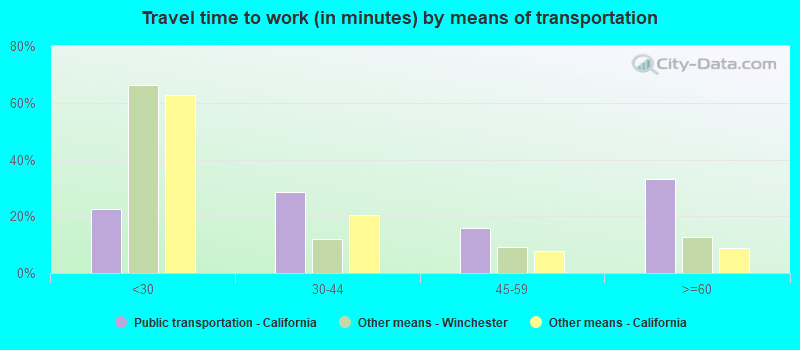
Means of transportation to work - Public transportation (%)
Means of transportation to work - Public transportation (% change since 2000)
Means of transportation to work - Bus or trolley bus (%)
Means of transportation to work - Bus or trolley bus (% change since 2000)
Means of transportation to work - Streetcar or trolley car (%)
Means of transportation to work - Streetcar or trolley car (% change since 2000)
Means of transportation to work - Subway or elevated (%)
Means of transportation to work - Subway or elevated (% change since 2000)
Means of transportation to work - Railroad (%)
Means of transportation to work - Railroad (% change since 2000)
Means of transportation to work - Ferryboat (%)
Means of transportation to work - Ferryboat (% change since 2000)
Means of transportation to work - Taxicab (%)
Means of transportation to work - Taxicab (% change since 2000)
Means of transportation to work - Motorcycle (%)
Means of transportation to work - Motorcycle (% change since 2000)
Means of transportation to work - Bicycle (%)
Means of transportation to work - Bicycle (% change since 2000)
Means of transportation to work - Walked (%)
Means of transportation to work - Walked (% change since 2000)
Means of transportation to work - Other means (%)
Means of transportation to work - Other means (% change since 2000)
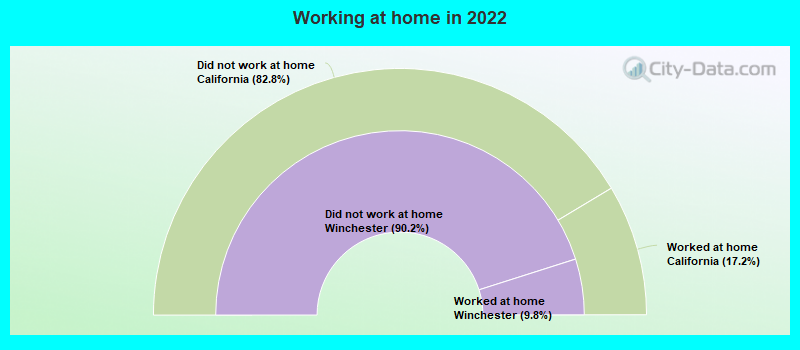
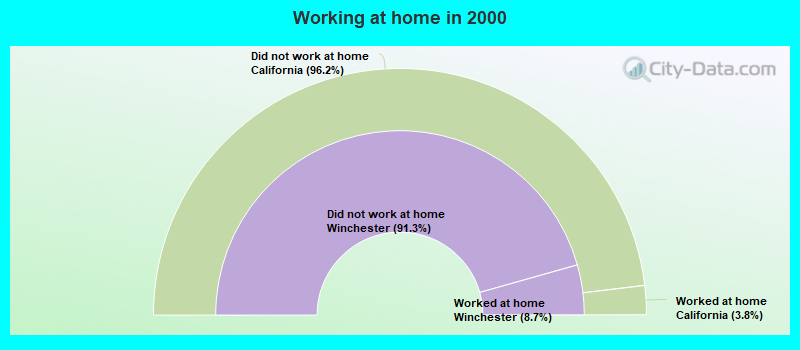
Working at home (%)
Working at home (% change since 2000)
Travel time to work - Less than 5 minutes (%)
Travel time to work - Less than 5 minutes (% change since 2000)
Travel time to work - 5 to 9 minutes (%)
Travel time to work - 5 to 9 minutes (% change since 2000)
Travel time to work - 10 to 19 minutes (%)
Travel time to work - 10 to 19 minutes (% change since 2000)
Travel time to work - 20 to 29 minutes (%)
Travel time to work - 20 to 29 minutes (% change since 2000)
Travel time to work - 30 to 39 minutes (%)
Travel time to work - 30 to 39 minutes (% change since 2000)
Travel time to work - 40 to 59 minutes (%)
Travel time to work - 40 to 59 minutes (% change since 2000)
Travel time to work - 60 to 89 minutes (%)
Travel time to work - 60 to 89 minutes (% change since 2000)
Travel time to work - 90 or more minutes (%)
Travel time to work - 90 or more minutes (% change since 2000)
Latest news about work in Winchester, CA collected exclusively by city-data.com from local newspapers, TV, and radio stations
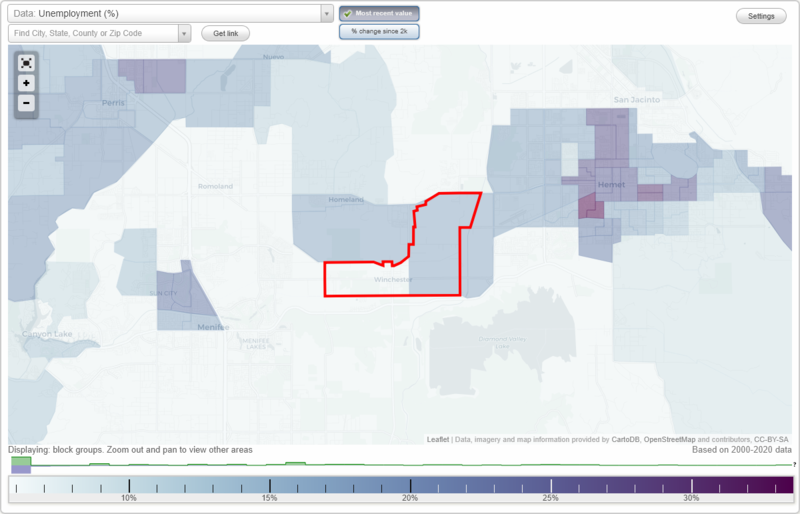
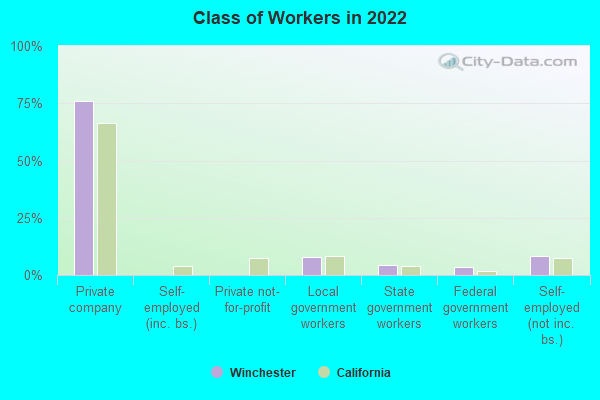
The most common industries in Winchester are: Construction (10.9% of civilian employees), Health care (9.6% of civilian employees), Administrative & support & waste management services (7.1% of civilian employees). 78.3% of workers work in Riverside County and 7.8% of all workers work at home. 76.1% of workers are employees of private companies, which is 12.6% greater than the rate of 66.5% across the entire state of California.
Whole page based on the data from 2000 / 2022 when the population of Winchester, California was 2,155 / 2,970
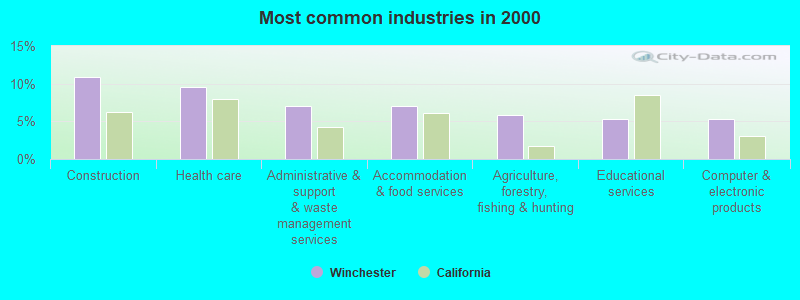
Most common industries
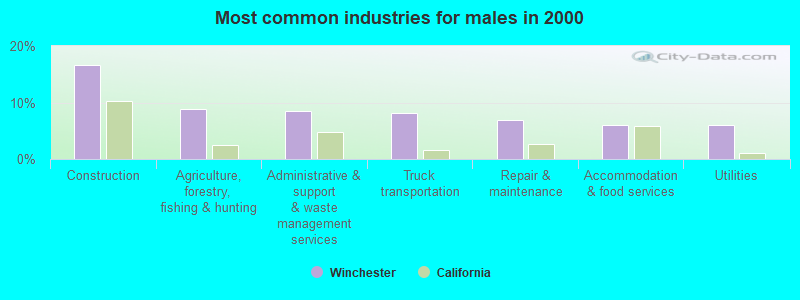
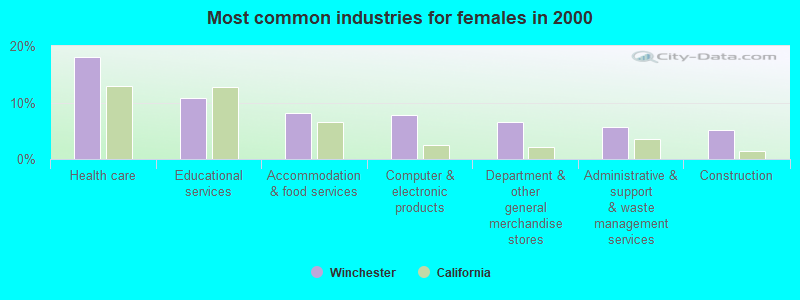
Most common industries Industry All Males Females
Construction 10.9% 16.6% 5.1% Health care 9.6% 1.3% 18.1% Administrative and support and waste management services 7.1% 8.4% 5.7% Accommodation and food services 7.1% 6.0% 8.1% Agriculture, forestry, fishing and hunting 5.9% 8.9% 2.9% Educational services 5.3% 0.0% 10.8% Computer and electronic products 5.3% 3.0% 7.7% Truck transportation 5.0% 8.2% 1.8% Department and other general merchandise stores 4.4% 2.2% 6.6% Repair and maintenance 4.4% 6.9% 1.8% Food and beverage stores 3.5% 2.2% 4.8% Machinery 3.2% 2.4% 4.0% Utilities 3.1% 6.0% 0.0% Professional, scientific, and technical services 2.5% 0.0% 5.1% Other transportation, and support activities, and couriers 2.5% 3.2% 1.8% Miscellaneous manufacturing 2.2% 0.0% 4.4% Miscellaneous nondurable goods merchant wholesalers 2.0% 0.0% 4.0% Metal and metal products 1.7% 3.5% 0.0% Building material and garden equipment and supplies dealers 1.6% 3.2% 0.0% Real estate and rental and leasing 1.4% 2.8% 0.0% Nonmetallic mineral products 1.4% 2.8% 0.0% Motor vehicle and parts dealers 1.4% 2.8% 0.0% Finance and insurance 1.3% 0.0% 2.6% Groceries and related products merchant wholesalers 1.2% 2.4% 0.0% Publishing, and motion picture and sound recording industries 1.1% 0.0% 2.2% Social assistance 0.9% 0.0% 1.8% Plastics and rubber products 0.8% 1.5% 0.0% Arts, entertainment, and recreation 0.8% 1.5% 0.0% Electrical and electronic goods merchant wholesalers 0.8% 1.5% 0.0% U. S. Postal service 0.7% 1.3% 0.0% Public administration 0.7% 1.3% 0.0% Book stores and news dealers 0.4% 0.0% 0.9%
Unemployment in Winchester Unemployment by race in 2022
Unemployment rate for White non-Hispanic residents 9.9% FemalesUnemployment rate for Asian residents 32.9% FemalesUnemployment rate for Hispanic or Latino residents 4.5% FemalesUnemployment by race in 2000
Unemployment rate for White non-Hispanic residents 11.6% Males5.9% FemalesUnemployment rate for American Indian and Alaska Native residents 42.1% FemalesUnemployment rate for Hispanic or Latino residents 12.2% Males20.0% Females
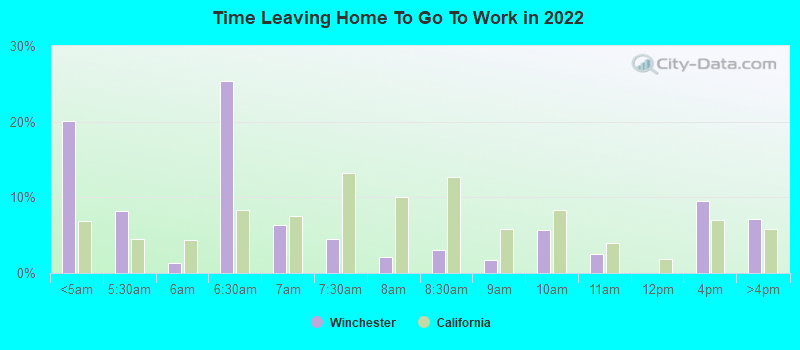
Time leaving home to go to work 12:00 a.m. to 4:59 a.m.: Winchester:
20.1% (216)California:
6.8% (1,050,902)
5:00 a.m. to 5:29 a.m.: Winchester:
8.2% (88)California:
4.5% (692,772)
5:30 a.m. to 5:59 a.m.: Winchester:
1.3% (14)California:
4.3% (665,475)
6:00 a.m. to 6:29 a.m.: Winchester:
25.4% (273)California:
8.3% (1,273,588)
6:30 a.m. to 6:59 a.m.: Winchester:
6.3% (68)California:
7.5% (1,156,338)
7:00 a.m. to 7:29 a.m.: Winchester:
4.5% (49)California:
13.2% (2,027,702)
7:30 a.m. to 7:59 a.m.: Winchester:
2.1% (23)California:
10.1% (1,550,402)
8:00 a.m. to 8:29 a.m.: Winchester:
3.1% (33)California:
12.7% (1,953,986)
8:30 a.m. to 8:59 a.m.: Winchester:
1.7% (18)California:
5.8% (890,950)
9:00 a.m. to 9:59 a.m.: Winchester:
5.6% (60)California:
8.4% (1,288,499)
10:00 a.m. to 10:59 a.m.: Winchester:
2.5% (27)California:
4.0% (613,193)
12:00 p.m. to 3:59 p.m.: Winchester:
9.6% (103)California:
7.0% (1,075,505)
4:00 p.m. to 11:59 p.m.: Winchester:
7.2% (77)California:
5.8% (891,240)
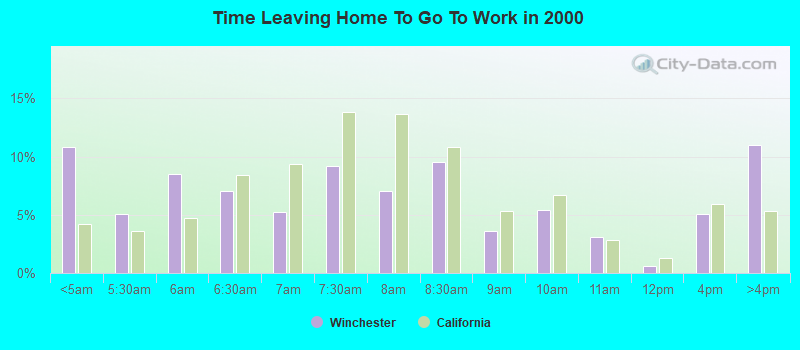
<5am: Winchester:
10.8% (95)California:
4.2% (606,086)
5:30am: Winchester:
5.1% (45)California:
3.6% (523,209)
6am: Winchester:
8.5% (75)California:
4.8% (692,256)
6:30am: Winchester:
7.0% (62)California:
8.4% (1,216,867)
7am: Winchester:
5.2% (46)California:
9.4% (1,362,830)
7:30am: Winchester:
9.2% (81)California:
13.8% (2,006,950)
8am: Winchester:
7.0% (62)California:
13.7% (1,986,831)
8:30am: Winchester:
9.5% (84)California:
10.9% (1,577,815)
9am: Winchester:
3.6% (32)California:
5.4% (778,152)
10am: Winchester:
5.4% (48)California:
6.7% (972,355)
11am: Winchester:
3.1% (27)California:
2.9% (414,479)
12pm: Winchester:
0.6% (5)California:
1.3% (189,005)
4pm: Winchester:
5.1% (45)California:
6.0% (865,284)
>4pm: Winchester:
11.0% (97)California:
5.3% (776,167)
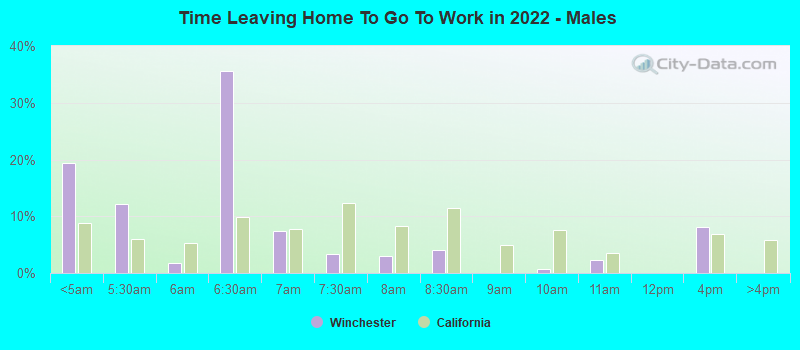
12:00 a.m. to 4:59 a.m. - Males: Winchester:
19.4% (145)California:
8.7% (747,612)
5:00 a.m. to 5:29 a.m. - Males: Winchester:
12.2% (91)California:
6.0% (509,420)
5:30 a.m. to 5:59 a.m. - Males: Winchester:
1.8% (14)California:
5.2% (448,269)
6:00 a.m. to 6:29 a.m. - Males: Winchester:
35.6% (267)California:
9.8% (842,941)
6:30 a.m. to 6:59 a.m. - Males: Winchester:
7.4% (55)California:
7.7% (657,557)
7:00 a.m. to 7:29 a.m. - Males: Winchester:
3.3% (25)California:
12.4% (1,058,532)
7:30 a.m. to 7:59 a.m. - Males: Winchester:
2.9% (22)California:
8.2% (702,727)
8:00 a.m. to 8:29 a.m. - Males: Winchester:
4.1% (31)California:
11.5% (984,538)
9:00 a.m. to 9:59 a.m. - Males: Winchester:
0.7% (5)California:
7.7% (655,038)
10:00 a.m. to 10:59 a.m. - Males: Winchester:
2.2% (17)California:
3.5% (301,425)
12:00 p.m. to 3:59 p.m. - Males: Winchester:
8.0% (60)California:
7.0% (594,847)
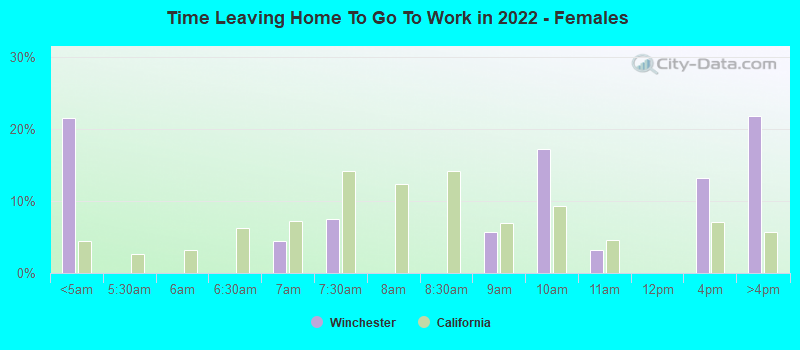
12:00 a.m. to 4:59 a.m. - Females: Winchester:
21.6% (70)California:
4.4% (303,290)
6:30 a.m. to 6:59 a.m. - Females: Winchester:
4.5% (14)California:
7.3% (498,781)
7:00 a.m. to 7:29 a.m. - Females: Winchester:
7.4% (24)California:
14.1% (969,170)
8:30 a.m. to 8:59 a.m. - Females: Winchester:
5.7% (18)California:
6.9% (476,135)
9:00 a.m. to 9:59 a.m. - Females: Winchester:
17.2% (56)California:
9.2% (633,461)
10:00 a.m. to 10:59 a.m. - Females: Winchester:
3.2% (10)California:
4.5% (311,768)
12:00 p.m. to 3:59 p.m. - Females: Winchester:
13.2% (43)California:
7.0% (480,658)
4:00 p.m. to 11:59 p.m. - Females: Winchester:
21.8% (71)California:
5.7% (391,769)
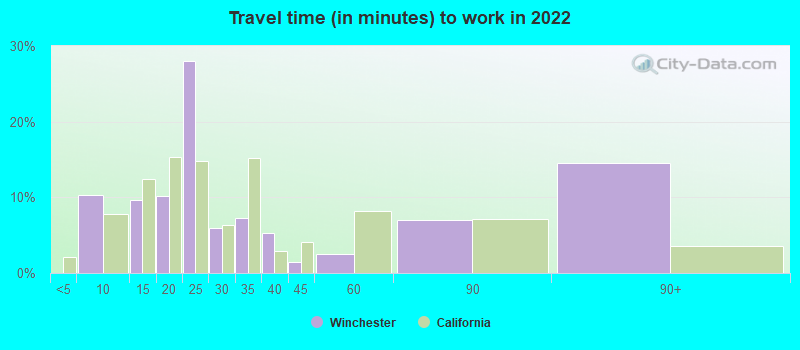
Travel time to work Percentage of workers working in this county: 78.3%Number of people working at home: 92 (7.8% of all workers )
5 to 9 minutes: Winchester:
10.3% (75)California:
7.8% (1,208,682)
10 to 14 minutes: Winchester:
9.7% (70)California:
12.4% (1,917,610)
15 to 19 minutes: Winchester:
10.2% (74)California:
15.3% (2,367,483)
20 to 24 minutes: Winchester:
28.0% (204)California:
14.8% (2,279,693)
25 to 29 minutes: Winchester:
6.0% (43)California:
6.4% (981,997)
30 to 34 minutes: Winchester:
7.3% (53)California:
15.2% (2,339,223)
35 to 39 minutes: Winchester:
5.2% (38)California:
2.9% (453,226)
40 to 44 minutes: Winchester:
1.5% (11)California:
4.1% (637,781)
45 to 59 minutes: Winchester:
2.5% (18)California:
8.2% (1,259,482)
60 to 89 minutes: Winchester:
7.0% (51)California:
7.2% (1,111,698)
90 or more minutes: Winchester:
14.5% (106)California:
3.6% (552,805)
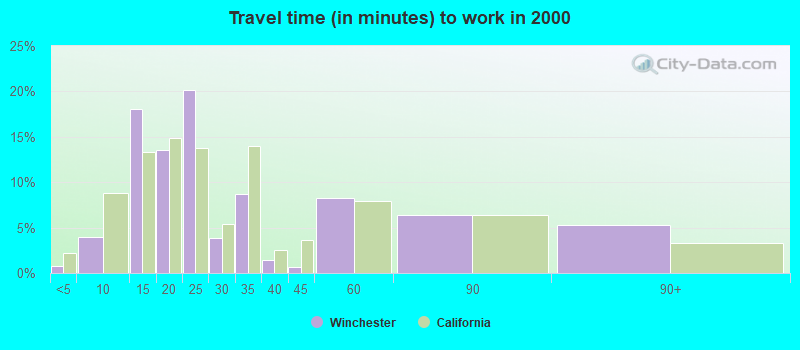
Less than 5 minutes: Winchester:
0.8% (7)California:
2.2% (324,703)
5 to 9 minutes: Winchester:
4.0% (35)California:
8.8% (1,280,443)
10 to 14 minutes: Winchester:
18.0% (159)California:
13.3% (1,930,263)
15 to 19 minutes: Winchester:
13.5% (119)California:
14.9% (2,157,970)
20 to 24 minutes: Winchester:
20.2% (178)California:
13.8% (2,004,060)
25 to 29 minutes: Winchester:
3.9% (34)California:
5.4% (782,241)
30 to 34 minutes: Winchester:
8.7% (77)California:
13.9% (2,025,657)
35 to 39 minutes: Winchester:
1.5% (13)California:
2.5% (366,487)
40 to 44 minutes: Winchester:
0.7% (6)California:
3.6% (528,043)
45 to 59 minutes: Winchester:
8.3% (73)California:
7.9% (1,151,598)
60 to 89 minutes: Winchester:
6.4% (56)California:
6.4% (933,123)
90 or more minutes: Winchester:
5.3% (47)California:
3.3% (483,698)
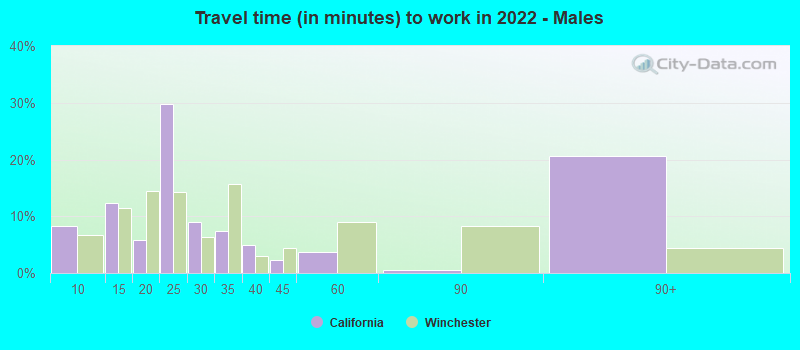
5 to 9 minutes - Males: Winchester:
8.3% (40)California:
6.8% (580,822)
10 to 14 minutes - Males: Winchester:
12.3% (60)California:
11.4% (974,497)
15 to 19 minutes - Males: Winchester:
5.7% (28)California:
14.5% (1,239,386)
20 to 24 minutes - Males: Winchester:
29.8% (146)California:
14.3% (1,223,429)
25 to 29 minutes - Males: Winchester:
8.9% (44)California:
6.4% (545,844)
30 to 34 minutes - Males: Winchester:
7.4% (36)California:
15.8% (1,352,210)
35 to 39 minutes - Males: Winchester:
4.9% (24)California:
3.0% (253,732)
40 to 44 minutes - Males: Winchester:
2.3% (11)California:
4.4% (376,144)
45 to 59 minutes - Males: Winchester:
3.6% (18)California:
8.9% (762,659)
60 to 89 minutes - Males: Winchester:
0.5% (2)California:
8.3% (711,394)
90 or more minutes - Males: Winchester:
20.6% (101)California:
4.4% (378,954)
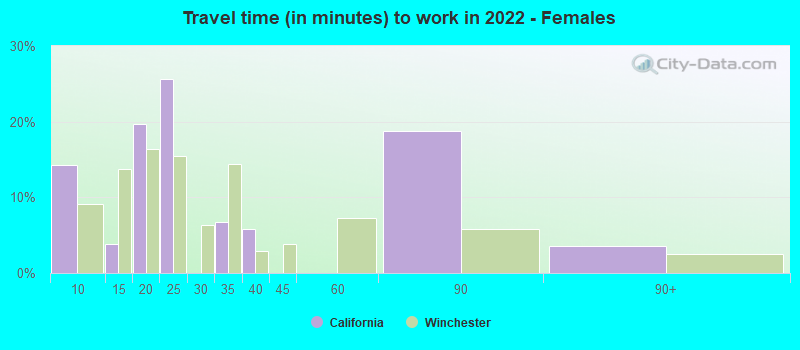
5 to 9 minutes - Females: Winchester:
14.3% (34)California:
9.2% (627,860)
10 to 14 minutes - Females: Winchester:
3.8% (9)California:
13.7% (943,113)
15 to 19 minutes - Females: Winchester:
19.7% (47)California:
16.4% (1,128,097)
20 to 24 minutes - Females: Winchester:
25.7% (61)California:
15.4% (1,056,264)
30 to 34 minutes - Females: Winchester:
6.8% (16)California:
14.4% (987,013)
35 to 39 minutes - Females: Winchester:
5.8% (14)California:
2.9% (199,494)
60 to 89 minutes - Females: Winchester:
18.8% (45)California:
5.8% (400,304)
90 or more minutes - Females: Winchester:
3.5% (8)California:
2.5% (173,851)
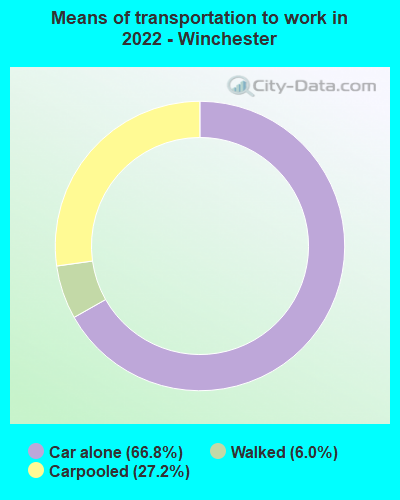
Means of transportation to work Drove car alone: Winchester:
66.8% (518)California:
79.1% (5,345,368)
Carpooled: Winchester:
27.2% (211)California:
11.9% (878,699)
Walked: Winchester:
6.0% (47)California:
2.9% (218,374)
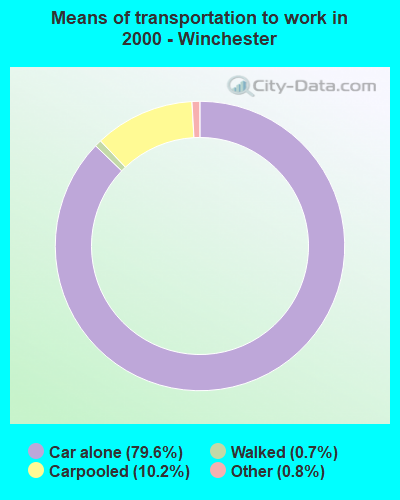
Drove car alone: Winchester:
79.6% (701)California:
71.8% (10,432,462)
Carpooled: Winchester:
10.2% (90)California:
14.5% (2,113,313)
Walked: Winchester:
0.7% (6)California:
2.9% (414,581)
Other means: Winchester:
0.8% (7)California:
0.8% (115,064)
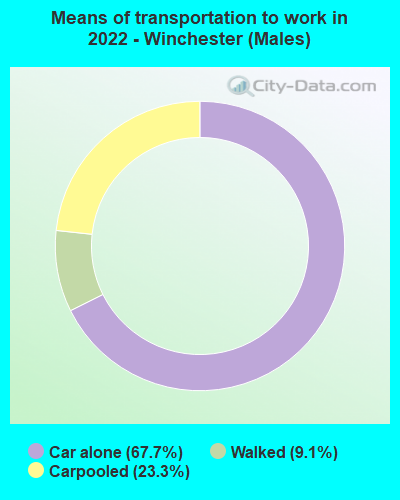
Drove car alone - Males: Winchester:
67.7% (350)California:
80.0% (5,345,368)
Carpooled - Males: Winchester:
23.3% (121)California:
11.1% (878,699)
Walked - Males: Winchester:
9.1% (47)California:
2.7% (218,374)
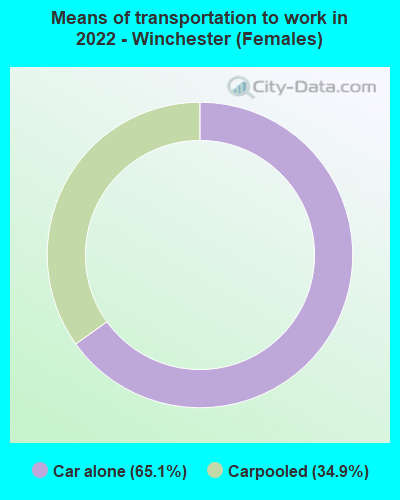
Drove car alone - Females: Winchester:
65.1% (168)California:
77.9% (5,345,368)
Carpooled - Females: Winchester:
34.9% (90)California:
12.8% (878,699)
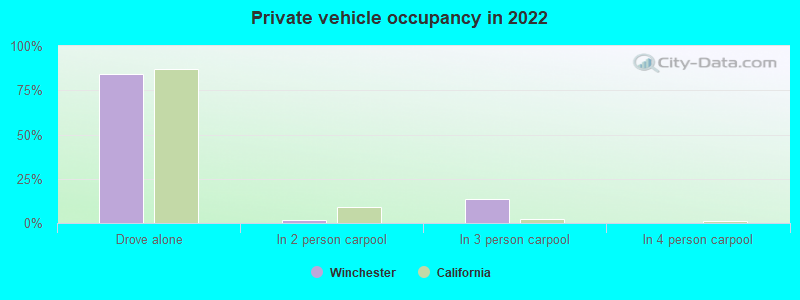
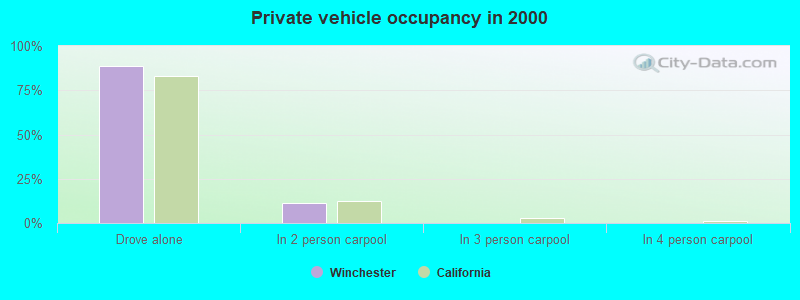
Private vehicle occupancy Drove alone: Winchester:
84.1% (904)California:
86.9% (12,187,486)
In 2 person carpool: Winchester:
1.7% (18)California:
9.2% (1,295,561)
In 3 person carpool: Winchester:
13.3% (143)California:
2.2% (309,969)
Drove alone: Winchester:
88.6% (701)California:
83.2% (10,432,462)
In 2 person carpool: Winchester:
11.4% (90)California:
12.5% (1,564,905)
Class of workers
Employee of private company: Winchester:
76.1% (932)California:
66.5% (12,596,030)
Local government workers: Winchester:
7.9% (97)California:
8.2% (1,547,056)
State government workers: Winchester:
4.3% (52)California:
4.1% (780,915)
Federal government workers: Winchester:
3.3% (41)California:
2.0% (369,858)
Self-employed workers in own not incorporated business: Winchester:
8.4% (102)California:
7.4% (1,410,735)
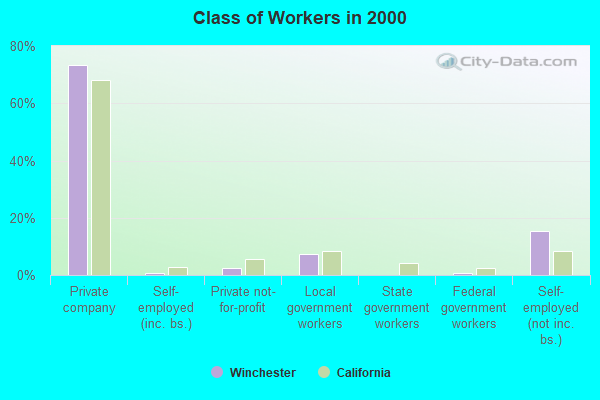
Employee of private company: Winchester:
73.5% (674)California:
68.0% (10,009,465)
Self-employed in own incorporated business: Winchester:
0.8% (7)California:
2.7% (402,392)
Private not-for-profit wage and salary workers: Winchester:
2.3% (21)California:
5.7% (845,536)
Local government workers: Winchester:
7.3% (67)California:
8.3% (1,218,764)
Federal government workers: Winchester:
0.7% (6)California:
2.3% (344,354)
Self-employed workers in own not incorporated business: Winchester:
15.5% (142)California:
8.5% (1,249,530)
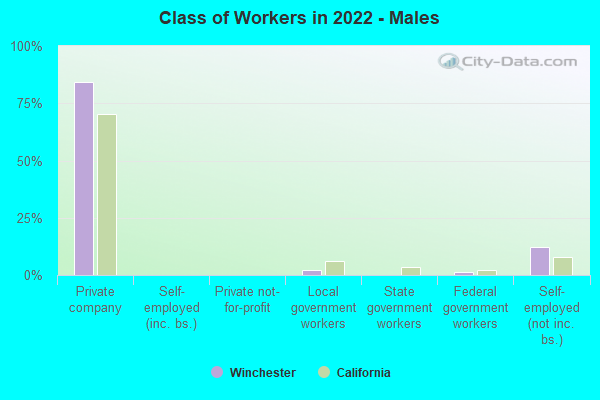
Employee of private company - Males: Winchester:
84.5% (713)California:
70.3% (7,191,252)
Local government workers - Males: Winchester:
2.0% (17)California:
6.0% (610,331)
Federal government workers - Males: Winchester:
1.4% (12)California:
2.1% (209,874)
Self-employed workers in own not incorporated business - Males: Winchester:
12.1% (102)California:
8.1% (824,359)
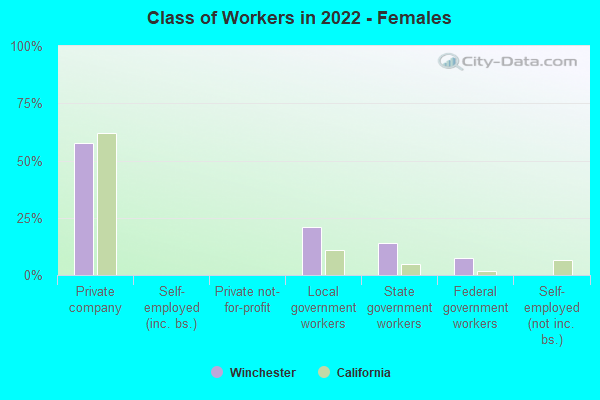
Employee of private company - Females: Winchester:
57.6% (219)California:
62.0% (5,404,778)
Local government workers - Females: Winchester:
21.1% (80)California:
10.8% (936,725)
State government workers - Females: Winchester:
13.8% (52)California:
5.0% (437,279)
Federal government workers - Females: Winchester:
7.6% (29)California:
1.8% (159,984)