Estimated zip code population in 2022: 3,697 Zip code population in 2010: 3,609 Zip code population in 2000: 3,348
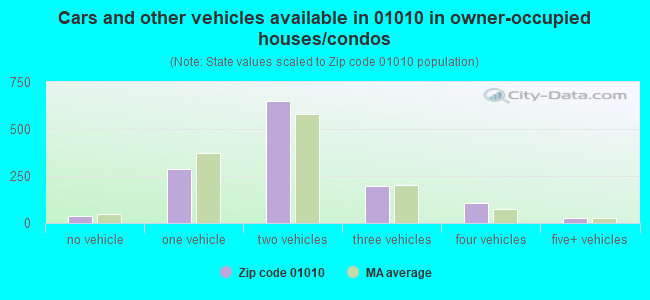
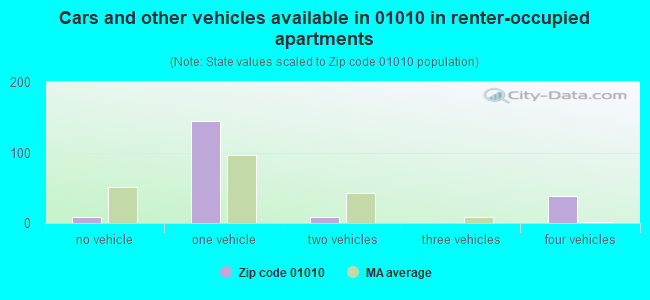
Houses and condos: 1,672 Renter-occupied apartments: 202
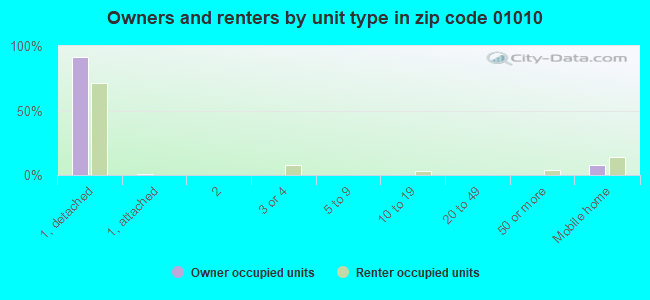
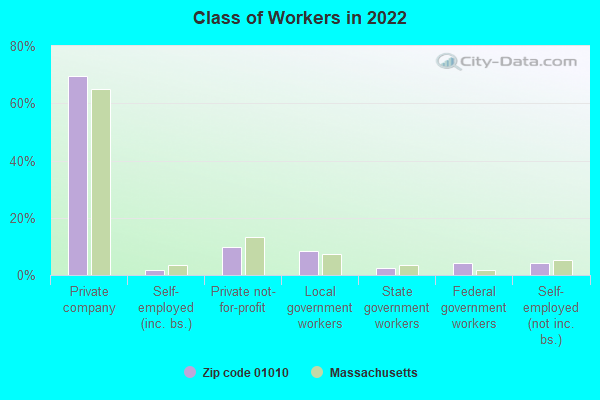
% of renters here:
13%
State:
38%
March 2022 cost of living index in zip code 01010: 110.8 (more than average, U.S. average is 100)
Land area: 34.7 sq. mi. Water area: 0.5 sq. mi.
Population density: 106 people per square mile
(very low).
OSM Map
Google Map
MSN Map
OSM Map
General Map
Google Map
MSN Map
OSM Map
Google Map
MSN Map
OSM Map
Google Map
MSN Map
Please wait while loading the map...
Real estate property taxes paid for housing units in 2022:
This zip code:
1.2% ($4,685)
Massachusetts:
1.0% ($5,536)
Median real estate property taxes paid for housing units with mortgages in 2022: $4,483 (1.1%) Median real estate property taxes paid for housing units with no mortgage in 2022: $4,913 (1.2%)
Business Search- 14 Million verified businesses
Males: 2,037
(55.1%)
Females: 1,660
(44.9%)
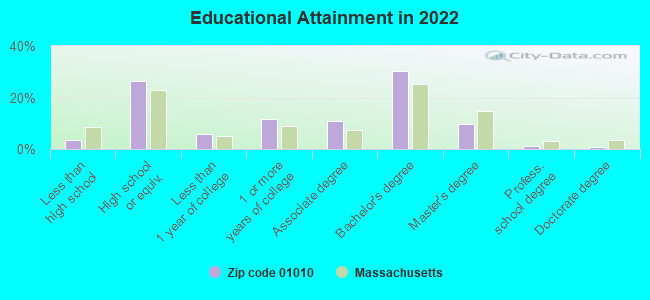
For population 25 years and over in 01010:
High school or higher: 96.2%
Bachelor's degree or higher: 42.0%
Graduate or professional degree: 11.8%
Unemployed: 2.2%
Mean travel time to work (commute): 32.9 minutes
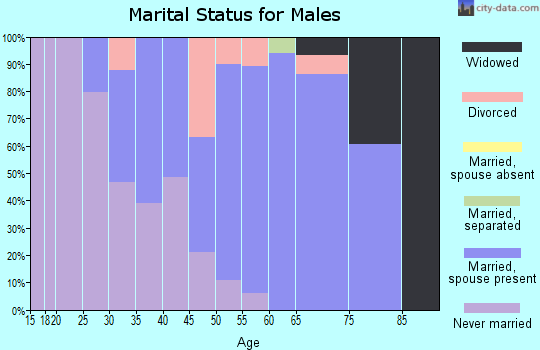
For population 15 years and over in 01010:
Never married: 26.1%
Now married: 58.8%
Separated: 0.0%
Widowed: 5.0%
Divorced: 10.1%
Zip code 01010 compared to state average:
Unemployed percentage below state average.
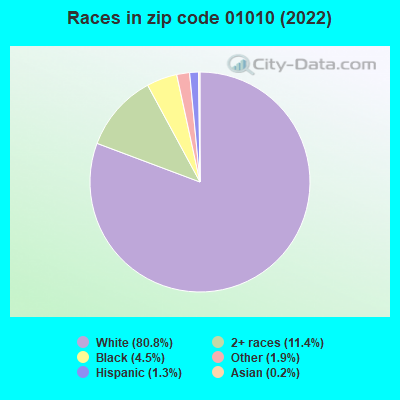
Hispanic race population percentage significantly below state average.
Median age above state average.
Foreign-born population percentage significantly below state average.
Renting percentage significantly below state average.
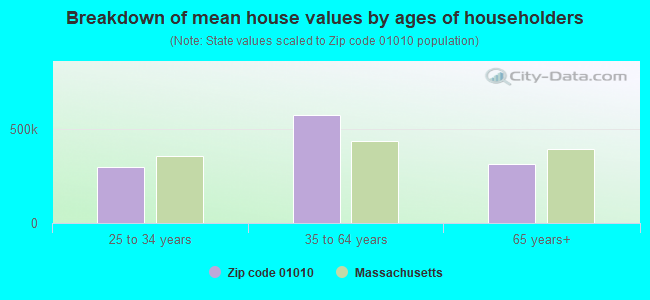
Estimated median house/condo value in 2022: $392,710
01010:
$392,710
Massachusetts:
$534,700
According to our research of Massachusetts and other state lists, there were 2 registered sex offenders living in 01010 zip code as of April 25, 2024. The ratio of all residents to sex offenders in zip code 01010 is 1,886 to 1. The ratio of registered sex offenders to all residents in this zip code is lower than the state average.
Median resident age:
This zip code:
46.1 years
Massachusetts median age:
40.3 years
Average household size:
This zip code:
2.4 people
Massachusetts:
2.4 people
Averages for the 2020 tax year for zip code 01010, filed in 2021:
Average Adjusted Gross Income (AGI) in 2020: $78,619 (Individual Income Tax Returns)
Here:
$78,619
State:
$105,130
Salary/wage: $69,051 (reported on 82.3% of returns)
Here:
$69,051
State:
$82,951
(% of AGI for various income ranges: 1057.8% for AGIs below $25k, 3260.4% for AGIs $25k-50k, 6558.6% for AGIs $50k-75k, 10689.3% for AGIs $75k-100k, 20193.9% for AGIs $100k-200k, 80663.3% for AGIs over 200k)
Taxable interest for individuals: $672 (reported on 44.9% of returns)
This zip code:
$672
Massachusetts:
$2,361
(% of AGI for various income ranges: 25.0% for AGIs below $25k, 28.9% for AGIs $25k-50k, 35.5% for AGIs $50k-75k, 34.3% for AGIs $75k-100k, 76.5% for AGIs $100k-200k, 450.0% for AGIs over 200k)
Ordinary dividends: $4,016 (reported on 21.7% of returns)
Here:
$4,016
State:
$10,365
(% of AGI for various income ranges: 22.8% for AGIs below $25k, 73.2% for AGIs $25k-50k, 90.5% for AGIs $50k-75k, 94.3% for AGIs $75k-100k, 242.2% for AGIs $100k-200k, 1870.0% for AGIs over 200k)
Net capital gain/loss in AGI: +$10,927 (reported on 18.7% of returns)
Here:
+$10,927
State:
+$48,178
(% of AGI for various income ranges: 29.4% for AGIs below $25k, 45.0% for AGIs $25k-50k, 67.7% for AGIs $50k-75k, 153.6% for AGIs $75k-100k, 697.0% for AGIs $100k-200k, 6186.7% for AGIs over 200k)
Profit/loss from business: +$12,920 (reported on 17.7% of returns)
Here:
+$12,920
State:
+$20,792
(% of AGI for various income ranges: 107.5% for AGIs below $25k, 210.7% for AGIs $25k-50k, 191.8% for AGIs $50k-75k, 317.1% for AGIs $75k-100k, 737.8% for AGIs $100k-200k, 3416.7% for AGIs over 200k)
Taxable individual retirement arrangement distribution: $17,175 (reported on 12.1% of returns)
01010:
$17,175
Massachusetts:
$22,790
(% of AGI for various income ranges: 62.8% for AGIs below $25k, 111.8% for AGIs $25k-50k, 368.6% for AGIs $50k-75k, 313.6% for AGIs $75k-100k, 1025.2% for AGIs $100k-200k)
Total itemized deductions: $24,931 (reported on 8.1% of returns)
Here:
$24,931
State:
$36,722
(% of AGI for various income ranges: 148.8% for AGIs below $25k, 277.3% for AGIs $50k-75k, 498.6% for AGIs $75k-100k, 638.3% for AGIs $100k-200k, 2456.7% for AGIs over 200k)
Charity contributions: $3,650 (reported on 6.1% of returns)
Here:
$3,650
State:
$12,529
(% of AGI for various income ranges: 14.1% for AGIs $50k-75k, 31.4% for AGIs $75k-100k, 84.3% for AGIs $100k-200k, 563.3% for AGIs over 200k)
Taxes paid: $9,094 (reported on 8.1% of returns)
01010:
$9,094
State:
$8,782
(% of AGI for various income ranges: 45.3% for AGIs below $25k, 110.5% for AGIs $50k-75k, 195.7% for AGIs $75k-100k, 240.4% for AGIs $100k-200k, 800.0% for AGIs over 200k)
Earned income credit: $1,731 (reported on 6.6% of returns)
Here:
$1,731
State:
$1,909
(% of AGI for various income ranges: 33.4% for AGIs below $25k, 42.1% for AGIs $25k-50k)
Percentage of individuals using paid preparers for their 2020 taxes: 92.4%
Here:
92%
State:
92%
(% for various income ranges: 91.8% for AGIs below $25k, 94.7% for AGIs $25k-50k, 90.9% for AGIs $50k-75k, 95.7% for AGIs $75k-100k, 90.9% for AGIs $100k-200k, 90.9% for AGIs over 200k)
Averages for the 2012 tax year for zip code 01010, filed in 2013:
Average Adjusted Gross Income (AGI) in 2012: $66,166 (Individual Income Tax Returns)
Here:
$66,166
State:
$81,425
Salary/wage: $56,877 (reported on 86.9% of returns)
Here:
$56,877
State:
$64,752
(% of AGI for various income ranges: 64.7% for AGIs below $25k, 78.0% for AGIs $25k-50k, 77.2% for AGIs $50k-75k, 80.4% for AGIs $75k-100k, 81.7% for AGIs $100k-200k, 51.8% for AGIs over 200k)
Taxable interest for individuals: $604 (reported on 55.2% of returns)
This zip code:
$604
Massachusetts:
$2,136
(% of AGI for various income ranges: 1.3% for AGIs below $25k, 0.5% for AGIs $25k-50k, 0.6% for AGIs $50k-75k, 0.5% for AGIs $75k-100k, 0.4% for AGIs $100k-200k, 0.4% for AGIs over 200k)
Ordinary dividends: $2,663 (reported on 22.4% of returns)
Here:
$2,663
State:
$9,473
(% of AGI for various income ranges: 1.3% for AGIs below $25k, 0.5% for AGIs $25k-50k, 0.9% for AGIs $50k-75k, 1.0% for AGIs $75k-100k, 0.5% for AGIs $100k-200k, 1.8% for AGIs over 200k)
Net capital gain/loss in AGI: +$5,807 (reported on 15.3% of returns)
Here:
+$5,807
State:
+$31,437
(% of AGI for various income ranges: 0.2% for AGIs $50k-75k, 0.1% for AGIs $75k-100k, 1.7% for AGIs $100k-200k, 4.6% for AGIs over 200k)
Profit/loss from business: +$11,421 (reported on 18.0% of returns)
Here:
+$11,421
State:
+$20,662
(% of AGI for various income ranges: 10.2% for AGIs below $25k, 3.5% for AGIs $25k-50k, 2.9% for AGIs $50k-75k, 4.5% for AGIs $75k-100k, 2.8% for AGIs $100k-200k)
Taxable individual retirement arrangement distribution: $11,345 (reported on 10.9% of returns)
01010:
$11,345
Massachusetts:
$18,892
(% of AGI for various income ranges: 3.6% for AGIs below $25k, 1.9% for AGIs $25k-50k, 1.4% for AGIs $50k-75k, 2.6% for AGIs $75k-100k, 2.3% for AGIs $100k-200k)
Total itemized deductions: $21,696 (20% of AGI, reported on 44.8% of returns)
Here:
$21,696
State:
$28,907
Here:
20.1% of AGI
State:
18.2% of AGI
(% of AGI for various income ranges: 11.7% for AGIs below $25k, 12.4% for AGIs $25k-50k, 15.7% for AGIs $50k-75k, 15.7% for AGIs $75k-100k, 15.8% for AGIs $100k-200k, 13.0% for AGIs over 200k)
Charity contributions: $1,757 (reported on 34.4% of returns)
Here:
$1,757
State:
$4,208
(% of AGI for various income ranges: 0.4% for AGIs below $25k, 0.5% for AGIs $25k-50k, 0.9% for AGIs $50k-75k, 1.1% for AGIs $75k-100k, 1.1% for AGIs $100k-200k, 0.8% for AGIs over 200k)
Taxes paid: $9,996 (reported on 44.8% of returns)
01010:
$9,996
State:
$13,303
(% of AGI for various income ranges: 2.8% for AGIs below $25k, 4.1% for AGIs $25k-50k, 6.0% for AGIs $50k-75k, 6.6% for AGIs $75k-100k, 7.5% for AGIs $100k-200k, 9.1% for AGIs over 200k)
Earned income credit: $1,355 (reported on 10.9% of returns)
Here:
$1,355
State:
$1,971
(% of AGI for various income ranges: 2.9% for AGIs below $25k, 0.6% for AGIs $25k-50k)
Percentage of individuals using paid preparers for their 2012 taxes: 57.4%
Here:
57%
State:
56%
(% for various income ranges: 50.9% for AGIs below $25k, 55.3% for AGIs $25k-50k, 60.7% for AGIs $50k-75k, 63.6% for AGIs $75k-100k, 60.6% for AGIs $100k-200k, 80.0% for AGIs over 200k)
Averages for the 2004 tax year for zip code 01010, filed in 2005:
Average Adjusted Gross Income (AGI) in 2004: $52,150 (Individual Income Tax Returns)
Here:
$52,150
State:
$62,877
Salary/wage: $47,702 (reported on 86.5% of returns)
Here:
$47,702
State:
$52,969
(% of AGI for various income ranges: 90.0% for AGIs below $10k, 71.1% for AGIs $10k-25k, 81.7% for AGIs $25k-50k, 82.5% for AGIs $50k-75k, 82.8% for AGIs $75k-100k, 74.9% for AGIs over 100k)
Taxable interest for individuals: $706 (reported on 66.3% of returns)
This zip code:
$706
Massachusetts:
$1,945
(% of AGI for various income ranges: 4.4% for AGIs below $10k, 2.0% for AGIs $10k-25k, 0.9% for AGIs $25k-50k, 0.9% for AGIs $50k-75k, 0.8% for AGIs $75k-100k, 0.6% for AGIs over 100k)
Taxable dividends: $2,065 (reported on 25.8% of returns)
Here:
$2,065
State:
$5,323
(% of AGI for various income ranges: 5.3% for AGIs below $10k, 1.0% for AGIs $10k-25k, 0.8% for AGIs $25k-50k, 0.8% for AGIs $50k-75k, 0.8% for AGIs $75k-100k, 1.2% for AGIs over 100k)
Net capital gain/loss: +$6,083 (reported on 20.9% of returns)
Here:
+$6,083
State:
+$20,377
(% of AGI for various income ranges: -2.3% for AGIs below $10k, -0.2% for AGIs $10k-25k, 0.6% for AGIs $25k-50k, 0.7% for AGIs $50k-75k, 1.7% for AGIs $75k-100k, 5.3% for AGIs over 100k)
Profit/loss from business: +$13,554 (reported on 19.6% of returns)
Here:
+$13,554
State:
+$17,837
(% of AGI for various income ranges: -1.9% for AGIs below $10k, 8.0% for AGIs $10k-25k, 4.4% for AGIs $25k-50k, 5.1% for AGIs $50k-75k, 6.7% for AGIs $75k-100k, 4.4% for AGIs over 100k)
Profit/loss from farming: +$1,364 (reported on 1.3% of returns)
Here:
+$1,364
State:
-$2,642
IRA payment deduction: $3,000 (reported on 2.2% of returns)
01010:
$3,000
Massachusetts:
$3,100
Self-employed pension: $7,316 (reported on 1.1% of returns)
Here:
$7,316
Massachusetts:
$14,516
Total itemized deductions: $17,739 (21% of AGI, reported on 46.3% of returns)
Here:
$17,739
State:
$22,573
Here:
21.0% of AGI
State:
19.5% of AGI
(% of AGI for various income ranges: 12.5% for AGIs below $10k, 11.5% for AGIs $10k-25k, 14.5% for AGIs $25k-50k, 18.3% for AGIs $50k-75k, 18.2% for AGIs $75k-100k, 14.3% for AGIs over 100k)
Charity contributions deductions: $1,561 (2% of AGI, reported on 39.9% of returns)
Here:
$1,561
State:
$3,295
Here:
1.8% of AGI
State:
2.7% of AGI
(% of AGI for various income ranges: 0.9% for AGIs $10k-25k, 0.8% for AGIs $25k-50k, 1.6% for AGIs $50k-75k, 1.4% for AGIs $75k-100k, 1.1% for AGIs over 100k)
Total tax: $7,639 (reported on 81.1% of returns)
01010:
$7,639
State:
$11,494
(% of AGI for various income ranges: 3.0% for AGIs below $10k, 5.2% for AGIs $10k-25k, 8.0% for AGIs $25k-50k, 8.6% for AGIs $50k-75k, 10.3% for AGIs $75k-100k, 17.9% for AGIs over 100k)
Earned income credit: $1,675 (reported on 6.6% of returns)
Here:
$1,675
State:
$1,518
Percentage of individuals using paid preparers for their 2004 taxes: 57.7%
Here:
58%
State:
58%
(% for various income ranges: 49.7% for AGIs below $10k, 54.1% for AGIs $10k-25k, 57.8% for AGIs $25k-50k, 61.3% for AGIs $50k-75k, 64.9% for AGIs $75k-100k, 63.9% for AGIs over 100k)
Household received Food Stamps/SNAP in the past 12 months: 126 Household did not receive Food Stamps/SNAP in the past 12 months: 1,364
Women who had a birth in the past 12 months: 24 (14 now married, 9 unmarried) Women who did not have a birth in the past 12 months: 581 (312 now married, 262 unmarried)
Housing units in zip code 01010 with a mortgage: 843 (159 second mortgage, 140 both second mortgage and home equity loan) Houses without a mortgage: 32
Median monthly owner costs for units with a mortgage: $2,220 Median monthly owner costs for units without a mortgage: $825
Residents with income below the poverty level in 2022:
This zip code:
6.3%
Whole state:
10.4%
Residents with income below 50% of the poverty level in 2022:
This zip code:
3.4%
Whole state:
5.1%
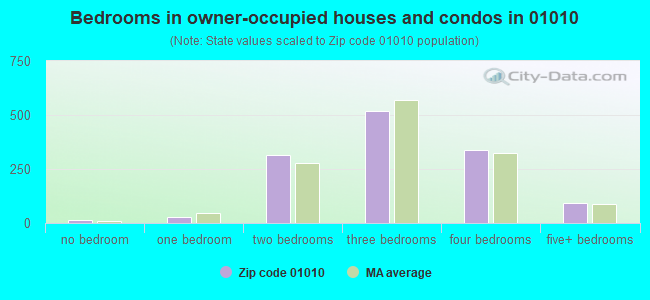
Median number of rooms in houses and condos:
Here:
6.3
State:
6.5
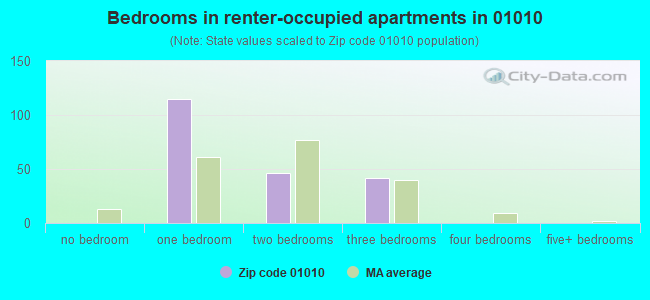
Median number of rooms in apartments:
Here:
4.5
State:
4.0
Notable locations in this zip code not listed on our city pages
Notable locations in zip code 01010: Springfield Boys Camp (A), Brimfield Ambulance Service (B), Brimfield Fire Department (C). Display/hide their locations on the map
Lakes, reservoirs, and swamps: Sherman Pond (A), Pork Barrel Pond (B), Little Alum Pond (C), Green Pond (D), East Brimfield Lake (E), Woodman Pond (F), Baker Pond (G), Shephard Pond (H). Display/hide their locations on the map
Streams, rivers, and creeks: Bottle Brook (A), Foskett Mill Stream (B), Penny Brook (C), Turkey Brook (D), Charles Brook (E), East Brook (F), Hollow Brook (G), Mill Brook (H), Mountain Brook (I). Display/hide their locations on the map
Size of family households: 491 2-persons, 256 3-persons, 222 4-persons, 63 5-persons, 6 6-persons, 20 7-or-more-persons
Size of nonfamily households: 374 1-person, 56 2-persons, 11 3-persons
466 married couples with children.
241 single-parent households (63 men, 178 women).
97.8% of residents of 01010 zip code speak English at home.
1.3% of residents speak Spanish at home (100% very well).
0.4% of residents speak other Indo-European language at home (57% very well, 43% well).
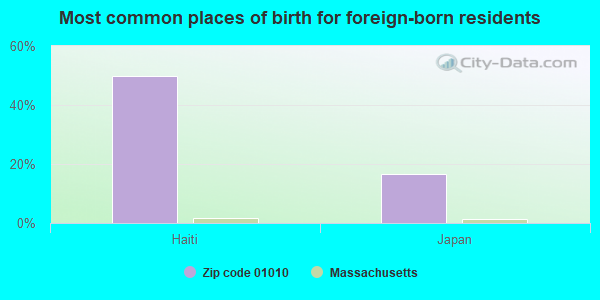
Foreign born population: 42 (1.1%) (80.8% of them are naturalized citizens)
This zip code:
1.1%
Whole state:
18.0%
50%Haiti
17%Japan
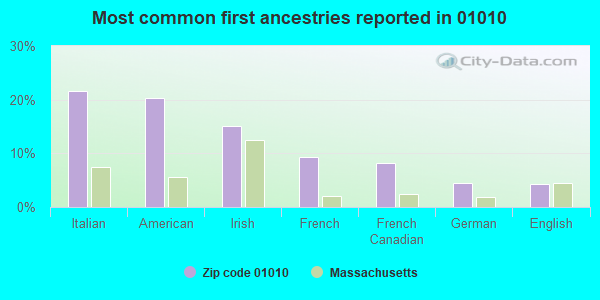
22%Italian
20%American
15%Irish
9%French
8%French Canadian
4%German
4%English
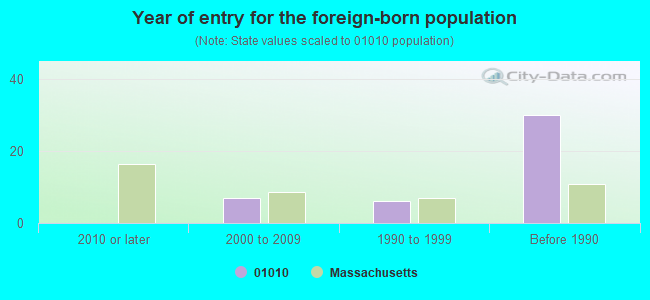
Year of entry for the foreign-born population
02010 or later
72000 to 2009
61990 to 1999
30Before 1990
Facilities with environmental interests located in this zip code:
BRIMFIELD ELEMENTARY (22 WALES RD/POB 427 in BRIMFIELD, MA)
(National Center for Education Statistics) - STATE ID-043005
ACCELLENT ORTHOPAEDICS (68 MILL LANE RD in BRIMFIELD, MA)
(Resource Conservation and Recovery Act (tracking hazardous waste)) Organizations: BRIMFIELD ACQUISITION LLC D/B/A ACCELLEN (CONTACT/OPERATOR)
Alternative names: MEDSOURCE TECHNOLOGIES INC
BRIMFIELD (RTE. 20 in BRIMFIELD, MA)
AIR MINOR (AIRS/AFS) Business SIC classification: GENERAL GOVERNMENT Alternative names: TOWN OF BRIMFIELD
BRIMFIELD STATE FOREST (DEARTH HILL RD in BRIMFIELD, MA)
Conditionally Exempt Small Quantity Generators, less than 100 kg/month of hazardous waste (Resource Conservation and Recovery Act (tracking hazardous waste)) - notification Business NAICS classification: GENERAL AUTOMOTIVE REPAIR. Organizations: COMM OF MASSACHUSETTS (CONTACT/OWNER)
BRIMFIELD XTRA MART (INTERSECTIN OF ROUTES 19 & 20 in BRIMFIELD, MA)
National Pollutant Discharge Elimination System NON-MAJOR (Tracking pollutant discharge elimination systems) - permit
BRIMFIELD ELEMENTRY (WALES ROAD in BRIMFIELD, MA)
COMPLIANCE ACTIVITY (Tracking inspections of insecticide, fungicide, and rodenticide, and toxic substances) Alternative names: BRIM FIELD ELEMENTRY
Housing units lacking complete plumbing facilities: 1.4% Housing units lacking complete kitchen facilities: 0.5%
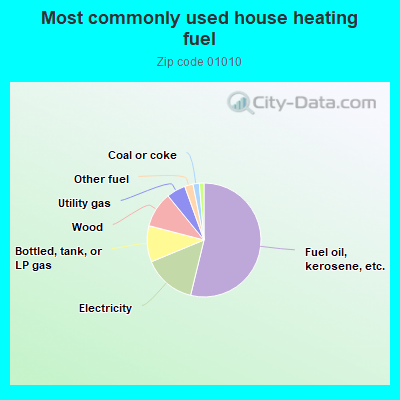
53.9%Fuel oil, kerosene, etc.
15.0%Electricity
10.3%Bottled, tank, or LP gas
10.1%Wood
5.4%Utility gas
2.4%Other fuel
1.8%Coal or coke
0.8%No fuel used
0.5%Solar energy
Population in 1990: 3,706.
Place of birth for U.S.-born residents:
This state: 2,579
Northeast: 674
Midwest: 108
South: 233
West: 42
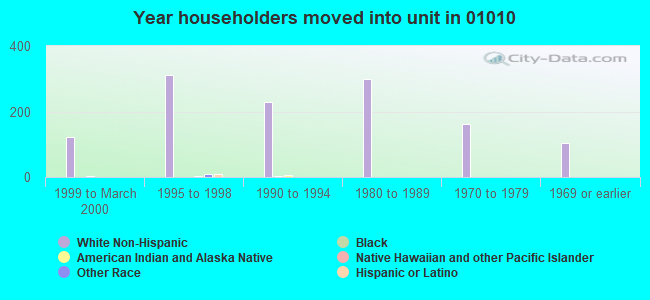
69% of the 01010 zip code residents lived in the same house 5 years ago. Out of people who lived in different houses, 58% lived in this county. Out of people who lived in different counties, 50% lived in Massachusetts.
89% of the 01010 zip code residents lived in the same house 1 year ago. Out of people who lived in different houses, 40% moved from this county. Out of people who lived in different houses, 39% moved from different county within same state. Out of people who lived in different houses, 21% moved from different state.
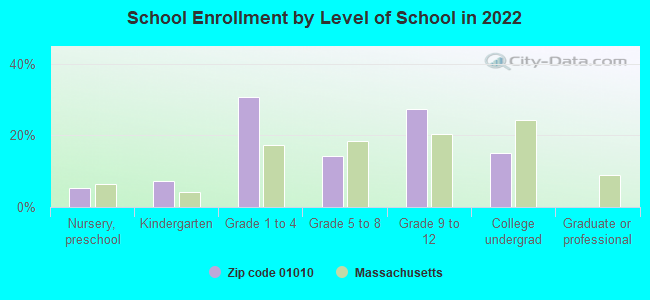
Private vs. public school enrollment:
Students in private schools in grades 1 to 8 (elementary and middle school): 73
Here:
24.3%
Massachusetts:
10.3%
Students in private schools in grades 9 to 12 (high school):
Here:
0.0%
Massachusetts:
12.3%
Students in private undergraduate colleges: 34
Here:
33.3%
Massachusetts:
51.2%
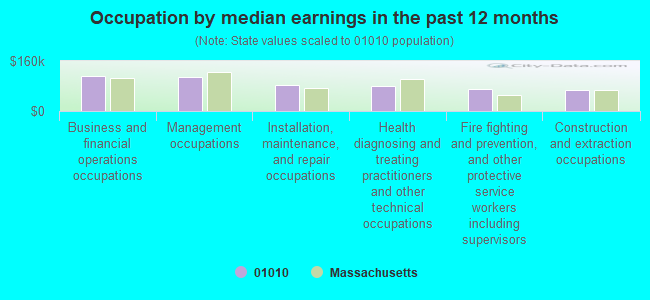
Occupation by median earnings in the past 12 months ($)
110,851Business and financial operations occupations
108,781Management occupations
82,973Installation, maintenance, and repair occupations
80,346Health diagnosing and treating practitioners and other technical occupations
70,734Fire fighting and prevention, and other protective service workers including supervisors
68,201Construction and extraction occupations
Companies with federal contracts located in this zip code:
COOK'S FARM ORCHARD (106 HAYNES HILL RD in BRIMFIELD, MA; small business) : $118,640 in 22 contractsfrom 2004 to 2006
Contracts for Landscaping/Groundskeeping Services, Other Professional Services by Army, U.S. Army Corps of Engineers - civil program financing only Signed by year:2000: $0; 2001: $0; 2002: $0; 2003: $0; 2004: $36,460; 2005: $52,300; 2006: $29,880.
Biggest contracts:
$12,400 with Army for Landscaping/Groundskeeping Services. Signed on 2006-03-15. Completion date: 2005-11-30.
$11,330, same as above.Signed on 2006-01-27. Completion date: 2006-10-31.
$11,330 with U.S. Army Corps of Engineers - civil program financing only for Landscaping/Groundskeeping Services. Signed on 2005-02-07. Completion date: 2005-10-31.
$11,330 with Army for Landscaping/Groundskeeping Services. Signed on 2005-02-07. Completion date: 2005-10-31.
WATER CONSULTING SERVICE (135 LITTLE ALUM RD in BRIMFIELD, MA; small business)
$2,256 with Army for Maintenance, Repair or Alteration of Real Property -- Other Administrative Facilities and Service Buildings. Signed on 2005-06-17. Completion date: 2005-06-17.
Top industries in this zip code by the number of employees in 2005:
Health Care and Social Assistance: Ambulance Services (20-49 employees: 1 establishment)
Construction: Drywall and Insulation Contractors (20-49: 1)
Administrative and Support and Waste Management and Remediation Services: Landscaping Services (10-19: 1, 5-9: 1)
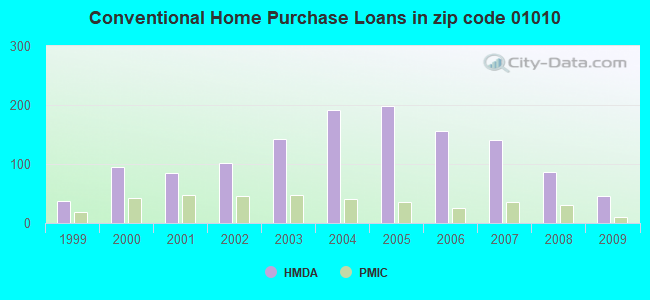
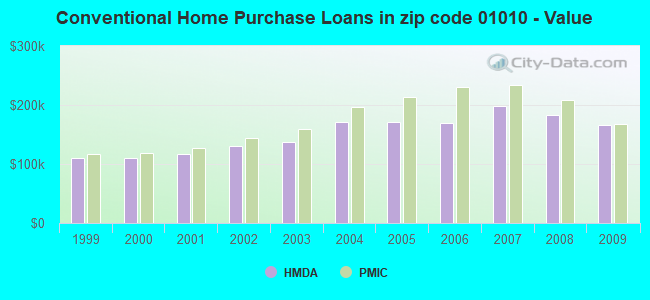
Detailed PMIC statistics for the following Tracts:8138.00
2002 - 2018 National Fire Incident Reporting System (NFIRS) incidents
According to the data from the years 2002 - 2018 the average number of fire incidents per year is 13. The highest number of reported fire incidents - 37 took place in 2010, and the least - 2 in 2002. The data has a rising trend.
When looking into fire subcategories, the most incidents belonged to: Structure Fires (42.9%), and Outside Fires (40.6%).
Fire incident types reported to NFIRS in Zip Code 01010


+$1,364
-$2,642
 Nearest zip codes: 01092, 01081, 01083, 01521, 01518, 01506.


 According to the data from the years 2002 - 2018 the average number of fire incidents per year is 13. The highest number of reported fire incidents - 37 took place in 2010, and the least - 2 in 2002. The data has a rising trend.
 When looking into fire subcategories, the most incidents belonged to: Structure Fires (42.9%), and Outside Fires (40.6%).