Estimated zip code population in 2022: 1,792 Zip code population in 2010: 1,851 Zip code population in 2000: 1,444
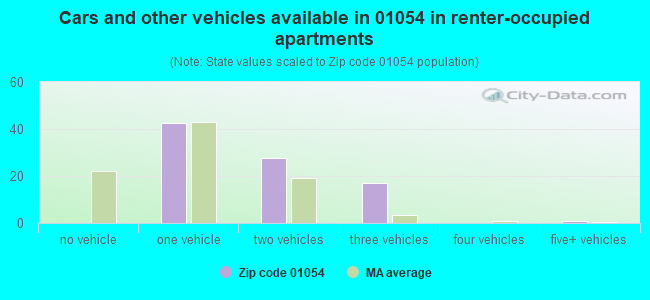
Houses and condos: 823 Renter-occupied apartments: 88
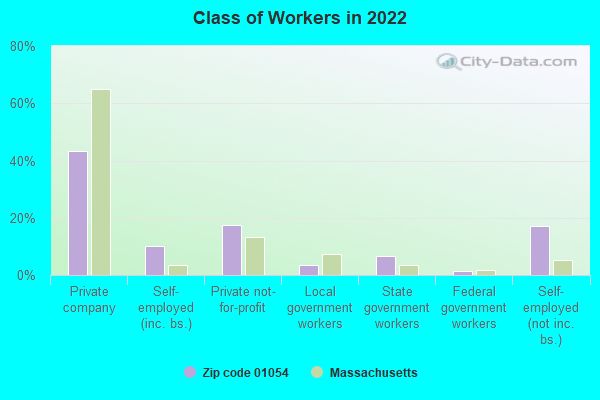
% of renters here:
12%
State:
38%
March 2022 cost of living index in zip code 01054: 89.2 (less than average, U.S. average is 100)
Land area: 22.8 sq. mi. Water area: 0.2 sq. mi.
Population density: 79 people per square mile
(very low).
OSM Map
Google Map
MSN Map
OSM Map
General Map
Google Map
MSN Map
OSM Map
Google Map
MSN Map
OSM Map
Google Map
MSN Map
Please wait while loading the map...
Real estate property taxes paid for housing units in 2022:
This zip code:
1.4% ($6,542)
Massachusetts:
1.0% ($5,536)
Median real estate property taxes paid for housing units with mortgages in 2022: $6,543 (1.5%) Median real estate property taxes paid for housing units with no mortgage in 2022: $6,546 (1.4%)
Business Search- 14 Million verified businesses
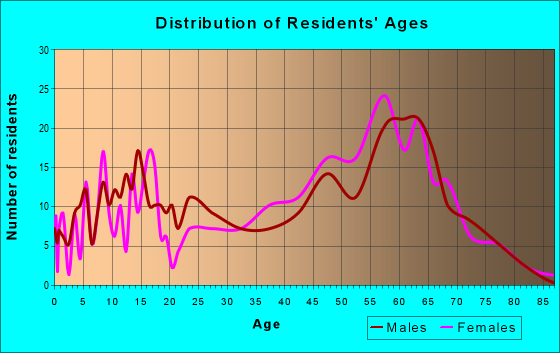
Males: 846
(47.2%)
Females: 946
(52.8%)
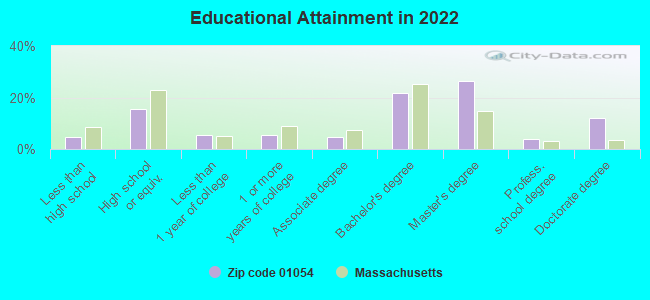
For population 25 years and over in 01054:
High school or higher: 96.4%
Bachelor's degree or higher: 65.1%
Graduate or professional degree: 43.2%
Unemployed: 4.3%
Mean travel time to work (commute): 28.8 minutes
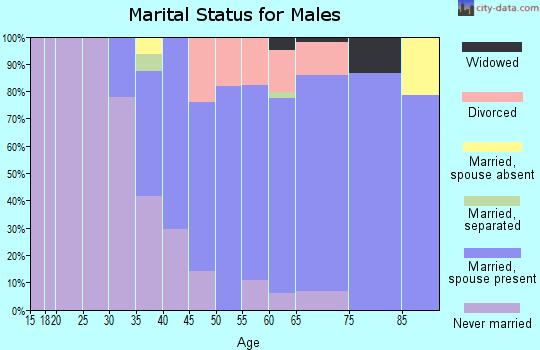
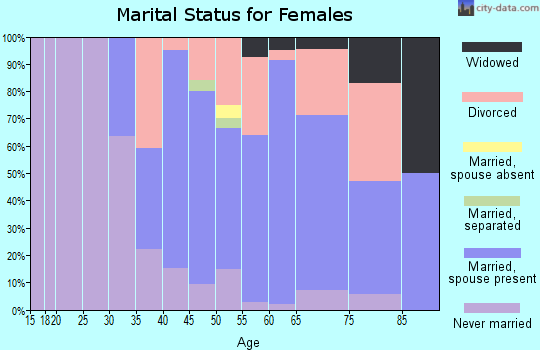
For population 15 years and over in 01054:
Never married: 29.0%
Now married: 50.9%
Separated: 1.9%
Widowed: 4.2%
Divorced: 14.1%
Zip code 01054 compared to state average:
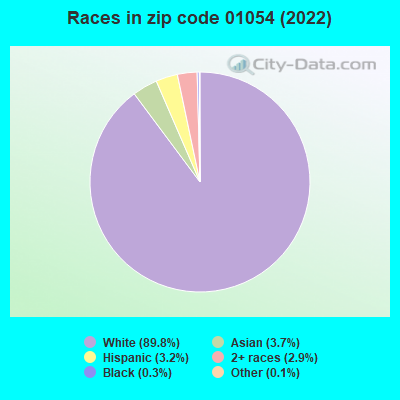
Black race population percentage significantly below state average.
Hispanic race population percentage significantly below state average.
Median age significantly above state average.
Foreign-born population percentage significantly below state average.
Renting percentage significantly below state average.
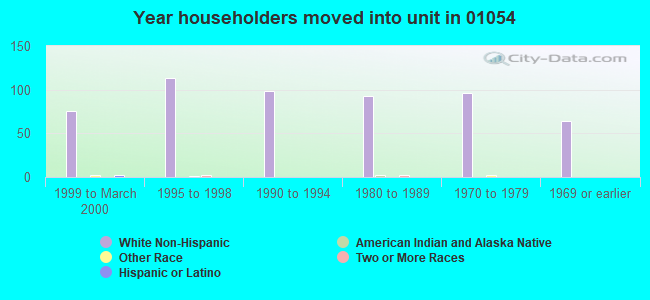
Length of stay since moving in significantly above state average.
Number of rooms per house above state average.
Number of college students below state average.
Percentage of population with a bachelor's degree or higher above state average.
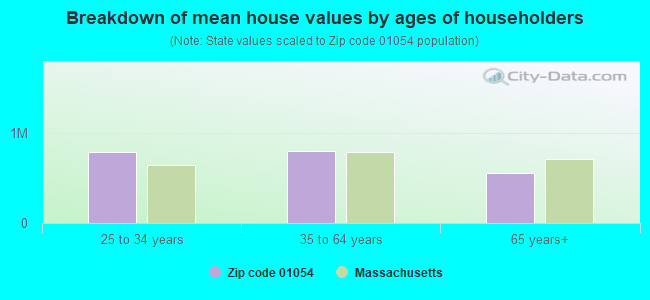
Estimated median house/condo value in 2022: $453,263
01054:
$453,263
Massachusetts:
$534,700
Median resident age:
This zip code:
49.6 years
Massachusetts median age:
40.3 years
Average household size:
This zip code:
2.4 people
Massachusetts:
2.4 people
Averages for the 2020 tax year for zip code 01054, filed in 2021:
Average Adjusted Gross Income (AGI) in 2020: $112,884 (Individual Income Tax Returns)
Here:
$112,884
State:
$105,130
Salary/wage: $65,139 (reported on 70.3% of returns)
Here:
$65,139
State:
$82,951
(% of AGI for various income ranges: 1057.9% for AGIs below $25k, 3510.7% for AGIs $25k-50k, 5255.0% for AGIs $50k-75k, 10275.0% for AGIs $75k-100k, 17445.5% for AGIs $100k-200k, 61745.0% for AGIs over 200k)
Taxable interest for individuals: $2,800 (reported on 50.5% of returns)
This zip code:
$2,800
Massachusetts:
$2,361
(% of AGI for various income ranges: 22.9% for AGIs below $25k, 26.4% for AGIs $25k-50k, 133.8% for AGIs $50k-75k, 185.0% for AGIs $75k-100k, 236.4% for AGIs $100k-200k, 4590.0% for AGIs over 200k)
Ordinary dividends: $13,824 (reported on 37.6% of returns)
Here:
$13,824
State:
$10,365
(% of AGI for various income ranges: 59.3% for AGIs below $25k, 102.9% for AGIs $25k-50k, 352.5% for AGIs $50k-75k, 525.0% for AGIs $75k-100k, 1090.9% for AGIs $100k-200k, 16670.0% for AGIs over 200k)
Net capital gain/loss in AGI: +$63,534 (reported on 34.7% of returns)
Here:
+$63,534
State:
+$48,178
(% of AGI for various income ranges: 16.4% for AGIs below $25k, 91.4% for AGIs $25k-50k, 140.0% for AGIs $50k-75k, 625.0% for AGIs $75k-100k, 1307.3% for AGIs $100k-200k, 101430.0% for AGIs over 200k)
Profit/loss from business: +$14,325 (reported on 31.7% of returns)
Here:
+$14,325
State:
+$20,792
(% of AGI for various income ranges: 265.7% for AGIs below $25k, 375.7% for AGIs $25k-50k, 685.0% for AGIs $50k-75k, 620.0% for AGIs $75k-100k, 1567.3% for AGIs $100k-200k, 5830.0% for AGIs over 200k)
Taxable individual retirement arrangement distribution: $19,594 (reported on 15.8% of returns)
01054:
$19,594
Massachusetts:
$22,790
(% of AGI for various income ranges: 196.4% for AGIs $25k-50k, 315.0% for AGIs $50k-75k, 815.0% for AGIs $75k-100k, 1187.3% for AGIs $100k-200k, 4880.0% for AGIs over 200k)
Total itemized deductions: $43,727 (reported on 10.9% of returns)
Here:
$43,727
State:
$36,722
(% of AGI for various income ranges: 1308.8% for AGIs $50k-75k, 1135.5% for AGIs $100k-200k, 12570.0% for AGIs over 200k)
Charity contributions: $27,488 (reported on 7.9% of returns)
Here:
$27,488
State:
$12,529
(% of AGI for various income ranges: 35.7% for AGIs below $25k, 330.0% for AGIs $100k-200k, 8930.0% for AGIs over 200k)
Taxes paid: $8,118 (reported on 10.9% of returns)
01054:
$8,118
State:
$8,782
(% of AGI for various income ranges: 333.8% for AGIs $50k-75k, 369.1% for AGIs $100k-200k, 1100.0% for AGIs over 200k)
Earned income credit: $1,075 (reported on 7.9% of returns)
Here:
$1,075
State:
$1,909
(% of AGI for various income ranges: 61.4% for AGIs below $25k)
Percentage of individuals using paid preparers for their 2020 taxes: 93.1%
Here:
93%
State:
92%
(% for various income ranges: 88.0% for AGIs below $25k, 95.2% for AGIs $25k-50k, 92.3% for AGIs $50k-75k, 100.0% for AGIs $75k-100k, 91.7% for AGIs $100k-200k, 100.0% for AGIs over 200k)
Averages for the 2012 tax year for zip code 01054, filed in 2013:
Average Adjusted Gross Income (AGI) in 2012: $80,386 (Individual Income Tax Returns)
Here:
$80,386
State:
$81,425
Salary/wage: $55,141 (reported on 77.6% of returns)
Here:
$55,141
State:
$64,752
(% of AGI for various income ranges: 65.5% for AGIs below $25k, 60.3% for AGIs $25k-50k, 68.3% for AGIs $50k-75k, 58.2% for AGIs $75k-100k, 59.6% for AGIs $100k-200k, 37.0% for AGIs over 200k)
Taxable interest for individuals: $1,442 (reported on 56.1% of returns)
This zip code:
$1,442
Massachusetts:
$2,136
(% of AGI for various income ranges: 1.6% for AGIs below $25k, 0.6% for AGIs $25k-50k, 0.9% for AGIs $50k-75k, 0.9% for AGIs $75k-100k, 0.8% for AGIs $100k-200k, 1.3% for AGIs over 200k)
Ordinary dividends: $10,011 (reported on 38.8% of returns)
Here:
$10,011
State:
$9,473
(% of AGI for various income ranges: 6.9% for AGIs below $25k, 2.5% for AGIs $25k-50k, 3.4% for AGIs $50k-75k, 3.3% for AGIs $75k-100k, 3.5% for AGIs $100k-200k, 7.4% for AGIs over 200k)
Net capital gain/loss in AGI: +$23,294 (reported on 32.7% of returns)
Here:
+$23,294
State:
+$31,437
(% of AGI for various income ranges: 0.6% for AGIs $50k-75k, 2.5% for AGIs $75k-100k, 3.2% for AGIs $100k-200k, 24.1% for AGIs over 200k)
Profit/loss from business: +$16,543 (reported on 30.6% of returns)
Here:
+$16,543
State:
+$20,662
(% of AGI for various income ranges: 13.3% for AGIs below $25k, 16.1% for AGIs $25k-50k, 4.6% for AGIs $50k-75k, 5.2% for AGIs $75k-100k, 7.7% for AGIs $100k-200k, 3.0% for AGIs over 200k)
Taxable individual retirement arrangement distribution: $14,393 (reported on 14.3% of returns)
01054:
$14,393
Massachusetts:
$18,892
(% of AGI for various income ranges: 6.6% for AGIs below $25k, 2.4% for AGIs $50k-75k, 1.6% for AGIs $75k-100k, 6.2% for AGIs $100k-200k)
Self-employment retirement plans: $22,950 (reported on 2.0% of returns)
01054:
$22,950
Massachusetts:
$20,669
Total itemized deductions: $23,453 (19% of AGI, reported on 52.0% of returns)
Here:
$23,453
State:
$28,907
Here:
18.7% of AGI
State:
18.2% of AGI
(% of AGI for various income ranges: 18.6% for AGIs below $25k, 16.2% for AGIs $25k-50k, 18.0% for AGIs $50k-75k, 15.1% for AGIs $75k-100k, 15.8% for AGIs $100k-200k, 13.0% for AGIs over 200k)
Charity contributions: $3,520 (reported on 41.8% of returns)
Here:
$3,520
State:
$4,208
(% of AGI for various income ranges: 0.9% for AGIs below $25k, 1.2% for AGIs $25k-50k, 1.7% for AGIs $50k-75k, 1.4% for AGIs $75k-100k, 1.9% for AGIs $100k-200k, 2.3% for AGIs over 200k)
Taxes paid: $12,335 (reported on 52.0% of returns)
01054:
$12,335
State:
$13,303
(% of AGI for various income ranges: 6.6% for AGIs below $25k, 7.0% for AGIs $25k-50k, 8.4% for AGIs $50k-75k, 7.3% for AGIs $75k-100k, 9.0% for AGIs $100k-200k, 7.7% for AGIs over 200k)
Earned income credit: $1,375 (reported on 8.2% of returns)
Here:
$1,375
State:
$1,971
(% of AGI for various income ranges: 2.2% for AGIs below $25k, 0.6% for AGIs $25k-50k)
Percentage of individuals using paid preparers for their 2012 taxes: 58.2%
Here:
58%
State:
56%
(% for various income ranges: 45.2% for AGIs below $25k, 64.7% for AGIs $25k-50k, 58.8% for AGIs $50k-75k, 54.5% for AGIs $75k-100k, 68.8% for AGIs $100k-200k, 83.3% for AGIs over 200k)
Averages for the 2004 tax year for zip code 01054, filed in 2005:
Average Adjusted Gross Income (AGI) in 2004: $67,869 (Individual Income Tax Returns)
Here:
$67,869
State:
$62,877
Salary/wage: $50,541 (reported on 79.7% of returns)
Here:
$50,541
State:
$52,969
(% of AGI for various income ranges: 76.0% for AGIs below $10k, 65.4% for AGIs $10k-25k, 71.1% for AGIs $25k-50k, 69.0% for AGIs $50k-75k, 70.4% for AGIs $75k-100k, 51.1% for AGIs over 100k)
Taxable interest for individuals: $2,193 (reported on 63.5% of returns)
This zip code:
$2,193
Massachusetts:
$1,945
(% of AGI for various income ranges: 3.2% for AGIs below $10k, 4.6% for AGIs $10k-25k, 1.2% for AGIs $25k-50k, 1.2% for AGIs $50k-75k, 1.1% for AGIs $75k-100k, 2.4% for AGIs over 100k)
Taxable dividends: $5,039 (reported on 43.5% of returns)
Here:
$5,039
State:
$5,323
(% of AGI for various income ranges: 9.6% for AGIs below $10k, 2.5% for AGIs $10k-25k, 3.1% for AGIs $25k-50k, 2.7% for AGIs $50k-75k, 1.9% for AGIs $75k-100k, 3.6% for AGIs over 100k)
Net capital gain/loss: +$10,686 (reported on 34.1% of returns)
Here:
+$10,686
State:
+$20,377
(% of AGI for various income ranges: -1.6% for AGIs below $10k, -0.4% for AGIs $10k-25k, 3.6% for AGIs $25k-50k, 0.2% for AGIs $50k-75k, 0.5% for AGIs $75k-100k, 8.8% for AGIs over 100k)
Profit/loss from business: +$16,749 (reported on 31.4% of returns)
Here:
+$16,749
State:
+$17,837
(% of AGI for various income ranges: 18.2% for AGIs below $10k, 11.7% for AGIs $10k-25k, 8.4% for AGIs $25k-50k, 9.9% for AGIs $50k-75k, 5.2% for AGIs $75k-100k, 7.1% for AGIs over 100k)
IRA payment deduction: $3,548 (reported on 4.7% of returns)
01054:
$3,548
Massachusetts:
$3,100
Self-employed pension: $14,028 (reported on 4.1% of returns)
Here:
$14,028
Massachusetts:
$14,516
Total itemized deductions: $20,084 (18% of AGI, reported on 48.2% of returns)
Here:
$20,084
State:
$22,573
Here:
17.6% of AGI
State:
19.5% of AGI
(% of AGI for various income ranges: 21.8% for AGIs below $10k, 15.3% for AGIs $10k-25k, 15.2% for AGIs $25k-50k, 18.7% for AGIs $50k-75k, 18.6% for AGIs $75k-100k, 11.7% for AGIs over 100k)
Charity contributions deductions: $3,005 (2% of AGI, reported on 42.5% of returns)
Here:
$3,005
State:
$3,295
Here:
2.4% of AGI
State:
2.7% of AGI
(% of AGI for various income ranges: 1.0% for AGIs $10k-25k, 1.6% for AGIs $25k-50k, 2.0% for AGIs $50k-75k, 2.3% for AGIs $75k-100k, 1.9% for AGIs over 100k)
Total tax: $12,553 (reported on 84.1% of returns)
01054:
$12,553
State:
$11,494
(% of AGI for various income ranges: 4.8% for AGIs below $10k, 6.3% for AGIs $10k-25k, 8.0% for AGIs $25k-50k, 10.0% for AGIs $50k-75k, 11.0% for AGIs $75k-100k, 20.6% for AGIs over 100k)
Earned income credit: $1,014 (reported on 7.8% of returns)
Here:
$1,014
State:
$1,518
Percentage of individuals using paid preparers for their 2004 taxes: 58.9%
Here:
59%
State:
58%
(% for various income ranges: 54.8% for AGIs below $10k, 56.1% for AGIs $10k-25k, 50.5% for AGIs $25k-50k, 60.4% for AGIs $50k-75k, 61.4% for AGIs $75k-100k, 74.7% for AGIs over 100k)
Household received Food Stamps/SNAP in the past 12 months: 68 Household did not receive Food Stamps/SNAP in the past 12 months: 676
Women who had a birth in the past 12 months: 11 (12 now married, 0 unmarried) Women who did not have a birth in the past 12 months: 309 (122 now married, 186 unmarried)
Housing units in zip code 01054 with a mortgage: 360 (49 second mortgage, 43 both second mortgage and home equity loan) Houses without a mortgage: 44
Median monthly owner costs for units with a mortgage: $2,164 Median monthly owner costs for units without a mortgage: $962
Residents with income below the poverty level in 2022:
This zip code:
9.8%
Whole state:
10.4%
Residents with income below 50% of the poverty level in 2022:
This zip code:
4.3%
Whole state:
5.1%
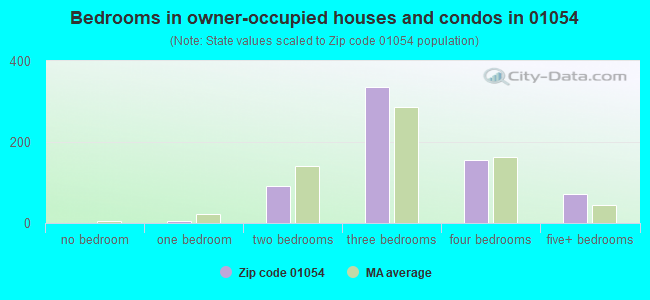
Median number of rooms in houses and condos:
Here:
7.2
State:
6.5
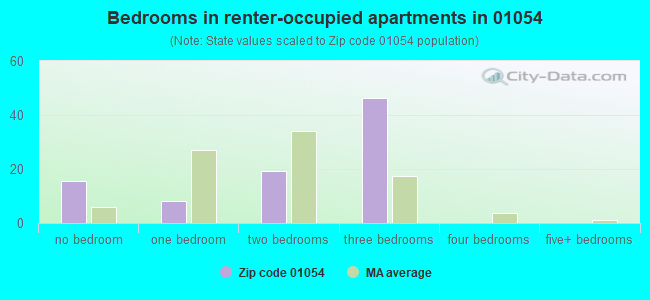
Median number of rooms in apartments:
Here:
4.3
State:
4.0
Notable locations in this zip code not listed on our city pages
Cemeteries: Jackson Hill Cemetery (1), Mervel Cemetery (2), Long Plain Cemetery (3), Plainview Cemetery (4), Mount Hope Cemetery (5), Gardner Cemetery (6). Display/hide their locations on the map
Streams, rivers, and creeks: Chestnut Hill Brook (A), Williams Brook (B), Red Brook (C), Gardner Brook (D), Mountain Brook (E). Display/hide their locations on the map
164 married couples with children.
113 single-parent households (56 men, 57 women).
93.6% of residents of 01054 zip code speak English at home.
1.5% of residents speak Spanish at home (92% very well, 8% well).
2.8% of residents speak other Indo-European language at home (100% very well).
1.1% of residents speak Asian or Pacific Island language at home (68% very well, 21% well, 11% not well).
1.2% of residents speak other language at home (90% very well, 10% well).
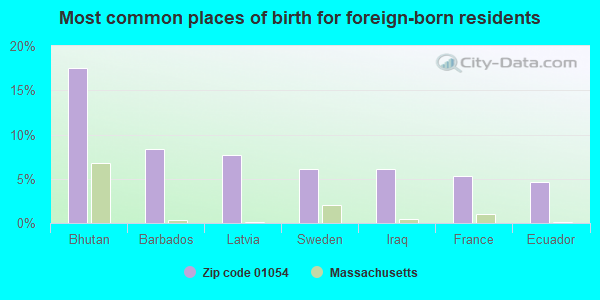
Foreign born population: 132 (7.4%) (81.5% of them are naturalized citizens)
This zip code:
7.4%
Whole state:
18.0%
18%Bhutan
8%Barbados
8%Latvia
6%Sweden
6%Iraq
5%France
5%Ecuador
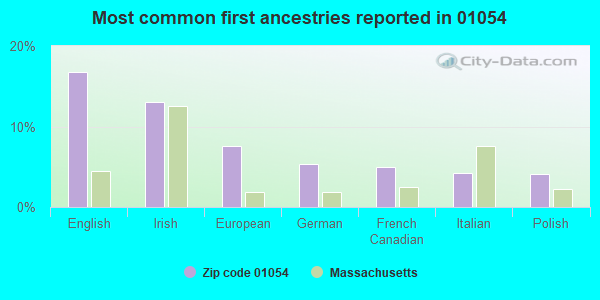
17%English
13%Irish
8%European
5%German
5%French Canadian
4%Italian
4%Polish
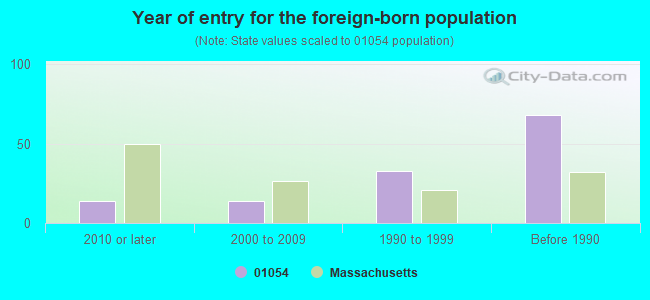
Year of entry for the foreign-born population
142010 or later
142000 to 2009
331990 to 1999
68Before 1990
Facilities with environmental interests located in this zip code:
LEVERETT ELEMENTARY (85 MONTAGUE RD in LEVERETT, MA)
(National Center for Education Statistics) - STATE ID-154005
LEVERETT (MONTAGUE ROAD in LEVERETT, MA)
AIR MINOR (AIRS/AFS) Business SIC classification: GENERAL GOVERNMENT
Housing units lacking complete plumbing facilities: 2.4% Housing units lacking complete kitchen facilities: 0.9%
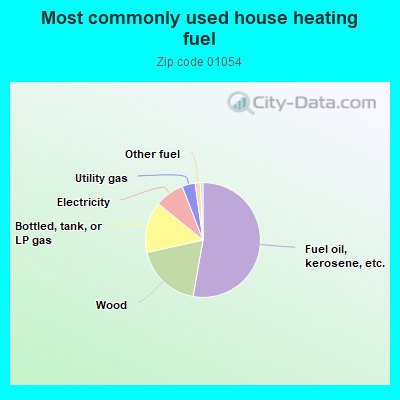
53.0%Fuel oil, kerosene, etc.
18.8%Wood
14.4%Bottled, tank, or LP gas
8.3%Electricity
3.7%Utility gas
1.5%Other fuel
0.7%Solar energy
Population in 1990: 1,748.
Place of birth for U.S.-born residents:
This state: 985
Northeast: 403
Midwest: 99
South: 121
West: 45
68% of the 01054 zip code residents lived in the same house 5 years ago. Out of people who lived in different houses, 33% lived in this county. Out of people who lived in different counties, 50% lived in Massachusetts.
91% of the 01054 zip code residents lived in the same house 1 year ago. Out of people who lived in different houses, 31% moved from this county. Out of people who lived in different houses, 51% moved from different county within same state. Out of people who lived in different houses, 18% moved from different state.
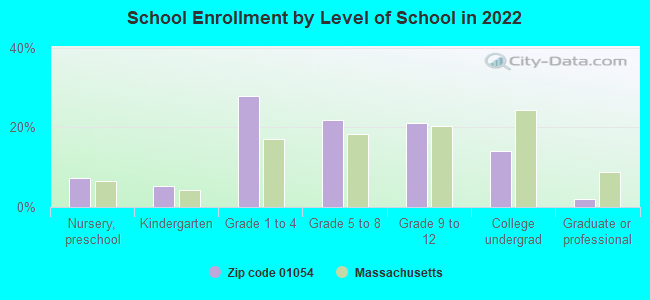
Private vs. public school enrollment:
Students in private schools in grades 1 to 8 (elementary and middle school): 22
Here:
14.8%
Massachusetts:
10.3%
Students in private schools in grades 9 to 12 (high school): 8
Here:
12.8%
Massachusetts:
12.3%
Students in private undergraduate colleges: 17
Here:
39.9%
Massachusetts:
51.2%
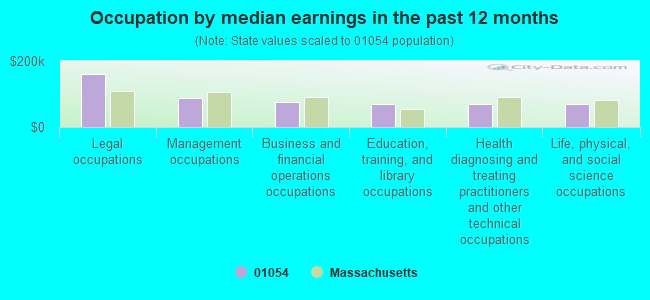
Occupation by median earnings in the past 12 months ($)
162,043Legal occupations
87,482Management occupations
74,804Business and financial operations occupations
71,006Education, training, and library occupations
69,586Health diagnosing and treating practitioners and other technical occupations
69,489Life, physical, and social science occupations
Companies with federal contracts located in this zip code:
ARCHIVAL MATTERS INC (16 LONG HILL RD in LEVERETT, MA; small business) : $81,180 in 3 contractsfrom 2002 to 2004
$42,542 with Air Force for Miscellaneous Furniture and Fixtures. Taking place in OH. Signed on 2002-10-23. Completion date: 2003-01-31.
$29,268 with Air Force for Cabinets, Lockers, Bins, and Shelving. Signed on 2004-11-30. Completion date: 2005-03-08.
$9,370, same as above.Signed on 2004-11-29. Completion date: 2005-03-07.
Top industries in this zip code by the number of employees in 2005:
Other Services (except Public Administration): Pet Care (except Veterinary) Services (10-19 employees: 1 establishment)
Wholesale Trade: Other Construction Material Merchant Wholesalers (10-19: 1)
Health Care and Social Assistance: Child Day Care Services (5-9: 1, 1-4: 2)
Construction: New Single-Family Housing Construction (except Operative Builders) (5-9: 1, 1-4: 1)
Other Services (except Public Administration): Car Washes (5-9: 1)
Administrative and Support and Waste Management and Remediation Services: Landscaping Services (1-4: 3)
Other Services (except Public Administration): Religious Organizations (1-4: 2)
Construction: Residential Remodelers (1-4: 2)
People in group quarters in 2010:
15 people in other noninstitutional facilities
People in group quarters in 2000:
35 people in religious group quarters
Fatal accident statistics in 2013:
Fatal accident count: 1
Vehicles involved in fatal accidents: 1
Fatal accidents caused by drunken drivers: 1
Fatalities: 1
Persons involved in fatal accidents: 1
Pedestrians involved in fatal accidents: 0
Home Mortgage Disclosure Act Aggregated Statistics For Year 2009 (Based on 2 partial tracts)
A) FHA, FSA/RHS & VA Home Purchase Loans
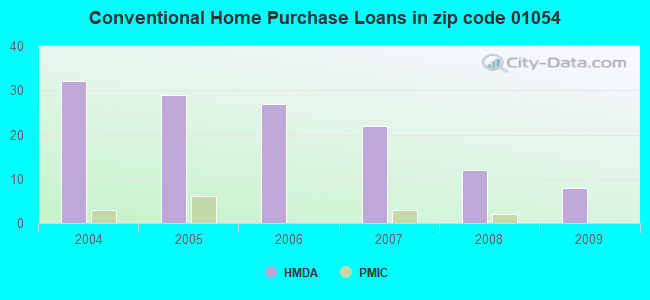
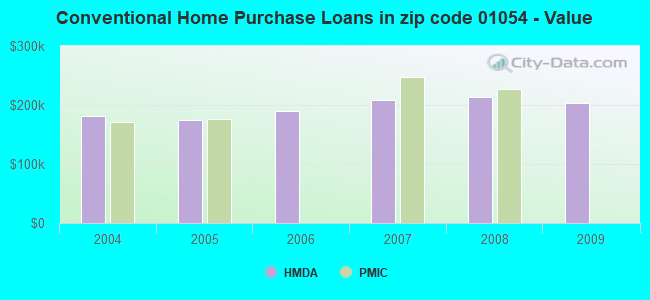
B) Conventional Home Purchase Loans
C) Refinancings
D) Home Improvement Loans
F) Non-occupant Loans on < 5 Family Dwellings (A B C & D)
Number
Average Value
Number
Average Value
Number
Average Value
Number
Average Value
Number
Average Value
LOANS ORIGINATED
3
$208,057
8
$202,964
60
$187,210
10
$89,042
4
$171,912
APPLICATIONS APPROVED, NOT ACCEPTED
0
$0
1
$149,200
2
$192,645
0
$0
0
$0
APPLICATIONS DENIED
0
$0
2
$335,495
14
$224,816
2
$53,570
3
$243,503
APPLICATIONS WITHDRAWN
1
$145,230
2
$193,045
9
$230,452
1
$53,570
0
$0
FILES CLOSED FOR INCOMPLETENESS
0
$0
1
$156,740
6
$207,063
0
$0
0
$0
Aggregated Statistics For Year 2008 (Based on 2 partial tracts)
A) FHA, FSA/RHS & VA Home Purchase Loans
B) Conventional Home Purchase Loans
C) Refinancings
D) Home Improvement Loans
F) Non-occupant Loans on < 5 Family Dwellings (A B C & D)
Number
Average Value
Number
Average Value
Number
Average Value
Number
Average Value
Number
Average Value
LOANS ORIGINATED
1
$186,500
12
$213,214
21
$177,426
8
$64,084
2
$273,395
APPLICATIONS APPROVED, NOT ACCEPTED
0
$0
1
$300,770
1
$147,610
1
$57,930
0
$0
APPLICATIONS DENIED
0
$0
1
$236,890
9
$211,450
2
$112,295
0
$0
APPLICATIONS WITHDRAWN
1
$71,030
2
$115,470
5
$190,464
0
$0
0
$0
FILES CLOSED FOR INCOMPLETENESS
0
$0
0
$0
1
$195,230
0
$0
0
$0
Aggregated Statistics For Year 2007 (Based on 2 partial tracts)
A) FHA, FSA/RHS & VA Home Purchase Loans
B) Conventional Home Purchase Loans
C) Refinancings
D) Home Improvement Loans
F) Non-occupant Loans on < 5 Family Dwellings (A B C & D)
Number
Average Value
Number
Average Value
Number
Average Value
Number
Average Value
Number
Average Value
LOANS ORIGINATED
1
$163,880
22
$209,150
31
$162,342
14
$62,439
4
$159,512
APPLICATIONS APPROVED, NOT ACCEPTED
0
$0
2
$225,380
8
$155,248
2
$60,510
1
$232,520
APPLICATIONS DENIED
0
$0
6
$217,050
14
$209,511
2
$124,595
1
$113,090
APPLICATIONS WITHDRAWN
0
$0
4
$197,210
7
$212,004
1
$85,310
2
$206,735
FILES CLOSED FOR INCOMPLETENESS
0
$0
0
$0
2
$66,860
0
$0
0
$0
Aggregated Statistics For Year 2006 (Based on 2 partial tracts)
B) Conventional Home Purchase Loans
C) Refinancings
D) Home Improvement Loans
F) Non-occupant Loans on < 5 Family Dwellings (A B C & D)
Number
Average Value
Number
Average Value
Number
Average Value
Number
Average Value
LOANS ORIGINATED
27
$189,215
32
$155,868
15
$87,799
6
$159,647
APPLICATIONS APPROVED, NOT ACCEPTED
3
$328,020
4
$175,980
1
$60,710
0
$0
APPLICATIONS DENIED
2
$185,700
18
$182,418
5
$92,454
2
$182,130
APPLICATIONS WITHDRAWN
2
$168,440
14
$174,394
1
$119,040
2
$141,460
FILES CLOSED FOR INCOMPLETENESS
0
$0
2
$323,590
1
$39,680
0
$0
Aggregated Statistics For Year 2005 (Based on 2 partial tracts)
B) Conventional Home Purchase Loans
C) Refinancings
D) Home Improvement Loans
F) Non-occupant Loans on < 5 Family Dwellings (A B C & D)
G) Loans On Manufactured Home Dwelling (A B C & D)
Number
Average Value
Number
Average Value
Number
Average Value
Number
Average Value
Number
Average Value
LOANS ORIGINATED
29
$175,043
46
$160,773
10
$95,153
5
$162,132
1
$36,110
APPLICATIONS APPROVED, NOT ACCEPTED
3
$184,777
4
$146,718
0
$0
1
$134,120
0
$0
APPLICATIONS DENIED
2
$185,505
19
$166,489
4
$123,305
2
$98,010
0
$0
APPLICATIONS WITHDRAWN
2
$162,885
13
$161,833
1
$154,750
0
$0
0
$0
FILES CLOSED FOR INCOMPLETENESS
1
$223,400
5
$220,066
0
$0
0
$0
0
$0
Aggregated Statistics For Year 2004 (Based on 2 partial tracts)
A) FHA, FSA/RHS & VA Home Purchase Loans
B) Conventional Home Purchase Loans
C) Refinancings
D) Home Improvement Loans
F) Non-occupant Loans on < 5 Family Dwellings (A B C & D)
Detailed PMIC statistics for the following Tracts:0406.00
2002 - 2018 National Fire Incident Reporting System (NFIRS) incidents
According to the data from the years 2002 - 2018 the average number of fire incidents per year is 13. The highest number of reported fire incidents - 28 took place in 2015, and the least - 5 in 2011. The data has a constant trend.
When looking into fire subcategories, the most incidents belonged to: Structure Fires (60.3%), and Outside Fires (30.4%).
Fire incident types reported to NFIRS in Zip Code 01054


 Nearest zip codes: 01375, 01072, 01351, 01003, 01349, 01347.


 According to the data from the years 2002 - 2018 the average number of fire incidents per year is 13. The highest number of reported fire incidents - 28 took place in 2015, and the least - 5 in 2011. The data has a constant trend.
 When looking into fire subcategories, the most incidents belonged to: Structure Fires (60.3%), and Outside Fires (30.4%).