Estimated zip code population in 2022: 11,208 Zip code population in 2010: 10,646 Zip code population in 2000: 9,547
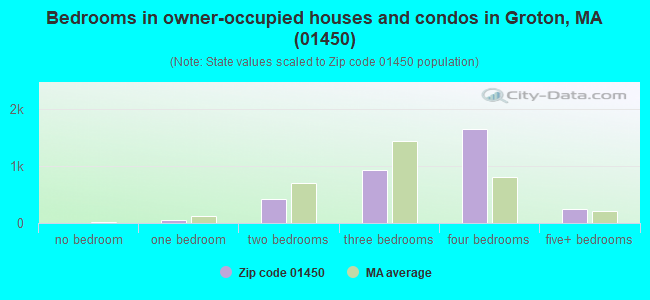
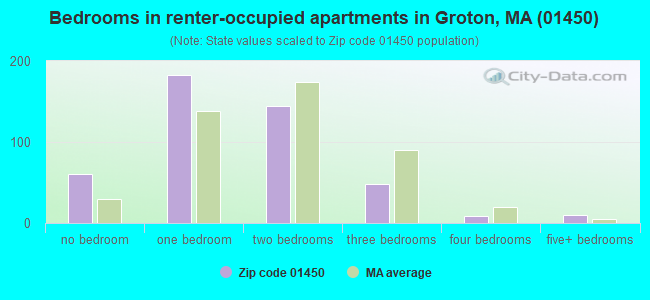
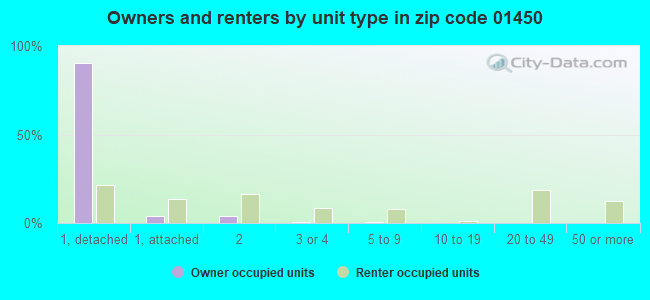
Houses and condos: 3,837 Renter-occupied apartments: 456
% of renters here:
12%
State:
38%
March 2022 cost of living index in zip code 01450: 130.1 (high, U.S. average is 100)
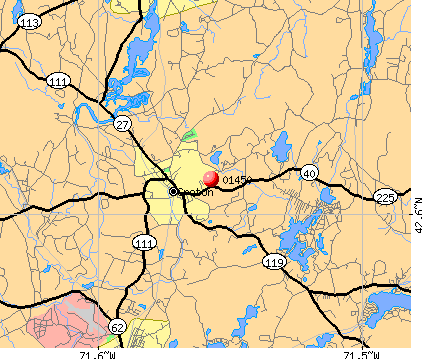
Land area: 32.8 sq. mi. Water area: 1.0 sq. mi.
Population density: 342 people per square mile
(very low).
OSM Map
Google Map
MSN Map
OSM Map
General Map
Google Map
MSN Map
OSM Map
Google Map
MSN Map
OSM Map
Google Map
MSN Map
Please wait while loading the map...
Real estate property taxes paid for housing units in 2022:
This zip code:
1.4% ($9,752)
Massachusetts:
1.0% ($5,536)
Median real estate property taxes paid for housing units with mortgages in 2022: $9,911 (1.4%) Median real estate property taxes paid for housing units with no mortgage in 2022: $8,930 (1.5%)
Business Search- 14 Million verified businesses
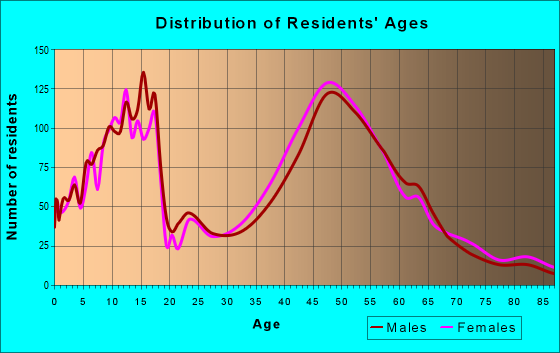
Males: 5,727
(51.1%)
Females: 5,481
(48.9%)
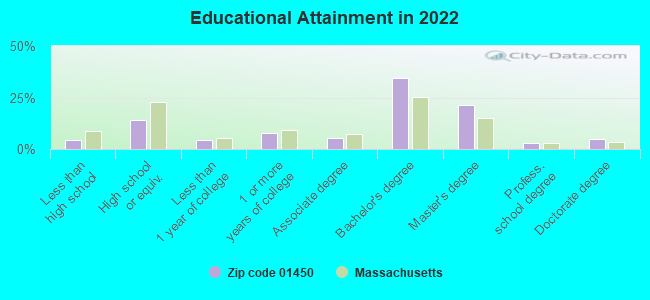
For population 25 years and over in 01450:
High school or higher: 96.3%
Bachelor's degree or higher: 64.5%
Graduate or professional degree: 29.7%
Unemployed: 3.8%
Mean travel time to work (commute): 31.4 minutes
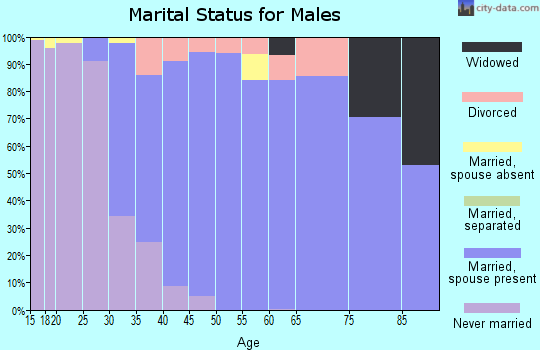
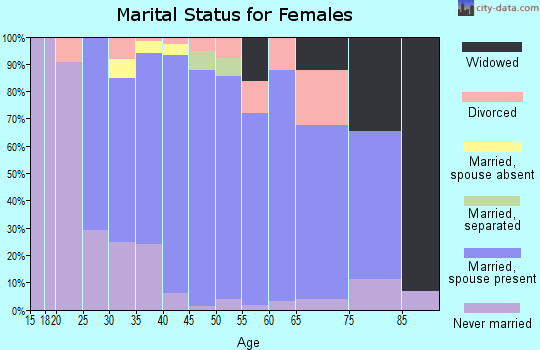
For population 15 years and over in 01450:
Never married: 28.0%
Now married: 57.3%
Separated: 1.3%
Widowed: 3.9%
Divorced: 9.5%
Zip code 01450 compared to state average:
Median household income above state average.
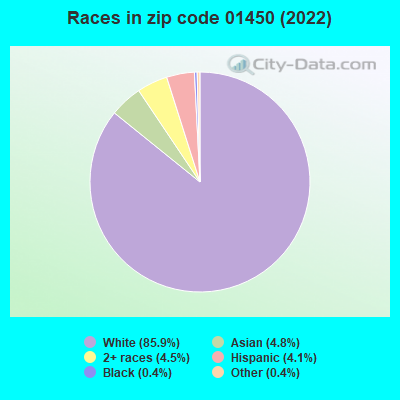
Black race population percentage significantly below state average.
Hispanic race population percentage significantly below state average.
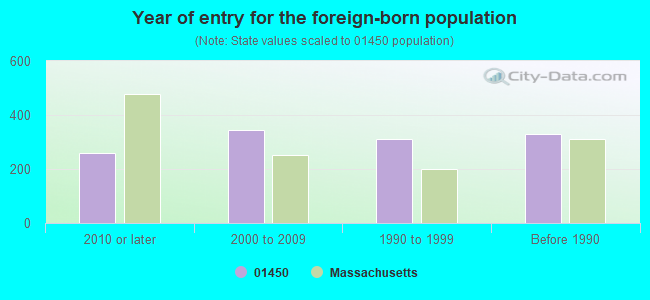
Foreign-born population percentage below state average.
Renting percentage significantly below state average.
Length of stay since moving in above state average.
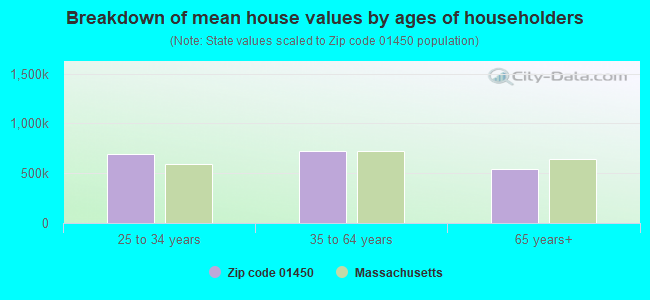
Estimated median house/condo value in 2022: $694,480
01450:
$694,480
Massachusetts:
$534,700
According to our research of Massachusetts and other state lists, there was 1 registered sex offender living in 01450 zip code as of April 25, 2024. The ratio of all residents to sex offenders in zip code 01450 is 11,342 to 1. The ratio of registered sex offenders to all residents in this zip code is much lower than the state average.
Median resident age:
This zip code:
41.5 years
Massachusetts median age:
40.3 years
Average household size:
This zip code:
2.9 people
Massachusetts:
2.4 people
Averages for the 2020 tax year for zip code 01450, filed in 2021:
Average Adjusted Gross Income (AGI) in 2020: $175,235 (Individual Income Tax Returns)
Here:
$175,235
State:
$105,130
Salary/wage: $133,601 (reported on 84.1% of returns)
Here:
$133,601
State:
$82,951
(% of AGI for various income ranges: 1115.7% for AGIs below $25k, 3894.5% for AGIs $25k-50k, 6653.4% for AGIs $50k-75k, 9889.6% for AGIs $75k-100k, 20392.9% for AGIs $100k-200k, 108717.8% for AGIs over 200k)
Taxable interest for individuals: $1,496 (reported on 58.0% of returns)
This zip code:
$1,496
Massachusetts:
$2,361
(% of AGI for various income ranges: 26.8% for AGIs below $25k, 40.2% for AGIs $25k-50k, 55.4% for AGIs $50k-75k, 91.9% for AGIs $75k-100k, 187.6% for AGIs $100k-200k, 721.1% for AGIs over 200k)
Ordinary dividends: $17,196 (reported on 39.8% of returns)
Here:
$17,196
State:
$10,365
(% of AGI for various income ranges: 59.0% for AGIs below $25k, 94.7% for AGIs $25k-50k, 178.0% for AGIs $50k-75k, 340.0% for AGIs $75k-100k, 545.7% for AGIs $100k-200k, 8541.1% for AGIs over 200k)
Net capital gain/loss in AGI: +$29,795 (reported on 37.4% of returns)
Here:
+$29,795
State:
+$48,178
(% of AGI for various income ranges: 31.4% for AGIs below $25k, 102.8% for AGIs $25k-50k, 164.9% for AGIs $50k-75k, 307.4% for AGIs $75k-100k, 867.2% for AGIs $100k-200k, 14476.5% for AGIs over 200k)
Profit/loss from business: +$31,994 (reported on 17.2% of returns)
Here:
+$31,994
State:
+$20,792
(% of AGI for various income ranges: 60.3% for AGIs below $25k, 321.9% for AGIs $25k-50k, 370.5% for AGIs $50k-75k, 661.5% for AGIs $75k-100k, 1296.2% for AGIs $100k-200k, 4413.0% for AGIs over 200k)
Taxable individual retirement arrangement distribution: $26,037 (reported on 12.1% of returns)
01450:
$26,037
Massachusetts:
$22,790
(% of AGI for various income ranges: 70.0% for AGIs below $25k, 169.8% for AGIs $25k-50k, 377.3% for AGIs $50k-75k, 599.3% for AGIs $75k-100k, 936.9% for AGIs $100k-200k, 1785.7% for AGIs over 200k)
Self-employed (Keogh) retirement plans: $22,558 (reported on 2.2% of returns)
01450:
$22,558
Massachusetts:
$26,868
(% of AGI for various income ranges: 100.9% for AGIs $100k-200k, 546.2% for AGIs over 200k)
Total itemized deductions: $32,985 (reported on 19.9% of returns)
Here:
$32,985
State:
$36,722
(% of AGI for various income ranges: 175.8% for AGIs below $25k, 275.1% for AGIs $25k-50k, 558.3% for AGIs $50k-75k, 675.6% for AGIs $75k-100k, 1349.0% for AGIs $100k-200k, 5524.1% for AGIs over 200k)
Charity contributions: $9,322 (reported on 15.4% of returns)
Here:
$9,322
State:
$12,529
(% of AGI for various income ranges: 4.3% for AGIs below $25k, 18.1% for AGIs $25k-50k, 46.3% for AGIs $50k-75k, 80.4% for AGIs $75k-100k, 148.7% for AGIs $100k-200k, 1727.0% for AGIs over 200k)
Taxes paid: $9,500 (reported on 19.9% of returns)
01450:
$9,500
State:
$8,782
(% of AGI for various income ranges: 42.9% for AGIs below $25k, 89.4% for AGIs $25k-50k, 202.4% for AGIs $50k-75k, 270.7% for AGIs $75k-100k, 453.7% for AGIs $100k-200k, 1371.6% for AGIs over 200k)
Earned income credit: $1,400 (reported on 3.4% of returns)
Here:
$1,400
State:
$1,909
(% of AGI for various income ranges: 18.8% for AGIs below $25k, 27.9% for AGIs $25k-50k)
Percentage of individuals using paid preparers for their 2020 taxes: 91.9%
Here:
92%
State:
92%
(% for various income ranges: 89.6% for AGIs below $25k, 92.8% for AGIs $25k-50k, 91.9% for AGIs $50k-75k, 91.1% for AGIs $75k-100k, 92.1% for AGIs $100k-200k, 93.6% for AGIs over 200k)
Averages for the 2012 tax year for zip code 01450, filed in 2013:
Average Adjusted Gross Income (AGI) in 2012: $140,839 (Individual Income Tax Returns)
Here:
$140,839
State:
$81,425
Salary/wage: $106,825 (reported on 85.2% of returns)
Here:
$106,825
State:
$64,752
(% of AGI for various income ranges: 68.5% for AGIs below $25k, 72.7% for AGIs $25k-50k, 69.5% for AGIs $50k-75k, 76.3% for AGIs $75k-100k, 83.8% for AGIs $100k-200k, 54.4% for AGIs over 200k)
Taxable interest for individuals: $1,680 (reported on 55.0% of returns)
This zip code:
$1,680
Massachusetts:
$2,136
(% of AGI for various income ranges: 1.9% for AGIs below $25k, 1.4% for AGIs $25k-50k, 0.8% for AGIs $50k-75k, 0.7% for AGIs $75k-100k, 0.4% for AGIs $100k-200k, 0.7% for AGIs over 200k)
Ordinary dividends: $8,672 (reported on 40.4% of returns)
Here:
$8,672
State:
$9,473
(% of AGI for various income ranges: 4.1% for AGIs below $25k, 2.3% for AGIs $25k-50k, 3.3% for AGIs $50k-75k, 2.0% for AGIs $75k-100k, 1.8% for AGIs $100k-200k, 2.7% for AGIs over 200k)
Net capital gain/loss in AGI: +$21,945 (reported on 35.1% of returns)
Here:
+$21,945
State:
+$31,437
(% of AGI for various income ranges: 1.1% for AGIs below $25k, 0.9% for AGIs $25k-50k, 0.3% for AGIs $50k-75k, 0.9% for AGIs $75k-100k, 1.0% for AGIs $100k-200k, 8.6% for AGIs over 200k)
Profit/loss from business: +$25,942 (reported on 18.9% of returns)
Here:
+$25,942
State:
+$20,662
(% of AGI for various income ranges: 9.1% for AGIs below $25k, 7.0% for AGIs $25k-50k, 7.5% for AGIs $50k-75k, 5.8% for AGIs $75k-100k, 3.7% for AGIs $100k-200k, 2.4% for AGIs over 200k)
Taxable individual retirement arrangement distribution: $20,640 (reported on 11.6% of returns)
01450:
$20,640
Massachusetts:
$18,892
(% of AGI for various income ranges: 3.4% for AGIs below $25k, 3.0% for AGIs $25k-50k, 4.5% for AGIs $50k-75k, 2.3% for AGIs $75k-100k, 2.7% for AGIs $100k-200k, 0.9% for AGIs over 200k)
Self-employment retirement plans: $17,870 (reported on 2.0% of returns)
01450:
$17,870
Massachusetts:
$20,669
(% of AGI for various income ranges: 0.9% for AGIs $25k-50k, 0.2% for AGIs $100k-200k, 0.3% for AGIs over 200k)
Total itemized deductions: $37,992 (17% of AGI, reported on 58.8% of returns)
Here:
$37,992
State:
$28,907
Here:
17.4% of AGI
State:
18.2% of AGI
(% of AGI for various income ranges: 23.8% for AGIs below $25k, 15.3% for AGIs $25k-50k, 18.8% for AGIs $50k-75k, 19.0% for AGIs $75k-100k, 18.1% for AGIs $100k-200k, 14.2% for AGIs over 200k)
Charity contributions: $3,111 (reported on 49.7% of returns)
Here:
$3,111
State:
$4,208
(% of AGI for various income ranges: 0.9% for AGIs below $25k, 0.8% for AGIs $25k-50k, 1.1% for AGIs $50k-75k, 1.1% for AGIs $75k-100k, 1.3% for AGIs $100k-200k, 1.1% for AGIs over 200k)
Taxes paid: $17,712 (reported on 58.6% of returns)
01450:
$17,712
State:
$13,303
(% of AGI for various income ranges: 6.1% for AGIs below $25k, 5.7% for AGIs $25k-50k, 7.7% for AGIs $50k-75k, 8.2% for AGIs $75k-100k, 9.3% for AGIs $100k-200k, 6.6% for AGIs over 200k)
Earned income credit: $1,686 (reported on 4.3% of returns)
Here:
$1,686
State:
$1,971
(% of AGI for various income ranges: 2.0% for AGIs below $25k, 0.4% for AGIs $25k-50k)
Percentage of individuals using paid preparers for their 2012 taxes: 49.7%
Here:
50%
State:
56%
(% for various income ranges: 40.6% for AGIs below $25k, 50.8% for AGIs $25k-50k, 52.9% for AGIs $50k-75k, 57.8% for AGIs $75k-100k, 48.4% for AGIs $100k-200k, 59.7% for AGIs over 200k)
Averages for the 2004 tax year for zip code 01450, filed in 2005:
Average Adjusted Gross Income (AGI) in 2004: $107,000 (Individual Income Tax Returns)
Here:
$107,000
State:
$62,877
Salary/wage: $83,242 (reported on 84.4% of returns)
Here:
$83,242
State:
$52,969
(% of AGI for various income ranges: 86.9% for AGIs below $10k, 65.0% for AGIs $10k-25k, 72.9% for AGIs $25k-50k, 78.2% for AGIs $50k-75k, 83.3% for AGIs $75k-100k, 61.9% for AGIs over 100k)
Taxable interest for individuals: $1,591 (reported on 71.3% of returns)
This zip code:
$1,591
Massachusetts:
$1,945
(% of AGI for various income ranges: 5.8% for AGIs below $10k, 2.5% for AGIs $10k-25k, 2.2% for AGIs $25k-50k, 1.7% for AGIs $50k-75k, 1.0% for AGIs $75k-100k, 0.9% for AGIs over 100k)
Taxable dividends: $5,753 (reported on 45.5% of returns)
Here:
$5,753
State:
$5,323
(% of AGI for various income ranges: 10.3% for AGIs below $10k, 2.5% for AGIs $10k-25k, 2.8% for AGIs $25k-50k, 2.1% for AGIs $50k-75k, 1.6% for AGIs $75k-100k, 2.5% for AGIs over 100k)
Net capital gain/loss: +$15,766 (reported on 41.0% of returns)
Here:
+$15,766
State:
+$20,377
(% of AGI for various income ranges: -7.6% for AGIs below $10k, 1.5% for AGIs $10k-25k, 0.5% for AGIs $25k-50k, 1.0% for AGIs $50k-75k, 1.1% for AGIs $75k-100k, 7.6% for AGIs over 100k)
Profit/loss from business: +$20,127 (reported on 20.0% of returns)
Here:
+$20,127
State:
+$17,837
(% of AGI for various income ranges: 7.4% for AGIs below $10k, 12.9% for AGIs $10k-25k, 9.6% for AGIs $25k-50k, 6.1% for AGIs $50k-75k, 5.6% for AGIs $75k-100k, 2.7% for AGIs over 100k)
IRA payment deduction: $3,099 (reported on 3.8% of returns)
01450:
$3,099
Massachusetts:
$3,100
(% of AGI for various income ranges: 0.3% for AGIs $10k-25k, 0.4% for AGIs $25k-50k, 0.3% for AGIs $50k-75k, 0.2% for AGIs $75k-100k, 0.1% for AGIs over 100k)
Self-employed pension: $14,719 (reported on 2.7% of returns)
Here:
$14,719
Massachusetts:
$14,516
(% of AGI for various income ranges: 0.6% for AGIs $25k-50k, 0.2% for AGIs $50k-75k, 0.3% for AGIs $75k-100k, 0.4% for AGIs over 100k)
Total itemized deductions: $29,086 (18% of AGI, reported on 61.5% of returns)
Here:
$29,086
State:
$22,573
Here:
18.2% of AGI
State:
19.5% of AGI
(% of AGI for various income ranges: 34.8% for AGIs below $10k, 21.0% for AGIs $10k-25k, 19.5% for AGIs $25k-50k, 23.2% for AGIs $50k-75k, 22.0% for AGIs $75k-100k, 15.1% for AGIs over 100k)
Charity contributions deductions: $3,468 (2% of AGI, reported on 56.1% of returns)
Here:
$3,468
State:
$3,295
Here:
2.1% of AGI
State:
2.7% of AGI
(% of AGI for various income ranges: 1.3% for AGIs below $10k, 1.4% for AGIs $10k-25k, 1.5% for AGIs $25k-50k, 1.5% for AGIs $50k-75k, 1.5% for AGIs $75k-100k, 1.9% for AGIs over 100k)
Total tax: $22,877 (reported on 83.4% of returns)
01450:
$22,877
State:
$11,494
(% of AGI for various income ranges: 3.2% for AGIs below $10k, 6.0% for AGIs $10k-25k, 8.6% for AGIs $25k-50k, 9.0% for AGIs $50k-75k, 9.8% for AGIs $75k-100k, 20.6% for AGIs over 100k)
Earned income credit: $1,293 (reported on 3.3% of returns)
Here:
$1,293
State:
$1,518
Percentage of individuals using paid preparers for their 2004 taxes: 50.8%
Here:
51%
State:
58%
(% for various income ranges: 41.6% for AGIs below $10k, 51.4% for AGIs $10k-25k, 52.3% for AGIs $25k-50k, 58.4% for AGIs $50k-75k, 52.4% for AGIs $75k-100k, 52.0% for AGIs over 100k)
Likely homosexual households (counted as self-reported same-sex unmarried-partner households)
Lesbian couples: 0.5% of all households
Gay men: 0.0% of all households
Household received Food Stamps/SNAP in the past 12 months: 181 Household did not receive Food Stamps/SNAP in the past 12 months: 3,520
Women who had a birth in the past 12 months: 33 (34 now married, 0 unmarried) Women who did not have a birth in the past 12 months: 2,270 (1,048 now married, 1,208 unmarried)
Housing units in zip code 01450 with a mortgage: 2,302 (479 second mortgage, 459 both second mortgage and home equity loan) Houses without a mortgage: 31
Median monthly owner costs for units with a mortgage: $3,305 Median monthly owner costs for units without a mortgage: $1,155
Residents with income below the poverty level in 2022:
This zip code:
4.8%
Whole state:
10.4%
Residents with income below 50% of the poverty level in 2022:
This zip code:
1.7%
Whole state:
5.1%
Median number of rooms in houses and condos:
Here:
8.0
State:
6.5
Median number of rooms in apartments:
Here:
3.5
State:
4.0
Notable locations in this zip code not listed on our city pages
Notable locations in zip code 01450: Autumn Hill Orchards (A), Grotan Fairgrounds (B), Groton Hills Ski Area (C), Groton Country Club (D), Groton Fire Department Station 2 (E), Groton Fire Department Station 3 (F), Groton Fire Department Station 1 (G), Groton-Dunstable Middle School Library (H), Groton Public Library (I), Groton Town Hall (J). Display/hide their locations on the map
Churches in zip code 01450 include: Holy Union Novitiate (A), Christian Union Church (B), Union Congregational Church (C), Shepherd of the Valley Church (D), First Baptist Church of Groton (E), Christian Union Church (F). Display/hide their locations on the map
In group quarters: 296 (-1 institutionalized population)
Size of family households: 880 2-persons, 624 3-persons, 776 4-persons, 377 5-persons, 91 6-persons, 43 7-or-more-persons
Size of nonfamily households: 782 1-person, 146 2-persons, 17 3-persons
2,312 married couples with children.
247 single-parent households (57 men, 190 women).
90.3% of residents of 01450 zip code speak English at home.
1.5% of residents speak Spanish at home (87% very well, 8% well, 5% not well).
4.5% of residents speak other Indo-European language at home (74% very well, 13% well, 13% not well).
2.2% of residents speak Asian or Pacific Island language at home (83% very well, 7% well, 10% not well).
0.8% of residents speak other language at home (53% very well, 32% well, 15% not well).
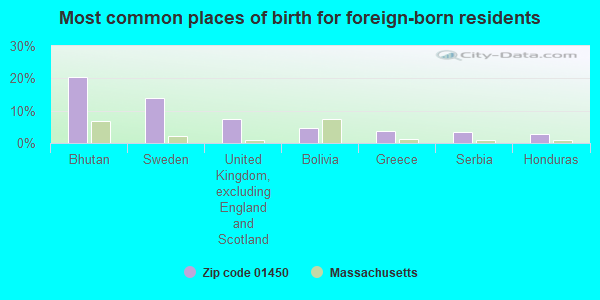
Foreign born population: 1,096 (9.8%) (55.0% of them are naturalized citizens)
This zip code:
9.8%
Whole state:
18.0%
20%Bhutan
14%Sweden
7%United Kingdom, excluding England and Scotland
5%Bolivia
4%Greece
3%Serbia
3%Honduras
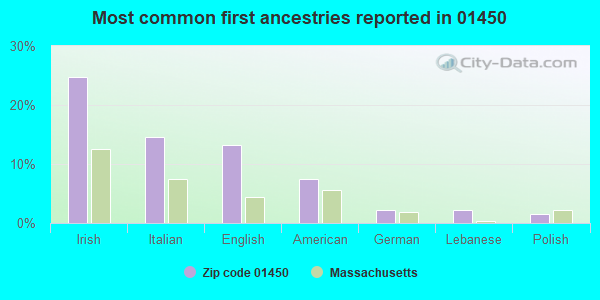
25%Irish
15%Italian
13%English
7%American
2%German
2%Lebanese
2%Polish
Year of entry for the foreign-born population
2612010 or later
3432000 to 2009
3111990 to 1999
330Before 1990
Facilities with environmental interests located in this zip code:
ARCHAEOLOGICAL CONSERVATION LAB INC (316 BOSTON RD in GROTON, MA)
(Resource Conservation and Recovery Act (tracking hazardous waste))
WORLEY JOHN W (44 FARMERS ROW in GROTON, MA)
Conditionally Exempt Small Quantity Generators, less than 100 kg/month of hazardous waste (Resource Conservation and Recovery Act (tracking hazardous waste)) - notification Organizations: JOHN W WORLEY (CONTACT/OWNER)
BOUTWELL SCHOOL (78 HOLLIS ST in GROTON, MA)
(Geographic Names Information System) COMPLIANCE ACTIVITY (Tracking inspections of insecticide, fungicide, and rodenticide, and toxic substances)
MILLERS FRED AUTO BODY (1025 LOWELL RD in GROTON, MA)
Conditionally Exempt Small Quantity Generators, less than 100 kg/month of hazardous waste (Resource Conservation and Recovery Act (tracking hazardous waste)) - notification
MILL STREET JUNKYARD (MILL STREET in GROTON, MA)
SUPERFUND (Superfund database) Alternative names: CLAPP JUNKYARD
Housing units lacking complete plumbing facilities: 0.6% Housing units lacking complete kitchen facilities: 1.5%
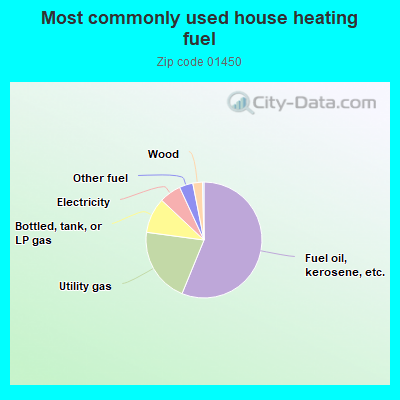
56.3%Fuel oil, kerosene, etc.
21.0%Utility gas
9.9%Bottled, tank, or LP gas
6.1%Electricity
3.8%Other fuel
2.7%Wood
Population in 1990: 7,504. Population change in the 1990s: +2,043 (+27.2%).
Place of birth for U.S.-born residents:
This state: 6,134
Northeast: 2,064
Midwest: 650
South: 736
West: 351
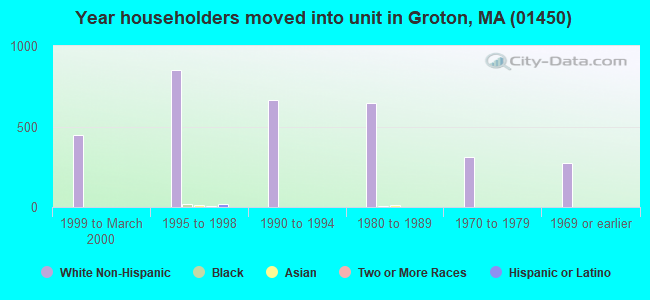
61% of the 01450 zip code residents lived in the same house 5 years ago. Out of people who lived in different houses, 64% lived in this county. Out of people who lived in different counties, 50% lived in Massachusetts.
94% of the 01450 zip code residents lived in the same house 1 year ago. Out of people who lived in different houses, 61% moved from this county. Out of people who lived in different houses, 12% moved from different county within same state. Out of people who lived in different houses, 27% moved from different state.
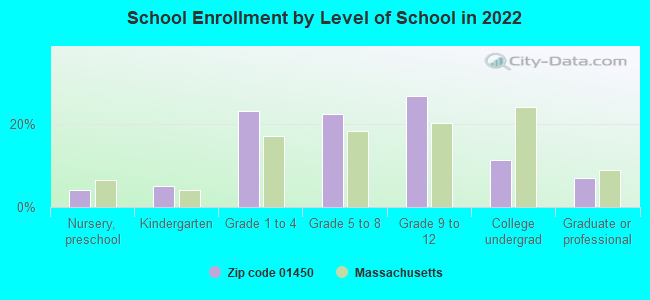
Private vs. public school enrollment:
Students in private schools in grades 1 to 8 (elementary and middle school): 47
Here:
3.2%
Massachusetts:
10.3%
Students in private schools in grades 9 to 12 (high school): 110
Here:
12.7%
Massachusetts:
12.3%
Students in private undergraduate colleges: 148
Here:
40.1%
Massachusetts:
51.2%
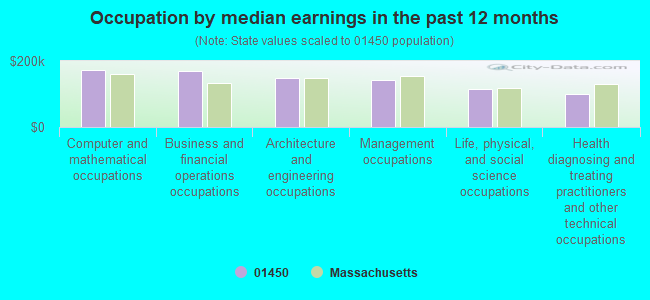
Occupation by median earnings in the past 12 months ($)
174,020Computer and mathematical occupations
168,880Business and financial operations occupations
148,009Architecture and engineering occupations
143,509Management occupations
114,917Life, physical, and social science occupations
100,892Health diagnosing and treating practitioners and other technical occupations
Companies with federal contracts located in this zip code:
environ international corporation (274 Main Street in Groton, MA)
$91,090 with Offices, Boards and Divisions (includes Attorney General, Deputy Attorney General, etc.) for Expert Witness. Signed on 2004-08-26. Completion date: 2006-08-25.
Top industries in this zip code by the number of employees in 2005:
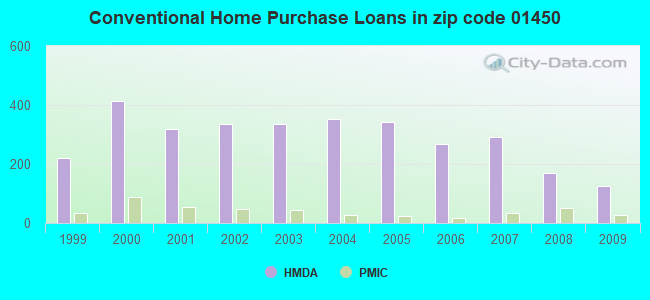
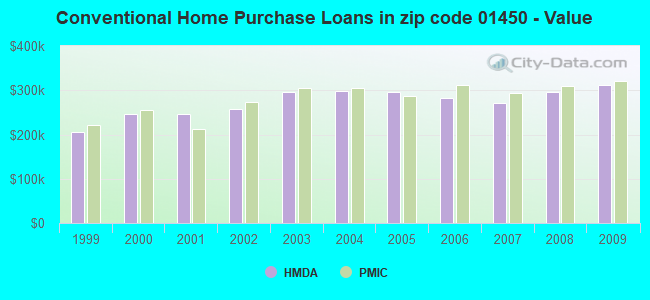
Detailed PMIC statistics for the following Tracts:3261.00
2002 - 2018 National Fire Incident Reporting System (NFIRS) incidents
Based on the data from the years 2002 - 2018 the average number of fires per year is 28. The highest number of reported fires - 69 took place in 2016, and the least - 4 in 2002. The data has an increasing trend.
When looking into fire subcategories, the most incidents belonged to: Structure Fires (48.7%), and Outside Fires (41.7%).
Fire incident types reported to NFIRS in Zip Code 01450


 Nearest zip codes: 01432, 01463, 01464, 01434, 01827, 01460.


 Based on the data from the years 2002 - 2018 the average number of fires per year is 28. The highest number of reported fires - 69 took place in 2016, and the least - 4 in 2002. The data has an increasing trend.
 When looking into fire subcategories, the most incidents belonged to: Structure Fires (48.7%), and Outside Fires (41.7%).