Estimated zip code population in 2022: 8,217 Zip code population in 2010: 7,277 Zip code population in 2000: 6,904
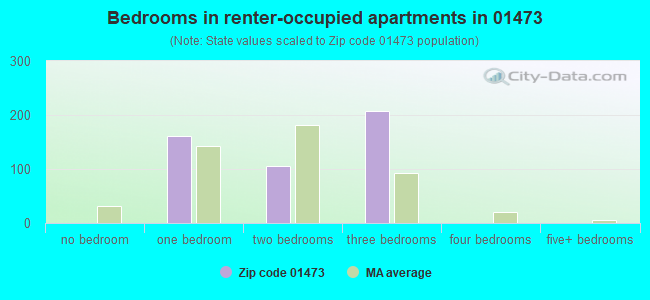
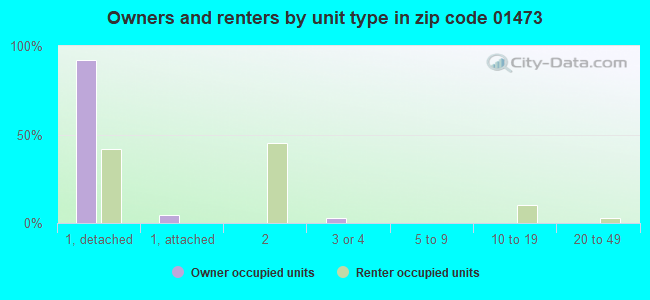
Houses and condos: 3,493 Renter-occupied apartments: 471
% of renters here:
14%
State:
38%
March 2022 cost of living index in zip code 01473: 114.4 (more than average, U.S. average is 100)
Land area: 35.4 sq. mi. Water area: 1.8 sq. mi.
Population density: 232 people per square mile
(very low).
OSM Map
Google Map
MSN Map
OSM Map
General Map
Google Map
MSN Map
OSM Map
Google Map
MSN Map
OSM Map
Google Map
MSN Map
Please wait while loading the map...
Real estate property taxes paid for housing units in 2022:
This zip code:
1.3% ($5,341)
Massachusetts:
1.0% ($5,536)
Median real estate property taxes paid for housing units with mortgages in 2022: $5,095 (1.2%) Median real estate property taxes paid for housing units with no mortgage in 2022: $5,678 (1.6%)
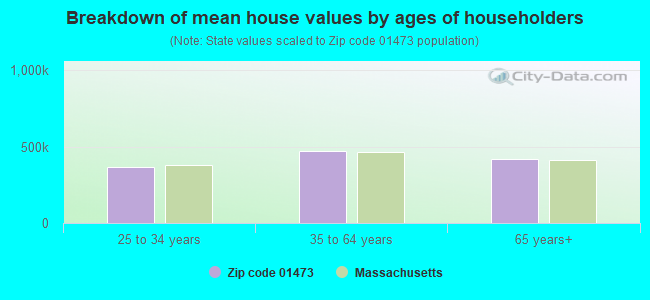
Estimated median house/condo value in 2022: $409,064
01473:
$409,064
Massachusetts:
$534,700
According to our research of Massachusetts and other state lists, there were 2 registered sex offenders living in 01473 zip code as of April 19, 2024. The ratio of all residents to sex offenders in zip code 01473 is 3,794 to 1. The ratio of registered sex offenders to all residents in this zip code is much lower than the state average.
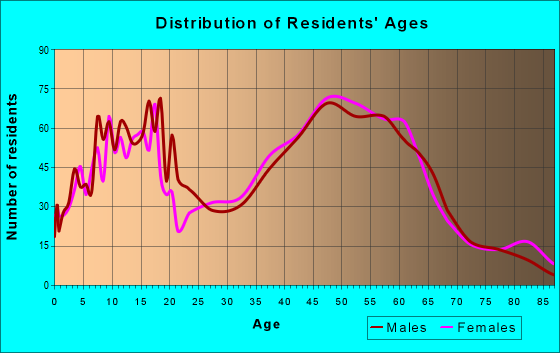
Median resident age:
This zip code:
49.2 years
Massachusetts median age:
40.3 years
Average household size:
This zip code:
2.5 people
Massachusetts:
2.4 people
Averages for the 2020 tax year for zip code 01473, filed in 2021:
Average Adjusted Gross Income (AGI) in 2020: $88,365 (Individual Income Tax Returns)
Here:
$88,365
State:
$105,130
Salary/wage: $76,127 (reported on 81.5% of returns)
Here:
$76,127
State:
$82,951
(% of AGI for various income ranges: 1128.2% for AGIs below $25k, 3309.6% for AGIs $25k-50k, 6337.3% for AGIs $50k-75k, 8615.1% for AGIs $75k-100k, 18212.6% for AGIs $100k-200k, 54460.8% for AGIs over 200k)
Taxable interest for individuals: $828 (reported on 53.1% of returns)
This zip code:
$828
Massachusetts:
$2,361
(% of AGI for various income ranges: 28.6% for AGIs below $25k, 34.1% for AGIs $25k-50k, 55.7% for AGIs $50k-75k, 63.1% for AGIs $75k-100k, 88.6% for AGIs $100k-200k, 396.2% for AGIs over 200k)
Ordinary dividends: $3,415 (reported on 24.1% of returns)
Here:
$3,415
State:
$10,365
(% of AGI for various income ranges: 28.0% for AGIs below $25k, 25.9% for AGIs $25k-50k, 70.0% for AGIs $50k-75k, 82.3% for AGIs $75k-100k, 196.0% for AGIs $100k-200k, 1096.2% for AGIs over 200k)
Net capital gain/loss in AGI: +$15,278 (reported on 21.9% of returns)
Here:
+$15,278
State:
+$48,178
(% of AGI for various income ranges: 16.4% for AGIs below $25k, 27.6% for AGIs $25k-50k, 124.3% for AGIs $50k-75k, 110.3% for AGIs $75k-100k, 533.1% for AGIs $100k-200k, 7701.5% for AGIs over 200k)
Profit/loss from business: +$21,620 (reported on 16.2% of returns)
Here:
+$21,620
State:
+$20,792
(% of AGI for various income ranges: 127.1% for AGIs below $25k, 310.4% for AGIs $25k-50k, 313.4% for AGIs $50k-75k, 274.6% for AGIs $75k-100k, 695.8% for AGIs $100k-200k, 4593.8% for AGIs over 200k)
Taxable individual retirement arrangement distribution: $17,335 (reported on 12.3% of returns)
01473:
$17,335
Massachusetts:
$22,790
(% of AGI for various income ranges: 86.2% for AGIs below $25k, 182.8% for AGIs $25k-50k, 280.0% for AGIs $50k-75k, 442.9% for AGIs $75k-100k, 604.3% for AGIs $100k-200k, 842.3% for AGIs over 200k)
Self-employed (Keogh) retirement plans: $25,433 (reported on 0.7% of returns)
01473:
$25,433
Massachusetts:
$26,868
(% of AGI for various income ranges: 117.4% for AGIs $100k-200k)
Total itemized deductions: $25,194 (reported on 11.2% of returns)
Here:
$25,194
State:
$36,722
(% of AGI for various income ranges: 65.9% for AGIs below $25k, 156.9% for AGIs $25k-50k, 470.5% for AGIs $50k-75k, 446.3% for AGIs $75k-100k, 727.4% for AGIs $100k-200k, 2079.2% for AGIs over 200k)
Charity contributions: $4,003 (reported on 7.7% of returns)
Here:
$4,003
State:
$12,529
(% of AGI for various income ranges: 9.6% for AGIs $25k-50k, 20.9% for AGIs $50k-75k, 47.4% for AGIs $75k-100k, 94.6% for AGIs $100k-200k, 335.4% for AGIs over 200k)
Taxes paid: $8,531 (reported on 11.2% of returns)
01473:
$8,531
State:
$8,782
(% of AGI for various income ranges: 15.0% for AGIs below $25k, 45.2% for AGIs $25k-50k, 143.2% for AGIs $50k-75k, 169.7% for AGIs $75k-100k, 265.2% for AGIs $100k-200k, 683.8% for AGIs over 200k)
Earned income credit: $1,552 (reported on 6.2% of returns)
Here:
$1,552
State:
$1,909
(% of AGI for various income ranges: 34.7% for AGIs below $25k, 35.2% for AGIs $25k-50k)
Percentage of individuals using paid preparers for their 2020 taxes: 92.3%
Here:
92%
State:
92%
(% for various income ranges: 89.5% for AGIs below $25k, 91.9% for AGIs $25k-50k, 93.8% for AGIs $50k-75k, 92.3% for AGIs $75k-100k, 92.8% for AGIs $100k-200k, 97.0% for AGIs over 200k)
Averages for the 2012 tax year for zip code 01473, filed in 2013:
Average Adjusted Gross Income (AGI) in 2012: $71,298 (Individual Income Tax Returns)
Here:
$71,298
State:
$81,425
Salary/wage: $61,237 (reported on 85.7% of returns)
Here:
$61,237
State:
$64,752
(% of AGI for various income ranges: 70.9% for AGIs below $25k, 74.4% for AGIs $25k-50k, 77.8% for AGIs $50k-75k, 74.4% for AGIs $75k-100k, 82.3% for AGIs $100k-200k, 56.2% for AGIs over 200k)
Taxable interest for individuals: $748 (reported on 47.9% of returns)
This zip code:
$748
Massachusetts:
$2,136
(% of AGI for various income ranges: 1.4% for AGIs below $25k, 0.7% for AGIs $25k-50k, 0.6% for AGIs $50k-75k, 0.4% for AGIs $75k-100k, 0.4% for AGIs $100k-200k, 0.4% for AGIs over 200k)
Ordinary dividends: $3,079 (reported on 23.8% of returns)
Here:
$3,079
State:
$9,473
(% of AGI for various income ranges: 1.7% for AGIs below $25k, 0.7% for AGIs $25k-50k, 0.9% for AGIs $50k-75k, 0.6% for AGIs $75k-100k, 1.0% for AGIs $100k-200k, 1.6% for AGIs over 200k)
Net capital gain/loss in AGI: +$5,261 (reported on 18.5% of returns)
Here:
+$5,261
State:
+$31,437
(% of AGI for various income ranges: 0.4% for AGIs $75k-100k, 1.0% for AGIs $100k-200k, 4.4% for AGIs over 200k)
Profit/loss from business: +$20,759 (reported on 15.6% of returns)
Here:
+$20,759
State:
+$20,662
(% of AGI for various income ranges: 9.5% for AGIs below $25k, 6.5% for AGIs $25k-50k, 5.9% for AGIs $50k-75k, 5.3% for AGIs $75k-100k, 2.5% for AGIs $100k-200k, 4.4% for AGIs over 200k)
Taxable individual retirement arrangement distribution: $16,134 (reported on 10.8% of returns)
01473:
$16,134
Massachusetts:
$18,892
(% of AGI for various income ranges: 4.1% for AGIs below $25k, 3.8% for AGIs $25k-50k, 2.8% for AGIs $50k-75k, 3.2% for AGIs $75k-100k, 2.9% for AGIs $100k-200k)
Self-employment retirement plans: $14,500 (reported on 0.8% of returns)
01473:
$14,500
Massachusetts:
$20,669
Total itemized deductions: $22,097 (19% of AGI, reported on 46.8% of returns)
Here:
$22,097
State:
$28,907
Here:
19.2% of AGI
State:
18.2% of AGI
(% of AGI for various income ranges: 16.3% for AGIs below $25k, 12.5% for AGIs $25k-50k, 15.9% for AGIs $50k-75k, 16.2% for AGIs $75k-100k, 15.8% for AGIs $100k-200k, 10.8% for AGIs over 200k)
Charity contributions: $2,119 (reported on 36.5% of returns)
Here:
$2,119
State:
$4,208
(% of AGI for various income ranges: 0.7% for AGIs below $25k, 0.7% for AGIs $25k-50k, 1.1% for AGIs $50k-75k, 1.2% for AGIs $75k-100k, 1.2% for AGIs $100k-200k, 1.0% for AGIs over 200k)
Taxes paid: $10,406 (reported on 46.8% of returns)
01473:
$10,406
State:
$13,303
(% of AGI for various income ranges: 4.9% for AGIs below $25k, 4.2% for AGIs $25k-50k, 6.6% for AGIs $50k-75k, 7.2% for AGIs $75k-100k, 7.8% for AGIs $100k-200k, 6.7% for AGIs over 200k)
Earned income credit: $1,733 (reported on 7.9% of returns)
Here:
$1,733
State:
$1,971
(% of AGI for various income ranges: 3.0% for AGIs below $25k, 0.5% for AGIs $25k-50k)
Percentage of individuals using paid preparers for their 2012 taxes: 56.1%
Here:
56%
State:
56%
(% for various income ranges: 47.4% for AGIs below $25k, 53.9% for AGIs $25k-50k, 61.8% for AGIs $50k-75k, 62.5% for AGIs $75k-100k, 59.7% for AGIs $100k-200k, 76.9% for AGIs over 200k)
Averages for the 2004 tax year for zip code 01473, filed in 2005:
Average Adjusted Gross Income (AGI) in 2004: $56,551 (Individual Income Tax Returns)
Here:
$56,551
State:
$62,877
Salary/wage: $51,838 (reported on 87.0% of returns)
Here:
$51,838
State:
$52,969
(% of AGI for various income ranges: 120.2% for AGIs below $10k, 70.8% for AGIs $10k-25k, 77.9% for AGIs $25k-50k, 84.5% for AGIs $50k-75k, 85.0% for AGIs $75k-100k, 75.5% for AGIs over 100k)
Taxable interest for individuals: $1,051 (reported on 65.7% of returns)
This zip code:
$1,051
Massachusetts:
$1,945
(% of AGI for various income ranges: 5.9% for AGIs below $10k, 3.8% for AGIs $10k-25k, 1.4% for AGIs $25k-50k, 0.6% for AGIs $50k-75k, 0.7% for AGIs $75k-100k, 1.3% for AGIs over 100k)
Taxable dividends: $1,817 (reported on 29.7% of returns)
Here:
$1,817
State:
$5,323
(% of AGI for various income ranges: 3.9% for AGIs below $10k, 1.9% for AGIs $10k-25k, 0.8% for AGIs $25k-50k, 0.7% for AGIs $50k-75k, 0.5% for AGIs $75k-100k, 1.2% for AGIs over 100k)
Net capital gain/loss: +$6,667 (reported on 23.6% of returns)
Here:
+$6,667
State:
+$20,377
(% of AGI for various income ranges: -3.5% for AGIs below $10k, 0.0% for AGIs $10k-25k, 0.4% for AGIs $25k-50k, 0.8% for AGIs $50k-75k, 1.1% for AGIs $75k-100k, 5.8% for AGIs over 100k)
Profit/loss from business: +$16,359 (reported on 17.4% of returns)
Here:
+$16,359
State:
+$17,837
(% of AGI for various income ranges: 7.6% for AGIs below $10k, 8.2% for AGIs $10k-25k, 7.3% for AGIs $25k-50k, 4.8% for AGIs $50k-75k, 3.3% for AGIs $75k-100k, 4.8% for AGIs over 100k)
IRA payment deduction: $3,053 (reported on 4.3% of returns)
01473:
$3,053
Massachusetts:
$3,100
(% of AGI for various income ranges: 0.5% for AGIs $10k-25k, 0.5% for AGIs $25k-50k, 0.2% for AGIs $50k-75k, 0.2% for AGIs $75k-100k, 0.1% for AGIs over 100k)
Self-employed pension: $8,482 (reported on 1.6% of returns)
Here:
$8,482
Massachusetts:
$14,516
(% of AGI for various income ranges: 0.5% for AGIs $10k-25k, 0.2% for AGIs $50k-75k, 0.2% for AGIs $75k-100k, 0.3% for AGIs over 100k)
Total itemized deductions: $18,748 (21% of AGI, reported on 49.8% of returns)
Here:
$18,748
State:
$22,573
Here:
21.4% of AGI
State:
19.5% of AGI
(% of AGI for various income ranges: 22.8% for AGIs below $10k, 13.5% for AGIs $10k-25k, 16.0% for AGIs $25k-50k, 18.1% for AGIs $50k-75k, 18.4% for AGIs $75k-100k, 15.2% for AGIs over 100k)
Charity contributions deductions: $1,813 (2% of AGI, reported on 45.1% of returns)
Here:
$1,813
State:
$3,295
Here:
2.0% of AGI
State:
2.7% of AGI
(% of AGI for various income ranges: 0.9% for AGIs below $10k, 0.7% for AGIs $10k-25k, 1.2% for AGIs $25k-50k, 1.4% for AGIs $50k-75k, 1.7% for AGIs $75k-100k, 1.5% for AGIs over 100k)
Total tax: $8,100 (reported on 83.3% of returns)
01473:
$8,100
State:
$11,494
(% of AGI for various income ranges: 3.6% for AGIs below $10k, 5.5% for AGIs $10k-25k, 8.2% for AGIs $25k-50k, 8.7% for AGIs $50k-75k, 9.9% for AGIs $75k-100k, 16.6% for AGIs over 100k)
Earned income credit: $1,325 (reported on 5.8% of returns)
Here:
$1,325
State:
$1,518
Percentage of individuals using paid preparers for their 2004 taxes: 57.0%
Here:
57%
State:
58%
(% for various income ranges: 40.1% for AGIs below $10k, 53.8% for AGIs $10k-25k, 58.9% for AGIs $25k-50k, 61.6% for AGIs $50k-75k, 64.5% for AGIs $75k-100k, 65.8% for AGIs over 100k)
Household received Food Stamps/SNAP in the past 12 months: 199 Household did not receive Food Stamps/SNAP in the past 12 months: 3,057
Women who had a birth in the past 12 months: 55 (37 now married, 16 unmarried) Women who did not have a birth in the past 12 months: 1,350 (601 now married, 742 unmarried)
Housing units in zip code 01473 with a mortgage: 1,773 (272 second mortgage, 276 both second mortgage and home equity loan) Houses without a mortgage: 40
Median monthly owner costs for units with a mortgage: $2,071 Median monthly owner costs for units without a mortgage: $913
Residents with income below the poverty level in 2022:
This zip code:
3.6%
Whole state:
10.4%
Residents with income below 50% of the poverty level in 2022:
This zip code:
1.6%
Whole state:
5.1%
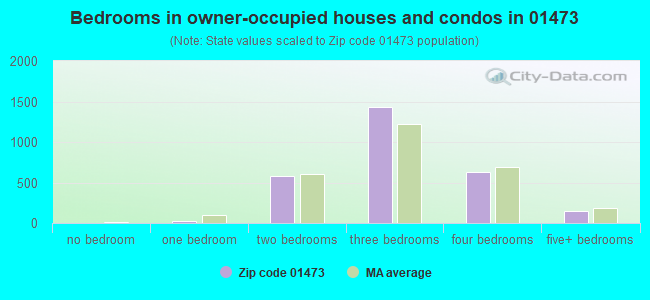
Median number of rooms in houses and condos:
Here:
6.9
State:
6.5
Median number of rooms in apartments:
Here:
4.6
State:
4.0
Notable locations in this zip code not listed on our city pages
Notable locations in zip code 01473: Central Wharf (A), Westminster Country Club (B), Hatches Wharf (C), Hawkes House (D), Derby House (E), Custom House (F), Narbonne-Hale House (G), Central Wharf Warehouse Visitor Center (H), Westminster Fire Department Station 1 Headquarters (I), Westminster Town Hall (J), Westminster Historical Society Library (K), Westminster Historical Society Building (L), Forbush Memorial Library (M). Display/hide their locations on the map
Churches in zip code 01473 include: Saint Edward the Confessor Church (A), Our Saviours Lutheran Church (B), First Congregational Church (C). Display/hide their locations on the map
Parks in zip code 01473 include: Crow Hill State Reservation (1), Westminster Village-Academy Hill Historic District (2), Westminster State Forest (3), Haeger Park (4), Forrester (5). Display/hide their locations on the map
In group quarters: 5 (-1 institutionalized population)
Size of family households: 1,193 2-persons, 663 3-persons, 330 4-persons, 100 5-persons, 44 6-persons, 71 7-or-more-persons
Size of nonfamily households: 634 1-person, 218 2-persons, 54 4-persons
1,105 married couples with children.
165 single-parent households (20 men, 145 women).
96.4% of residents of 01473 zip code speak English at home.
1.6% of residents speak Spanish at home (59% very well, 41% well).
1.6% of residents speak other Indo-European language at home (100% very well).
0.4% of residents speak other language at home (43% very well, 57% not well).
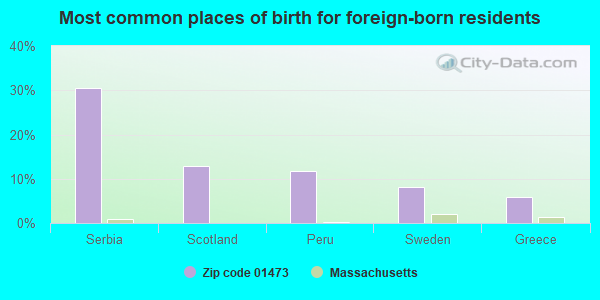
Foreign born population: 171 (2.1%) (63.9% of them are naturalized citizens)
This zip code:
2.1%
Whole state:
18.0%
30%Serbia
13%Scotland
12%Peru
8%Sweden
6%Greece
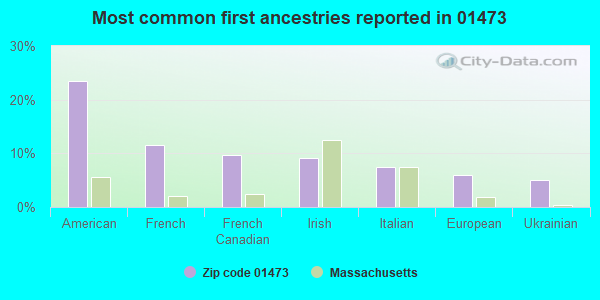
23%American
12%French
10%French Canadian
9%Irish
7%Italian
6%European
5%Ukrainian
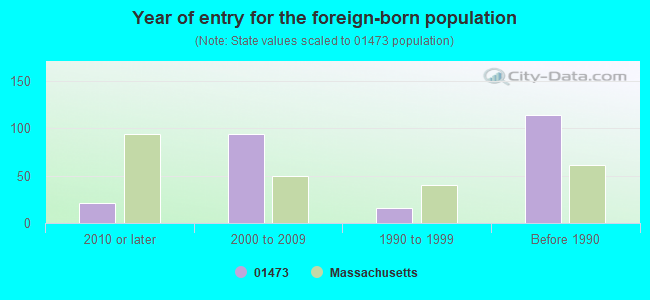
Year of entry for the foreign-born population
212010 or later
942000 to 2009
161990 to 1999
114Before 1990
Facilities with environmental interests located in this zip code:
ADVANCE COATINGS CO (42 DEPOT ROAD in WESTMINSTER, MA)
AIR MINOR (AIRS/AFS) (Integrated Compliance Information System) - ICIS-01-1995-0033, FORMAL ENFORCEMENT ACTION COMPLIANCE ACTIVITY (Tracking inspections of insecticide, fungicide, and rodenticide, and toxic substances) CRITERIA AND HAZARDOUS AIR POLLUTANT INVENTORY (Inventory of air pollution sources) HAZARDOUS WASTE BIENNIAL REPORTER (Resource Conservation and Recovery Act (tracking hazardous waste)) Large Quantity Generators, more that 1000 kg of hazardous waste/month (Resource Conservation and Recovery Act (tracking hazardous waste)) - notification TRI REPORTER (Tracking of toxic chemicals releasing facilities) Business SIC classification: PLASTICS MATERIALS, SYNTHETIC RESINS, AND NONVULCANIZABLE ELASTOMERS; PAINTS, VARNISHES, LACQUERS, ENAMELS, AND ALLIED PRODUCTS; INDUSTRIAL ORGANIC CHEMICALS Business NAICS classification: PLASTICS MATERIAL AND RESIN MANUFACTURING.; PLASTICS MATERIAL AND RESIN MANUFACTURING. Alternative names: ADVANCE COATINGS COM
MEETINGHOUSE SCHOOL (8 SOUTH STREET in WESTMINSTER, MA)
(National Center for Education Statistics) - STATE ID-610010 Organizations: ASHBURNHAM-WESTMINSTER (SCHOOL DISTRICT)
OIL EXPRESS (23 VLG INN RD in WESTMINSTER, MA)
(Resource Conservation and Recovery Act (tracking hazardous waste)) Business NAICS classification: HEATING OIL DEALERS. Organizations: HEATING OIL PARTNERS L P (CONTACT/OWNER)
, LEE PELETIER (CONTACT/OWNER)
DOUGS AUTO BODY & GLASS (129 KNOWER RD in WESTMINSTER, MA)
(Resource Conservation and Recovery Act (tracking hazardous waste)) Organizations: DOUGLAS B YOUNG (CONTACT/OWNER)
Housing units lacking complete plumbing facilities: 0.5% Housing units lacking complete kitchen facilities: 0.5%
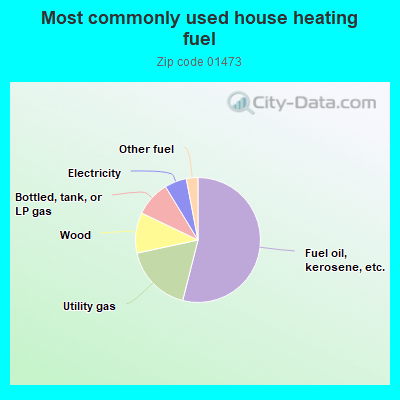
54.0%Fuel oil, kerosene, etc.
17.7%Utility gas
10.5%Wood
9.2%Bottled, tank, or LP gas
5.7%Electricity
3.0%Other fuel
Population in 1990: 6,191. Population change in the 1990s: +713 (+11.5%).
Place of birth for U.S.-born residents:
This state: 6,598
Northeast: 809
Midwest: 166
South: 223
West: 96
72% of the 01473 zip code residents lived in the same house 5 years ago. Out of people who lived in different houses, 74% lived in this county. Out of people who lived in different counties, 50% lived in Massachusetts.
96% of the 01473 zip code residents lived in the same house 1 year ago. Out of people who lived in different houses, 71% moved from this county. Out of people who lived in different houses, 26% moved from different county within same state.
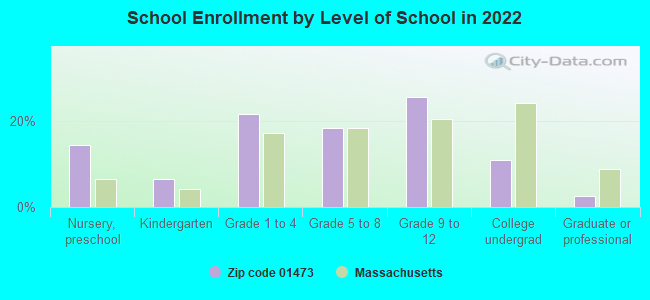
Private vs. public school enrollment:
Students in private schools in grades 1 to 8 (elementary and middle school): 19
Here:
3.0%
Massachusetts:
10.3%
Students in private schools in grades 9 to 12 (high school): 49
Here:
12.0%
Massachusetts:
12.3%
Students in private undergraduate colleges:
Here:
0.0%
Massachusetts:
51.2%
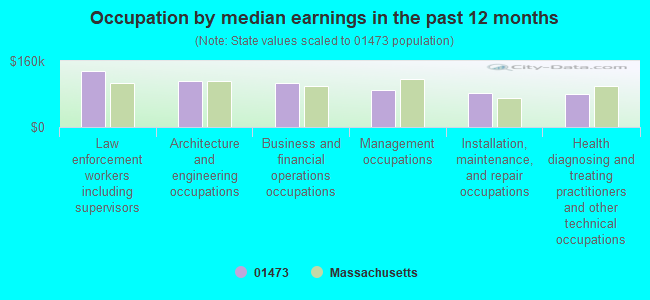
Occupation by median earnings in the past 12 months ($)
135,398Law enforcement workers including supervisors
112,323Architecture and engineering occupations
105,844Business and financial operations occupations
89,605Management occupations
81,674Installation, maintenance, and repair occupations
80,754Health diagnosing and treating practitioners and other technical occupations
Companies with federal contracts located in this zip code:
RANOR, INC. (BELLA DRIVE. in WESTMINSTER, MA; small business)
$99,536 with Navy for Wire, Nonelectrical. Signed on 2000-06-02. Completion date: 2000-09-15.
ADVANCE COATINGS CO (42 DEPOT RD in WESTMINSTER, MA; small business)
$756 with Navy for Adhesives. Signed on 2005-06-28. Completion date: 2005-07-07.
Top industries in this zip code by the number of employees in 2005:
Accommodation and Food Services: Hotels (except Casino Hotels) and Motels (100-249 employees: 1 establishment, 1-4 employees: 1 establishment)
Accommodation and Food Services: Full-Service Restaurants (20-49: 3)
Administrative and Support and Waste Management and Remediation Services: Professional Employer Organizations (50-99: 1)
Management of Companies and Enterprises: Corporate, Subsidiary, and Regional Managing Offices (20-49: 2)
Other Services (except Public Administration): Religious Organizations (10-19: 1, 5-9: 3, 1-4: 2)
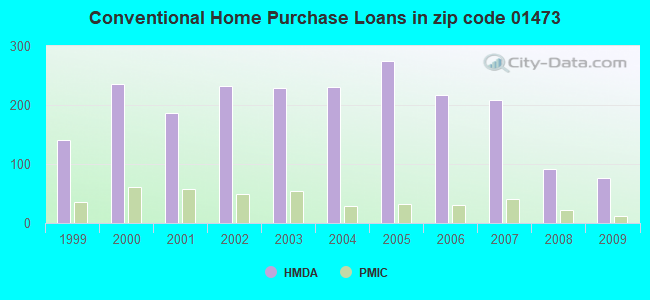
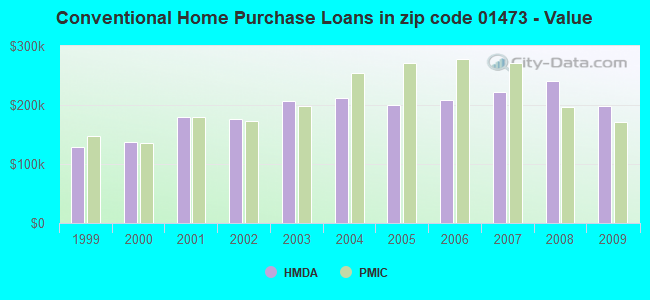
Detailed PMIC statistics for the following Tracts:7081.00
2002 - 2018 National Fire Incident Reporting System (NFIRS) incidents
Based on the data from the years 2002 - 2018 the average number of fires per year is 33. The highest number of reported fires - 63 took place in 2007, and the least - 11 in 2005. The data has a rising trend.
When looking into fire subcategories, the most reports belonged to: Structure Fires (43.6%), and Outside Fires (32.1%).
Fire incident types reported to NFIRS in Zip Code 01473


 Nearest zip codes: 01440, 01420, 01430, 01541, 01452, 01438.


 Based on the data from the years 2002 - 2018 the average number of fires per year is 33. The highest number of reported fires - 63 took place in 2007, and the least - 11 in 2005. The data has a rising trend.
 When looking into fire subcategories, the most reports belonged to: Structure Fires (43.6%), and Outside Fires (32.1%).