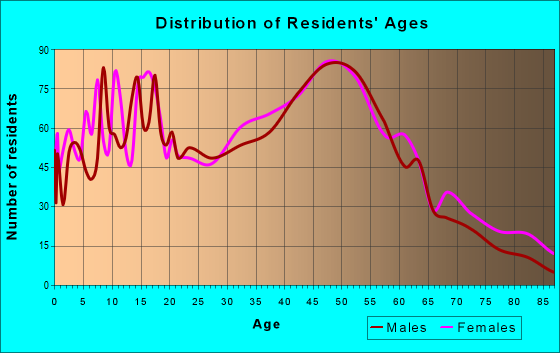
Estimated zip code population in 2022: 9,192 Zip code population in 2010: 9,026 Zip code population in 2000: 8,804
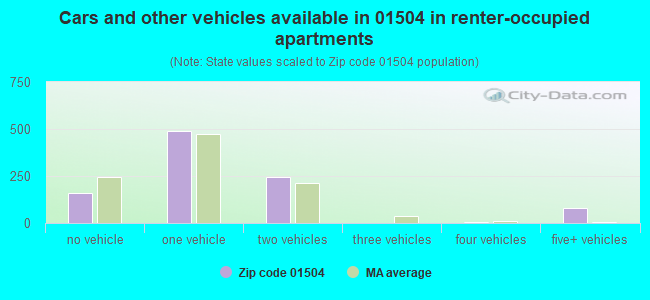
Houses and condos: 4,079 Renter-occupied apartments: 973
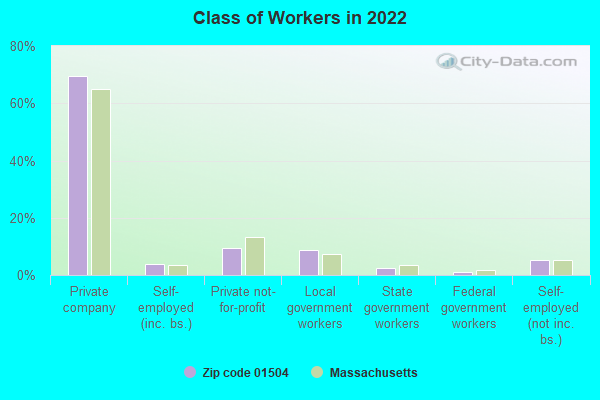
% of renters here:
25%
State:
38%
March 2022 cost of living index in zip code 01504: 125.3 (high, U.S. average is 100)
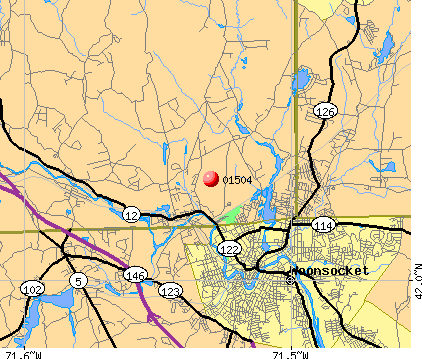
Land area: 11.1 sq. mi. Water area: 0.3 sq. mi.
Population density: 830 people per square mile
(low).
OSM Map
Google Map
MSN Map
OSM Map
General Map
Google Map
MSN Map
OSM Map
Google Map
MSN Map
OSM Map
Google Map
MSN Map
Please wait while loading the map...
Real estate property taxes paid for housing units in 2022:
This zip code:
1.3% ($5,116)
Massachusetts:
1.0% ($5,536)
Median real estate property taxes paid for housing units with mortgages in 2022: $5,365 (1.2%) Median real estate property taxes paid for housing units with no mortgage in 2022: $4,538 (1.7%)
Averages for the 2020 tax year for zip code 01504, filed in 2021:
Average Adjusted Gross Income (AGI) in 2020: $72,884 (Individual Income Tax Returns)
Here:
$72,884
State:
$105,130
Salary/wage: $65,388 (reported on 86.2% of returns)
Here:
$65,388
State:
$82,951
(% of AGI for various income ranges: 1152.9% for AGIs below $25k, 3584.1% for AGIs $25k-50k, 6720.5% for AGIs $50k-75k, 9396.2% for AGIs $75k-100k, 18547.5% for AGIs $100k-200k, 60360.0% for AGIs over 200k)
Taxable interest for individuals: $633 (reported on 33.8% of returns)
This zip code:
$633
Massachusetts:
$2,361
(% of AGI for various income ranges: 15.8% for AGIs below $25k, 13.1% for AGIs $25k-50k, 29.2% for AGIs $50k-75k, 26.2% for AGIs $75k-100k, 53.3% for AGIs $100k-200k, 272.5% for AGIs over 200k)
Ordinary dividends: $2,028 (reported on 15.8% of returns)
Here:
$2,028
State:
$10,365
(% of AGI for various income ranges: 12.4% for AGIs below $25k, 16.7% for AGIs $25k-50k, 31.9% for AGIs $50k-75k, 49.8% for AGIs $75k-100k, 98.2% for AGIs $100k-200k, 448.8% for AGIs over 200k)
Net capital gain/loss in AGI: +$6,617 (reported on 14.0% of returns)
Here:
+$6,617
State:
+$48,178
(% of AGI for various income ranges: 11.3% for AGIs below $25k, 18.0% for AGIs $25k-50k, 29.7% for AGIs $50k-75k, 113.2% for AGIs $75k-100k, 260.3% for AGIs $100k-200k, 2695.0% for AGIs over 200k)
Profit/loss from business: +$15,497 (reported on 12.0% of returns)
Here:
+$15,497
State:
+$20,792
(% of AGI for various income ranges: 89.5% for AGIs below $25k, 56.2% for AGIs $25k-50k, 186.6% for AGIs $50k-75k, 286.5% for AGIs $75k-100k, 621.5% for AGIs $100k-200k, 2523.8% for AGIs over 200k)
Taxable individual retirement arrangement distribution: $16,756 (reported on 7.8% of returns)
01504:
$16,756
Massachusetts:
$22,790
(% of AGI for various income ranges: 83.0% for AGIs below $25k, 108.1% for AGIs $25k-50k, 128.5% for AGIs $50k-75k, 185.0% for AGIs $75k-100k, 549.8% for AGIs $100k-200k)
Total itemized deductions: $24,985 (reported on 9.4% of returns)
Here:
$24,985
State:
$36,722
(% of AGI for various income ranges: 64.1% for AGIs below $25k, 111.8% for AGIs $25k-50k, 353.1% for AGIs $50k-75k, 437.0% for AGIs $75k-100k, 716.2% for AGIs $100k-200k, 2468.8% for AGIs over 200k)
Charity contributions: $3,354 (reported on 7.0% of returns)
Here:
$3,354
State:
$12,529
(% of AGI for various income ranges: 8.2% for AGIs $25k-50k, 18.6% for AGIs $50k-75k, 43.2% for AGIs $75k-100k, 95.6% for AGIs $100k-200k, 287.5% for AGIs over 200k)
Taxes paid: $8,787 (reported on 9.4% of returns)
01504:
$8,787
State:
$8,782
(% of AGI for various income ranges: 14.4% for AGIs below $25k, 41.8% for AGIs $25k-50k, 122.7% for AGIs $50k-75k, 197.0% for AGIs $75k-100k, 258.4% for AGIs $100k-200k, 663.8% for AGIs over 200k)
Earned income credit: $1,702 (reported on 8.8% of returns)
Here:
$1,702
State:
$1,909
(% of AGI for various income ranges: 46.5% for AGIs below $25k, 40.2% for AGIs $25k-50k)
Percentage of individuals using paid preparers for their 2020 taxes: 93.8%
Here:
94%
State:
92%
(% for various income ranges: 91.8% for AGIs below $25k, 94.1% for AGIs $25k-50k, 95.1% for AGIs $50k-75k, 92.9% for AGIs $75k-100k, 95.0% for AGIs $100k-200k, 95.5% for AGIs over 200k)
Averages for the 2012 tax year for zip code 01504, filed in 2013:
Average Adjusted Gross Income (AGI) in 2012: $55,262 (Individual Income Tax Returns)
Here:
$55,262
State:
$81,425
Salary/wage: $51,395 (reported on 89.0% of returns)
Here:
$51,395
State:
$64,752
(% of AGI for various income ranges: 75.0% for AGIs below $25k, 82.5% for AGIs $25k-50k, 82.8% for AGIs $50k-75k, 84.4% for AGIs $75k-100k, 85.7% for AGIs $100k-200k, 74.3% for AGIs over 200k)
Taxable interest for individuals: $558 (reported on 39.6% of returns)
This zip code:
$558
Massachusetts:
$2,136
(% of AGI for various income ranges: 0.8% for AGIs below $25k, 0.4% for AGIs $25k-50k, 0.4% for AGIs $50k-75k, 0.2% for AGIs $75k-100k, 0.3% for AGIs $100k-200k, 0.7% for AGIs over 200k)
Ordinary dividends: $1,654 (reported on 15.8% of returns)
Here:
$1,654
State:
$9,473
(% of AGI for various income ranges: 0.9% for AGIs below $25k, 0.4% for AGIs $25k-50k, 0.4% for AGIs $50k-75k, 0.4% for AGIs $75k-100k, 0.4% for AGIs $100k-200k, 0.9% for AGIs over 200k)
Net capital gain/loss in AGI: +$1,796 (reported on 11.9% of returns)
Here:
+$1,796
State:
+$31,437
(% of AGI for various income ranges: 0.9% for AGIs $100k-200k, 1.7% for AGIs over 200k)
Profit/loss from business: +$12,971 (reported on 11.2% of returns)
Here:
+$12,971
State:
+$20,662
(% of AGI for various income ranges: 6.8% for AGIs below $25k, 2.8% for AGIs $25k-50k, 1.6% for AGIs $50k-75k, 1.8% for AGIs $75k-100k, 3.1% for AGIs $100k-200k)
Taxable individual retirement arrangement distribution: $11,520 (reported on 9.0% of returns)
01504:
$11,520
Massachusetts:
$18,892
(% of AGI for various income ranges: 3.6% for AGIs below $25k, 1.8% for AGIs $25k-50k, 2.0% for AGIs $50k-75k, 1.7% for AGIs $75k-100k, 2.0% for AGIs $100k-200k)
Total itemized deductions: $20,042 (21% of AGI, reported on 38.7% of returns)
Here:
$20,042
State:
$28,907
Here:
21.3% of AGI
State:
18.2% of AGI
(% of AGI for various income ranges: 8.0% for AGIs below $25k, 9.9% for AGIs $25k-50k, 14.2% for AGIs $50k-75k, 16.7% for AGIs $75k-100k, 16.3% for AGIs $100k-200k, 11.2% for AGIs over 200k)
Charity contributions: $1,435 (reported on 31.6% of returns)
Here:
$1,435
State:
$4,208
(% of AGI for various income ranges: 0.3% for AGIs below $25k, 0.5% for AGIs $25k-50k, 0.8% for AGIs $50k-75k, 0.9% for AGIs $75k-100k, 1.0% for AGIs $100k-200k, 0.9% for AGIs over 200k)
Taxes paid: $9,083 (reported on 38.7% of returns)
01504:
$9,083
State:
$13,303
(% of AGI for various income ranges: 2.6% for AGIs below $25k, 3.6% for AGIs $25k-50k, 5.7% for AGIs $50k-75k, 7.2% for AGIs $75k-100k, 8.0% for AGIs $100k-200k, 7.5% for AGIs over 200k)
Earned income credit: $1,804 (reported on 11.0% of returns)
Here:
$1,804
State:
$1,971
(% of AGI for various income ranges: 3.6% for AGIs below $25k, 0.6% for AGIs $25k-50k)
Percentage of individuals using paid preparers for their 2012 taxes: 57.8%
Here:
58%
State:
56%
(% for various income ranges: 50.0% for AGIs below $25k, 58.3% for AGIs $25k-50k, 62.0% for AGIs $50k-75k, 63.3% for AGIs $75k-100k, 65.7% for AGIs $100k-200k, 71.4% for AGIs over 200k)
Averages for the 2004 tax year for zip code 01504, filed in 2005:
Average Adjusted Gross Income (AGI) in 2004: $47,106 (Individual Income Tax Returns)
Here:
$47,106
State:
$62,877
Salary/wage: $45,032 (reported on 89.8% of returns)
Here:
$45,032
State:
$52,969
(% of AGI for various income ranges: 90.1% for AGIs below $10k, 76.4% for AGIs $10k-25k, 86.2% for AGIs $25k-50k, 88.2% for AGIs $50k-75k, 90.8% for AGIs $75k-100k, 82.4% for AGIs over 100k)
Taxable interest for individuals: $589 (reported on 53.1% of returns)
This zip code:
$589
Massachusetts:
$1,945
(% of AGI for various income ranges: 3.3% for AGIs below $10k, 1.8% for AGIs $10k-25k, 0.7% for AGIs $25k-50k, 0.7% for AGIs $50k-75k, 0.4% for AGIs $75k-100k, 0.5% for AGIs over 100k)
Taxable dividends: $837 (reported on 20.9% of returns)
Here:
$837
State:
$5,323
(% of AGI for various income ranges: 1.1% for AGIs below $10k, 0.8% for AGIs $10k-25k, 0.3% for AGIs $25k-50k, 0.2% for AGIs $50k-75k, 0.4% for AGIs $75k-100k, 0.4% for AGIs over 100k)
Net capital gain/loss: +$5,994 (reported on 15.9% of returns)
Here:
+$5,994
State:
+$20,377
(% of AGI for various income ranges: -1.7% for AGIs below $10k, -0.2% for AGIs $10k-25k, 0.5% for AGIs $25k-50k, -0.0% for AGIs $50k-75k, 0.8% for AGIs $75k-100k, 6.3% for AGIs over 100k)
Profit/loss from business: +$12,068 (reported on 12.4% of returns)
Here:
+$12,068
State:
+$17,837
(% of AGI for various income ranges: 9.5% for AGIs below $10k, 6.4% for AGIs $10k-25k, 3.2% for AGIs $25k-50k, 3.6% for AGIs $50k-75k, 1.8% for AGIs $75k-100k, 2.6% for AGIs over 100k)
IRA payment deduction: $3,027 (reported on 2.6% of returns)
01504:
$3,027
Massachusetts:
$3,100
(% of AGI for various income ranges: 0.3% for AGIs $25k-50k, 0.2% for AGIs $50k-75k, 0.1% for AGIs $75k-100k, 0.1% for AGIs over 100k)
Self-employed pension: $3,562 (reported on 0.4% of returns)
Here:
$3,562
Massachusetts:
$14,516
Total itemized deductions: $17,521 (23% of AGI, reported on 41.8% of returns)
Here:
$17,521
State:
$22,573
Here:
22.9% of AGI
State:
19.5% of AGI
(% of AGI for various income ranges: 9.8% for AGIs below $10k, 8.5% for AGIs $10k-25k, 13.0% for AGIs $25k-50k, 17.4% for AGIs $50k-75k, 19.0% for AGIs $75k-100k, 15.6% for AGIs over 100k)
Charity contributions deductions: $1,470 (2% of AGI, reported on 38.0% of returns)
Here:
$1,470
State:
$3,295
Here:
1.9% of AGI
State:
2.7% of AGI
(% of AGI for various income ranges: 0.4% for AGIs below $10k, 0.6% for AGIs $10k-25k, 0.9% for AGIs $25k-50k, 1.2% for AGIs $50k-75k, 1.4% for AGIs $75k-100k, 1.4% for AGIs over 100k)
Total tax: $5,764 (reported on 81.8% of returns)
01504:
$5,764
State:
$11,494
(% of AGI for various income ranges: 2.8% for AGIs below $10k, 5.1% for AGIs $10k-25k, 7.9% for AGIs $25k-50k, 8.6% for AGIs $50k-75k, 9.5% for AGIs $75k-100k, 14.7% for AGIs over 100k)
Earned income credit: $1,408 (reported on 8.8% of returns)
Here:
$1,408
State:
$1,518
Percentage of individuals using paid preparers for their 2004 taxes: 61.6%
Here:
62%
State:
58%
(% for various income ranges: 48.9% for AGIs below $10k, 62.4% for AGIs $10k-25k, 63.2% for AGIs $25k-50k, 65.5% for AGIs $50k-75k, 64.1% for AGIs $75k-100k, 69.0% for AGIs over 100k)
Likely homosexual households (counted as self-reported same-sex unmarried-partner households)
Lesbian couples: 0.1% of all households
Gay men: 0.0% of all households
Household received Food Stamps/SNAP in the past 12 months: 346 Household did not receive Food Stamps/SNAP in the past 12 months: 3,558
Women who had a birth in the past 12 months: 161 (169 now married, 0 unmarried) Women who did not have a birth in the past 12 months: 1,936 (833 now married, 1,095 unmarried)
Housing units in zip code 01504 with a mortgage: 1,949 (288 second mortgage, 231 both second mortgage and home equity loan) Houses without a mortgage: 121
Median monthly owner costs for units with a mortgage: $2,278 Median monthly owner costs for units without a mortgage: $840
Residents with income below the poverty level in 2022:
This zip code:
5.2%
Whole state:
10.4%
Residents with income below 50% of the poverty level in 2022:
This zip code:
1.2%
Whole state:
5.1%
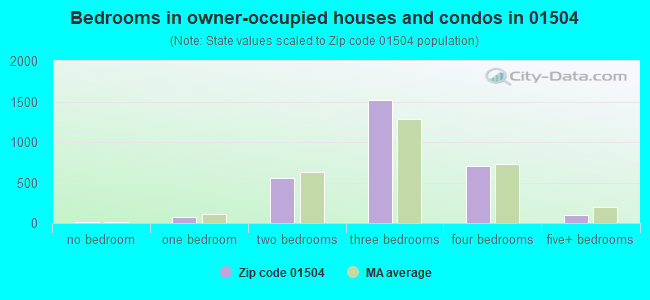
Median number of rooms in houses and condos:
Here:
6.2
State:
6.5
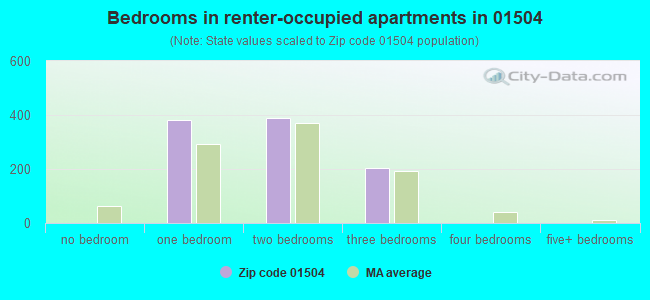
Median number of rooms in apartments:
Here:
4.1
State:
4.0
Notable locations in this zip code not listed on our city pages
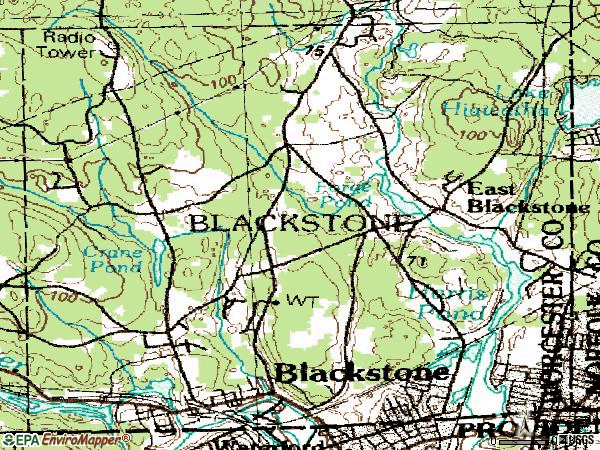
Notable locations in zip code 01504: Wojcik Farm (A), Blackstone Fire Department Station 2 (B), Blackstone Fire Department Station 1 Headquarters (C), Millville Town Hall (D), Blackstone Town Hall (E). Display/hide their locations on the map
Cemeteries: Blackstone Cemetery (1), Saint Charles Cemetery (2), Saint Stanislaus Cemetery (3), Precious Blood Cemetery (4), Saint Micheals Cemetery (5). Display/hide their locations on the map
Lakes and reservoirs: Reilly Pond (A), Walsh Pond (B), Crane Pond (C), Duck Pond (D), Fish Pond (E), Briggs Pond (F), Forge Pond (G), Blackstone River Reservoir (H). Display/hide their locations on the map
In group quarters: 54 (-1 institutionalized population)
Size of family households: 963 2-persons, 624 3-persons, 631 4-persons, 201 5-persons
Size of nonfamily households: 1,361 1-person, 151 2-persons, 9 3-persons
1,530 married couples with children.
405 single-parent households (107 men, 298 women).
86.1% of residents of 01504 zip code speak English at home.
4.0% of residents speak Spanish at home (76% very well, 24% well).
5.9% of residents speak other Indo-European language at home (84% very well, 13% well, 3% not well).
1.8% of residents speak Asian or Pacific Island language at home (78% very well, 10% well, 12% not well).
1.7% of residents speak other language at home (55% very well, 45% well).
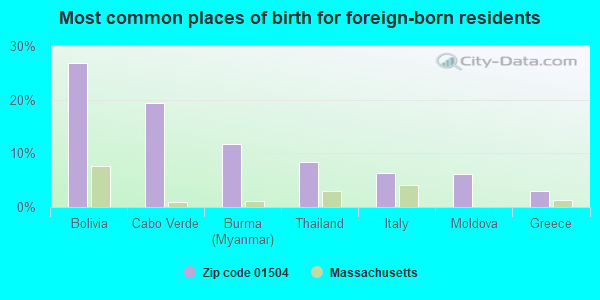
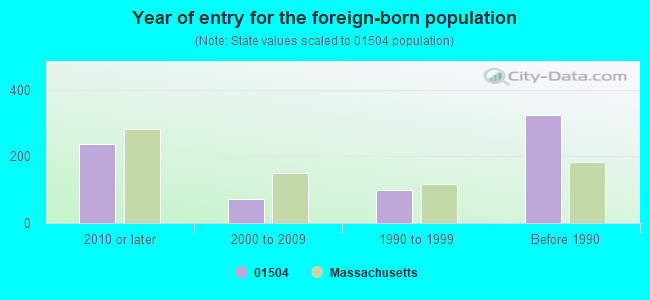
Foreign born population: 547 (6.0%) (58.8% of them are naturalized citizens)
This zip code:
6.0%
Whole state:
18.0%
27%Bolivia
19%Cabo Verde
12%Burma (Myanmar)
8%Thailand
6%Italy
6%Moldova
3%Greece
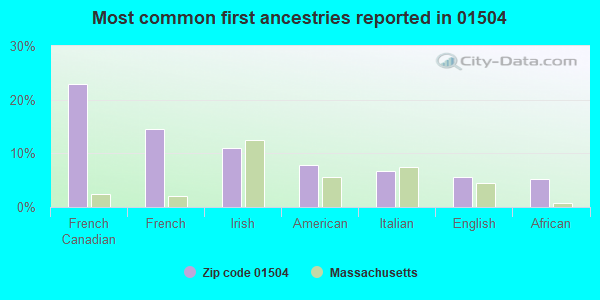
23%French Canadian
14%French
11%Irish
8%American
7%Italian
6%English
5%African
Year of entry for the foreign-born population
2372010 or later
732000 to 2009
981990 to 1999
324Before 1990
Major facilities with environmental interests located in this zip code:
KIMBALL SAND COMPANY (202 ELM ST in BLACKSTONE, MA)
AIR MINOR (AIRS/AFS) STATE MASTER (MA-EPICS) - NEI-1180181, AIR PROGRAM, RCRAINFO-MV5088831798, HAZARDOUS WASTE PROGRAM CRITERIA AND HAZARDOUS AIR POLLUTANT INVENTORY (Inventory of air pollution sources) National Pollutant Discharge Elimination System NON-MAJOR (Tracking pollutant discharge elimination systems) - permit Business SIC classification: CRUSHED AND BROKEN STONE Organizations: KIMBALL SAND CO INC (CONTACT/OWNER)
Alternative names: KIMBALL SAND AND GRAVEL
AT&T BLACKSTONE (295 MENDON ST in BLACKSTONE, MA)
AIR SYNTHETIC MINOR (AIRS/AFS) STATE MASTER (MA-EPICS) - NEI-1180189, AIR PROGRAM, RCRAINFO-MAD980524698, HAZARDOUS WASTE PROGRAM CRITERIA AND HAZARDOUS AIR POLLUTANT INVENTORY (Inventory of air pollution sources) Conditionally Exempt Small Quantity Generators, less than 100 kg/month of hazardous waste (Resource Conservation and Recovery Act (tracking hazardous waste)) - notification Business SIC classification: TELEPHONE COMMUNICATIONS, EXCEPT RADIOTELEPHONE Organizations: AT & T (CONTACT/OPERATOR)
, AT&T LONG LINES DEPARTMENT (CONTACT/OWNER)
Alternative names: BLACKSTONE 2 MASS REPEATER STA AT&T
A F MALONEY (200 LINCOLN STREET in BLACKSTONE, MA)
(National Center for Education Statistics) - STATE ID-622015 Organizations: BLACKSTONE-MILLVILLE (SCHOOL DISTRICT)
ANP BLACKSTONE ENERGY PROJECT (204 ELM ST in BLACKSTONE, MA)
AIR MAJOR (AIRS/AFS) AIR PROGRAM (Clean Air Markets Division Business System) CRITERIA AND HAZARDOUS AIR POLLUTANT INVENTORY (Inventory of air pollution sources) AIR MAJOR ("Best Available" air pollution technologies tracking) Business SIC classification: ELECTRIC SERVICES Organizations: ANP OPERATIONS COMPANY (CONTACT/OPERATOR)
, ANP BLACKSTONE ENERGY COMPANY, LLC (CONTACT/OPERATOR)
Alternative names: ALSTOM POWER, AMERICAN NATIONAL PO, AMERICAN NATIONAL POWER BLACKSTONE, ANP BLACKSTONE ENERGY COMPANY, ANP BLACKSTONE ENERGY COMPANY, ANP BLACKSTONE ENERGY COMPANY LLC
BLACKSTONE MILLVILLE RHS (175 LINCOLN STREET in BLACKSTONE, MA)
(National Center for Education Statistics) - STATE ID-622505 Organizations: BLACKSTONE-MILLVILLE (SCHOOL DISTRICT)
BLACKSTONE MILLVILLE RMS (35 FEDERAL STREET in BLACKSTONE, MA)
(National Center for Education Statistics) - STATE ID-622405 Organizations: BLACKSTONE-MILLVILLE (SCHOOL DISTRICT)
JOHN F KENNEDY ELEM (200 LINCOLN STREET in BLACKSTONE, MA)
(National Center for Education Statistics) - STATE ID-622008 Organizations: BLACKSTONE-MILLVILLE (SCHOOL DISTRICT)
AL PRIME ENERGY SERVICE STATION (228 MAIN ST in BLACKSTONE, MA)
AIR MINOR (AIRS/AFS) Business SIC classification: GASOLINE SERVICE STATIONS Alternative names: AL PRIME ENERGY CONSULTANTS INC, BLACKSTONE PRIME SVC
ALS GARAGE (189 ELM ST in BLACKSTONE, MA)
(Resource Conservation and Recovery Act (tracking hazardous waste))
BIRCHWOOD MEADOWS (LINCOLN STREET in BLACKSTONE, MA)
National Pollutant Discharge Elimination System NON-MAJOR (Tracking pollutant discharge elimination systems) - permit Business SIC classification: HEAVY CONSTRUCTION
BLACKSTONE (BLACKSTONE in BLACKSTONE, MA)
AIR MINOR (AIRS/AFS) Business SIC classification: GENERAL GOVERNMENT
BLACKSTONE AUTOMOTIVE (700 RATHBUN ST in BLACKSTONE, MA)
Conditionally Exempt Small Quantity Generators, less than 100 kg/month of hazardous waste (Resource Conservation and Recovery Act (tracking hazardous waste)) - notification Organizations: HENRY HARPIN (CONTACT/OWNER)
BLACKSTONE MOTORS AUTO BODY (7 VALLEY ST in BLACKSTONE, MA)
Conditionally Exempt Small Quantity Generators, less than 100 kg/month of hazardous waste (Resource Conservation and Recovery Act (tracking hazardous waste)) - notification Organizations: ROBERT PELOQUIN (CONTACT/OWNER)
Alternative names: BLACKSTONE AUTO BODY, BOBS AUTO BODY
Housing units lacking complete plumbing facilities: 0.2%
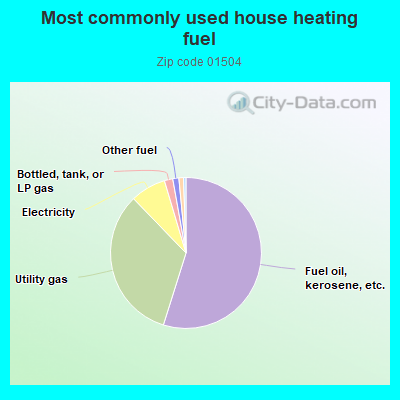
54.8%Fuel oil, kerosene, etc.
32.9%Utility gas
7.6%Electricity
1.8%Bottled, tank, or LP gas
1.3%Other fuel
1.0%Wood
0.5%Solar energy
Population in 1990: 8,023. Population change in the 1990s: +781 (+9.7%).
Place of birth for U.S.-born residents:
This state: 4,853
Northeast: 3,176
Midwest: 142
South: 116
West: 135
70% of the 01504 zip code residents lived in the same house 5 years ago. Out of people who lived in different houses, 45% lived in this county. Out of people who lived in different counties, 50% lived in Massachusetts.
92% of the 01504 zip code residents lived in the same house 1 year ago. Out of people who lived in different houses, 30% moved from this county. Out of people who lived in different houses, 52% moved from different county within same state. Out of people who lived in different houses, 16% moved from different state. Out of people who lived in different houses, 4% moved from abroad.
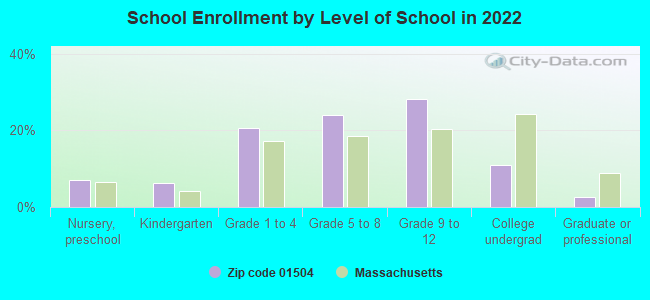
Private vs. public school enrollment:
Students in private schools in grades 1 to 8 (elementary and middle school): 98
Here:
11.6%
Massachusetts:
10.3%
Students in private schools in grades 9 to 12 (high school): 10
Here:
1.9%
Massachusetts:
12.3%
Students in private undergraduate colleges: 99
Here:
46.7%
Massachusetts:
51.2%
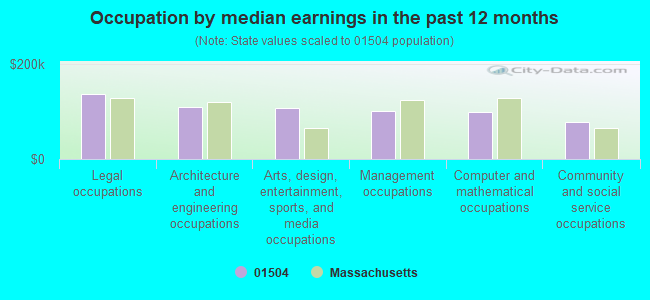
Occupation by median earnings in the past 12 months ($)
137,279Legal occupations
108,299Architecture and engineering occupations
106,136Arts, design, entertainment, sports, and media occupations
101,081Management occupations
99,525Computer and mathematical occupations
76,915Community and social service occupations
Companies with federal contracts located in this zip code:
SECURITEK SYSTEMS INC (114 KING STREET in BLACKSTONE, MA; small business) : $6,174 in 3 contractsfrom 2002 to 2004
$5,230 with U.S. Army Corps of Engineers - civil program financing only for Communications Security Equipment and Components. Signed on 2002-05-24. Completion date: 2002-06-25.
$472 with Army for Maintenance, Repair or Alteration of Real Property -- Office Buildings. Signed on 2004-02-27. Completion date: 2004-03-01.
$472 with U.S. Army Corps of Engineers - civil program financing only for Maintenance, Repair or Alteration of Real Property -- Office Buildings. Signed on 2004-02-27. Completion date: 2004-03-01.
STONKUS HYDRAULIC, INC. (166 LAKESHORE DRIVE in BLACKSTONE, MA; small business) : $3,496 in 2 contractsin 2005
$1,825 with Bureau of Prisoners/Federal Prison System for Quality Control Services -- Water Purification and Sewage Treatment Equipment. Taking place in NY. Signed on 2005-05-23. Completion date: 2005-06-23.
$1,671, same as above.Signed on 2005-09-29. Completion date: 2005-09-30.
Top industries in this zip code by the number of employees in 2005:
Health Care and Social Assistance: Offices of Dentists (20-49 employees: 1 establishment)
Utilities: Fossil Fuel Electric Power Generation (20-49: 1)
Health Care and Social Assistance: Nursing Care Facilities (20-49: 1)
Mining: Construction Sand and Gravel Mining (20-49: 1)
Other Services (except Public Administration): Civic and Social Organizations (10-19: 2)
People in group quarters in 2010:
27 people in nursing facilities/skilled-nursing facilities
18 people in workers' group living quarters and job corps centers
People in group quarters in 2000:
25 people in nursing homes
7 people in other noninstitutional group quarters
Home Mortgage Disclosure Act Aggregated Statistics For Year 2009 (Based on 2 full and 2 partial tracts)
A) FHA, FSA/RHS & VA Home Purchase Loans
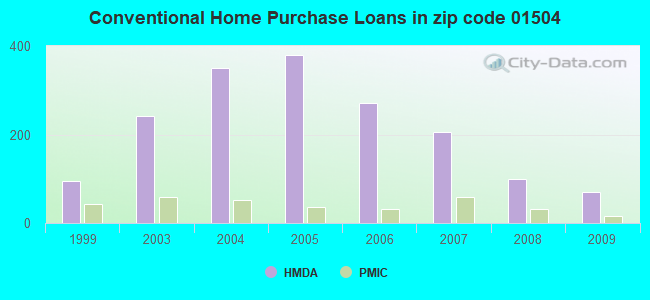
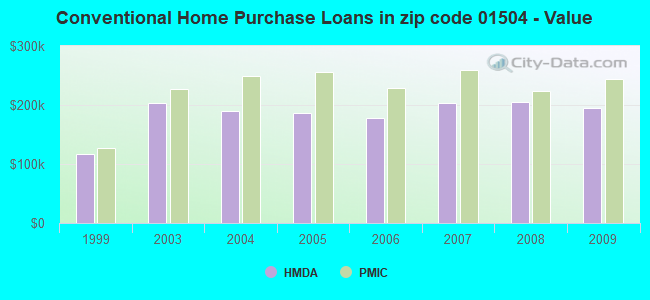
B) Conventional Home Purchase Loans
C) Refinancings
D) Home Improvement Loans
E) Loans on Dwellings For 5+ Families
F) Non-occupant Loans on < 5 Family Dwellings (A B C & D)
Number
Average Value
Number
Average Value
Number
Average Value
Number
Average Value
Number
Average Value
Number
Average Value
LOANS ORIGINATED
78
$226,014
70
$194,970
423
$193,965
36
$112,862
0
$0
6
$86,143
APPLICATIONS APPROVED, NOT ACCEPTED
4
$206,045
14
$198,562
14
$252,016
8
$24,446
0
$0
4
$128,715
APPLICATIONS DENIED
18
$229,494
12
$188,252
120
$229,710
16
$57,498
2
$648,570
2
$130,710
APPLICATIONS WITHDRAWN
6
$181,267
12
$196,234
82
$233,315
4
$170,625
0
$0
4
$182,098
FILES CLOSED FOR INCOMPLETENESS
2
$186,590
2
$335,260
58
$253,132
0
$0
0
$0
0
$0
Aggregated Statistics For Year 2008 (Based on 2 full and 2 partial tracts)
A) FHA, FSA/RHS & VA Home Purchase Loans
B) Conventional Home Purchase Loans
C) Refinancings
D) Home Improvement Loans
E) Loans on Dwellings For 5+ Families
F) Non-occupant Loans on < 5 Family Dwellings (A B C & D)
Number
Average Value
Number
Average Value
Number
Average Value
Number
Average Value
Number
Average Value
Number
Average Value
LOANS ORIGINATED
38
$232,487
100
$204,749
247
$197,613
34
$101,130
2
$478,945
16
$142,311
APPLICATIONS APPROVED, NOT ACCEPTED
2
$267,410
6
$164,970
52
$222,356
2
$36,920
0
$0
2
$139,690
APPLICATIONS DENIED
36
$206,046
18
$254,882
192
$231,781
24
$91,964
2
$548,790
6
$313,310
APPLICATIONS WITHDRAWN
8
$225,254
20
$178,706
76
$223,770
8
$224,505
0
$0
2
$112,750
FILES CLOSED FOR INCOMPLETENESS
2
$223,505
8
$220,264
14
$245,601
2
$54,880
0
$0
2
$202,555
Aggregated Statistics For Year 2007 (Based on 2 full and 2 partial tracts)
A) FHA, FSA/RHS & VA Home Purchase Loans
B) Conventional Home Purchase Loans
C) Refinancings
D) Home Improvement Loans
E) Loans on Dwellings For 5+ Families
F) Non-occupant Loans on < 5 Family Dwellings (A B C & D)
G) Loans On Manufactured Home Dwelling (A B C & D)
Number
Average Value
Number
Average Value
Number
Average Value
Number
Average Value
Number
Average Value
Number
Average Value
Number
Average Value
LOANS ORIGINATED
10
$244,860
206
$202,612
335
$183,822
84
$84,362
2
$383,155
30
$179,271
2
$16,965
APPLICATIONS APPROVED, NOT ACCEPTED
0
$0
32
$193,137
76
$199,455
22
$96,696
0
$0
4
$109,758
0
$0
APPLICATIONS DENIED
6
$239,140
56
$190,295
311
$233,530
54
$68,331
0
$0
6
$139,027
0
$0
APPLICATIONS WITHDRAWN
4
$201,058
28
$152,521
130
$216,584
6
$141,022
2
$399,120
4
$234,482
0
$0
FILES CLOSED FOR INCOMPLETENESS
0
$0
6
$202,220
44
$197,247
2
$14,965
2
$299,340
2
$247,455
0
$0
Aggregated Statistics For Year 2006 (Based on 2 full and 2 partial tracts)
A) FHA, FSA/RHS & VA Home Purchase Loans
B) Conventional Home Purchase Loans
C) Refinancings
D) Home Improvement Loans
E) Loans on Dwellings For 5+ Families
F) Non-occupant Loans on < 5 Family Dwellings (A B C & D)
G) Loans On Manufactured Home Dwelling (A B C & D)
Number
Average Value
Number
Average Value
Number
Average Value
Number
Average Value
Number
Average Value
Number
Average Value
Number
Average Value
LOANS ORIGINATED
10
$253,840
271
$177,675
575
$178,021
144
$86,143
2
$808,220
52
$182,137
4
$27,938
APPLICATIONS APPROVED, NOT ACCEPTED
0
$0
32
$163,514
100
$186,529
18
$58,538
0
$0
10
$153,063
0
$0
APPLICATIONS DENIED
4
$123,728
64
$136,200
343
$209,422
92
$114,660
0
$0
18
$151,111
4
$141,688
APPLICATIONS WITHDRAWN
0
$0
40
$211,634
202
$195,193
32
$69,472
0
$0
8
$160,895
0
$0
FILES CLOSED FOR INCOMPLETENESS
0
$0
2
$375,175
60
$271,102
6
$70,512
0
$0
0
$0
0
$0
Aggregated Statistics For Year 2005 (Based on 2 full and 2 partial tracts)
A) FHA, FSA/RHS & VA Home Purchase Loans
B) Conventional Home Purchase Loans
C) Refinancings
D) Home Improvement Loans
E) Loans on Dwellings For 5+ Families
F) Non-occupant Loans on < 5 Family Dwellings (A B C & D)
G) Loans On Manufactured Home Dwelling (A B C & D)
Number
Average Value
Number
Average Value
Number
Average Value
Number
Average Value
Number
Average Value
Number
Average Value
Number
Average Value
LOANS ORIGINATED
14
$246,599
379
$186,154
724
$195,577
128
$98,502
4
$169,625
64
$176,392
2
$13,970
APPLICATIONS APPROVED, NOT ACCEPTED
0
$0
34
$207,308
78
$182,751
8
$37,668
0
$0
10
$158,251
0
$0
APPLICATIONS DENIED
2
$242,465
80
$164,487
279
$216,297
78
$119,838
0
$0
14
$212,389
0
$0
APPLICATIONS WITHDRAWN
0
$0
72
$166,743
307
$201,621
26
$146,139
2
$561,760
12
$206,046
0
$0
FILES CLOSED FOR INCOMPLETENESS
2
$260,425
38
$154,922
74
$209,403
2
$217,520
0
$0
6
$175,280
0
$0
Aggregated Statistics For Year 2004 (Based on 2 full and 2 partial tracts)
A) FHA, FSA/RHS & VA Home Purchase Loans
B) Conventional Home Purchase Loans
C) Refinancings
D) Home Improvement Loans
E) Loans on Dwellings For 5+ Families
F) Non-occupant Loans on < 5 Family Dwellings (A B C & D)
Number
Average Value
Number
Average Value
Number
Average Value
Number
Average Value
Number
Average Value
Number
Average Value
LOANS ORIGINATED
10
$267,610
351
$189,883
774
$184,505
114
$107,587
2
$486,925
60
$152,797
APPLICATIONS APPROVED, NOT ACCEPTED
2
$146,675
22
$158,741
114
$185,066
26
$87,116
0
$0
10
$152,863
APPLICATIONS DENIED
2
$261,425
68
$154,278
235
$206,345
52
$103,272
0
$0
12
$110,257
APPLICATIONS WITHDRAWN
0
$0
24
$237,227
257
$201,649
22
$136,880
0
$0
6
$162,973
FILES CLOSED FOR INCOMPLETENESS
0
$0
12
$188,917
160
$213,043
10
$131,310
0
$0
6
$103,107
Aggregated Statistics For Year 2003 (Based on 2 full and 2 partial tracts)
A) FHA, FSA/RHS & VA Home Purchase Loans
B) Conventional Home Purchase Loans
C) Refinancings
D) Home Improvement Loans
E) Loans on Dwellings For 5+ Families
F) Non-occupant Loans on < 5 Family Dwellings (A B C & D)
Number
Average Value
Number
Average Value
Number
Average Value
Number
Average Value
Number
Average Value
Number
Average Value
LOANS ORIGINATED
26
$228,266
241
$202,996
1,672
$153,735
48
$47,936
4
$426,560
44
$122,548
APPLICATIONS APPROVED, NOT ACCEPTED
4
$215,025
20
$186,788
180
$151,544
26
$49,660
0
$0
12
$107,928
APPLICATIONS DENIED
2
$159,650
26
$235,481
349
$161,901
22
$48,892
0
$0
10
$167,830
APPLICATIONS WITHDRAWN
2
$184,595
14
$164,637
267
$153,975
14
$72,554
0
$0
8
$118,239
FILES CLOSED FOR INCOMPLETENESS
0
$0
6
$305,660
30
$183,329
0
$0
0
$0
0
$0
Aggregated Statistics For Year 1999 (Based on 1 full and 1 partial tracts)
A) FHA, FSA/RHS & VA Home Purchase Loans
B) Conventional Home Purchase Loans
C) Refinancings
D) Home Improvement Loans
F) Non-occupant Loans on < 5 Family Dwellings (A B C & D)
Detailed PMIC statistics for the following Tracts:7471.00
2002 - 2018 National Fire Incident Reporting System (NFIRS) incidents
Based on the data from the years 2002 - 2018 the average number of fires per year is 34. The highest number of reported fires - 57 took place in 2007, and the least - 12 in 2018. The data has a declining trend.
When looking into fire subcategories, the most reports belonged to: Outside Fires (46.0%), and Structure Fires (38.9%).
Fire incident types reported to NFIRS in Zip Code 01504


 Nearest zip codes: 01529, 02895, 01756, 02896, 02019, 02876.


 Based on the data from the years 2002 - 2018 the average number of fires per year is 34. The highest number of reported fires - 57 took place in 2007, and the least - 12 in 2018. The data has a declining trend.
 When looking into fire subcategories, the most reports belonged to: Outside Fires (46.0%), and Structure Fires (38.9%).