Estimated zip code population in 2022: 7,108 Zip code population in 2010: 6,590 Zip code population in 2000: 5,902
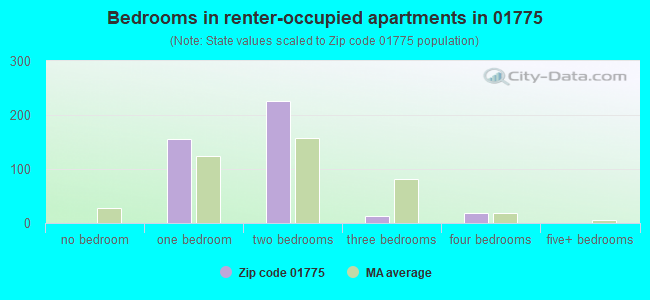
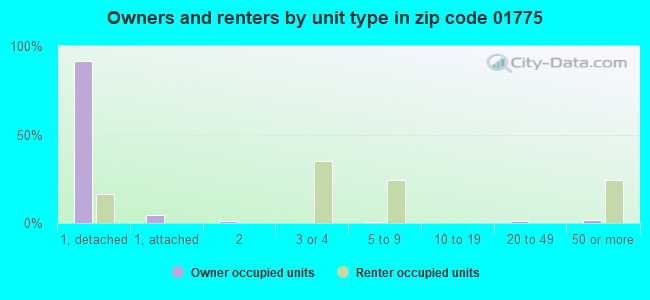
Houses and condos: 2,645 Renter-occupied apartments: 415
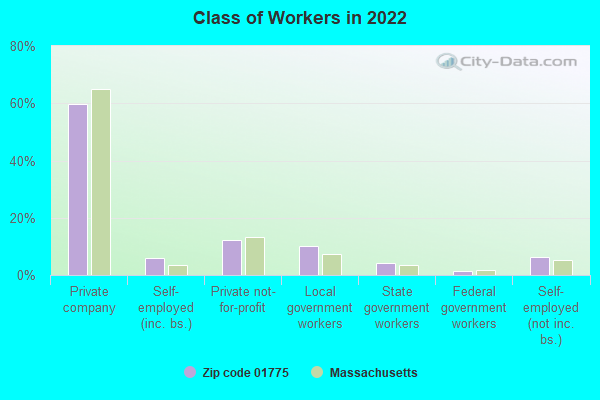
% of renters here:
16%
State:
38%
March 2022 cost of living index in zip code 01775: 132.4 (high, U.S. average is 100)
Land area: 17.3 sq. mi. Water area: 0.7 sq. mi.
Population density: 411 people per square mile
(low).
OSM Map
Google Map
MSN Map
OSM Map
General Map
Google Map
MSN Map
OSM Map
Google Map
MSN Map
OSM Map
Google Map
MSN Map
Please wait while loading the map...
Real estate property taxes paid for housing units in 2022:
This zip code:
1.4% ($9,915)
Massachusetts:
1.0% ($5,536)
Median real estate property taxes paid for housing units with mortgages in 2022: $9,911 (1.4%) Median real estate property taxes paid for housing units with no mortgage in 2022: $9,925 (1.5%)
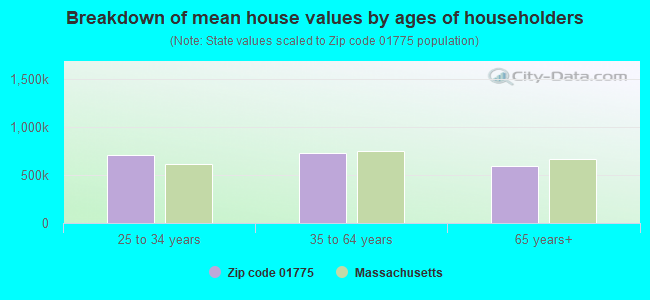
Estimated median house/condo value in 2022: $700,447
01775:
$700,447
Massachusetts:
$534,700
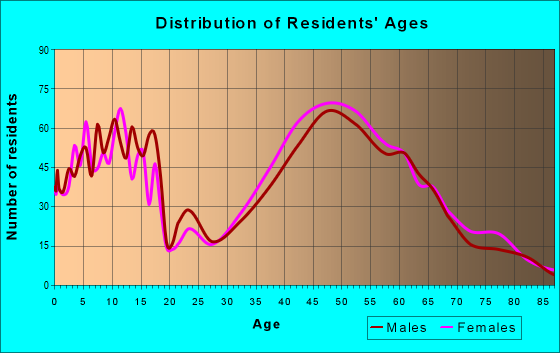
Median resident age:
This zip code:
41.5 years
Massachusetts median age:
40.3 years
Average household size:
This zip code:
2.7 people
Massachusetts:
2.4 people
Averages for the 2020 tax year for zip code 01775, filed in 2021:
Average Adjusted Gross Income (AGI) in 2020: $170,012 (Individual Income Tax Returns)
Here:
$170,012
State:
$105,130
Salary/wage: $134,591 (reported on 80.5% of returns)
Here:
$134,591
State:
$82,951
(% of AGI for various income ranges: 1236.0% for AGIs below $25k, 3518.9% for AGIs $25k-50k, 6932.2% for AGIs $50k-75k, 9200.6% for AGIs $75k-100k, 22262.3% for AGIs $100k-200k, 88877.0% for AGIs over 200k)
Taxable interest for individuals: $2,127 (reported on 61.9% of returns)
This zip code:
$2,127
Massachusetts:
$2,361
(% of AGI for various income ranges: 34.0% for AGIs below $25k, 57.9% for AGIs $25k-50k, 143.9% for AGIs $50k-75k, 165.6% for AGIs $75k-100k, 259.0% for AGIs $100k-200k, 989.0% for AGIs over 200k)
Ordinary dividends: $9,010 (reported on 47.7% of returns)
Here:
$9,010
State:
$10,365
(% of AGI for various income ranges: 77.6% for AGIs below $25k, 155.4% for AGIs $25k-50k, 312.8% for AGIs $50k-75k, 451.9% for AGIs $75k-100k, 851.8% for AGIs $100k-200k, 3436.3% for AGIs over 200k)
Net capital gain/loss in AGI: +$56,412 (reported on 42.2% of returns)
Here:
+$56,412
State:
+$48,178
(% of AGI for various income ranges: 47.4% for AGIs below $25k, 103.6% for AGIs $25k-50k, 313.3% for AGIs $50k-75k, 616.2% for AGIs $75k-100k, 1069.5% for AGIs $100k-200k, 26888.0% for AGIs over 200k)
Profit/loss from business: +$23,425 (reported on 20.0% of returns)
Here:
+$23,425
State:
+$20,792
(% of AGI for various income ranges: 171.7% for AGIs below $25k, 399.3% for AGIs $25k-50k, 584.4% for AGIs $50k-75k, 1013.1% for AGIs $75k-100k, 1343.1% for AGIs $100k-200k, 2450.0% for AGIs over 200k)
Taxable individual retirement arrangement distribution: $29,650 (reported on 14.8% of returns)
01775:
$29,650
Massachusetts:
$22,790
(% of AGI for various income ranges: 80.5% for AGIs below $25k, 243.6% for AGIs $25k-50k, 531.7% for AGIs $50k-75k, 871.2% for AGIs $75k-100k, 1505.4% for AGIs $100k-200k, 2256.3% for AGIs over 200k)
Self-employed (Keogh) retirement plans: $28,414 (reported on 1.9% of returns)
01775:
$28,414
Massachusetts:
$26,868
(% of AGI for various income ranges: 170.0% for AGIs $75k-100k, 572.3% for AGIs over 200k)
Total itemized deductions: $30,844 (reported on 22.5% of returns)
Here:
$30,844
State:
$36,722
(% of AGI for various income ranges: 265.0% for AGIs below $25k, 427.9% for AGIs $25k-50k, 769.4% for AGIs $50k-75k, 906.9% for AGIs $75k-100k, 1574.1% for AGIs $100k-200k, 4668.7% for AGIs over 200k)
Charity contributions: $6,395 (reported on 17.3% of returns)
Here:
$6,395
State:
$12,529
(% of AGI for various income ranges: 4.5% for AGIs below $25k, 28.2% for AGIs $25k-50k, 78.3% for AGIs $50k-75k, 91.2% for AGIs $75k-100k, 161.5% for AGIs $100k-200k, 1004.7% for AGIs over 200k)
Taxes paid: $9,455 (reported on 22.5% of returns)
01775:
$9,455
State:
$8,782
(% of AGI for various income ranges: 65.0% for AGIs below $25k, 141.1% for AGIs $25k-50k, 293.3% for AGIs $50k-75k, 326.2% for AGIs $75k-100k, 548.7% for AGIs $100k-200k, 1298.3% for AGIs over 200k)
Earned income credit: $1,362 (reported on 3.6% of returns)
Here:
$1,362
State:
$1,909
(% of AGI for various income ranges: 23.1% for AGIs below $25k, 28.6% for AGIs $25k-50k)
Percentage of individuals using paid preparers for their 2020 taxes: 91.8%
Here:
92%
State:
92%
(% for various income ranges: 87.8% for AGIs below $25k, 90.7% for AGIs $25k-50k, 90.9% for AGIs $50k-75k, 90.0% for AGIs $75k-100k, 94.0% for AGIs $100k-200k, 94.6% for AGIs over 200k)
Averages for the 2012 tax year for zip code 01775, filed in 2013:
Average Adjusted Gross Income (AGI) in 2012: $123,599 (Individual Income Tax Returns)
Here:
$123,599
State:
$81,425
Salary/wage: $109,012 (reported on 82.6% of returns)
Here:
$109,012
State:
$64,752
(% of AGI for various income ranges: 68.7% for AGIs below $25k, 66.1% for AGIs $25k-50k, 63.7% for AGIs $50k-75k, 65.5% for AGIs $75k-100k, 82.0% for AGIs $100k-200k, 70.1% for AGIs over 200k)
Taxable interest for individuals: $1,513 (reported on 61.0% of returns)
This zip code:
$1,513
Massachusetts:
$2,136
(% of AGI for various income ranges: 2.1% for AGIs below $25k, 1.3% for AGIs $25k-50k, 0.8% for AGIs $50k-75k, 0.7% for AGIs $75k-100k, 0.6% for AGIs $100k-200k, 0.7% for AGIs over 200k)
Ordinary dividends: $6,273 (reported on 45.0% of returns)
Here:
$6,273
State:
$9,473
(% of AGI for various income ranges: 5.4% for AGIs below $25k, 2.6% for AGIs $25k-50k, 2.9% for AGIs $50k-75k, 3.4% for AGIs $75k-100k, 1.9% for AGIs $100k-200k, 2.2% for AGIs over 200k)
Net capital gain/loss in AGI: +$11,784 (reported on 38.4% of returns)
Here:
+$11,784
State:
+$31,437
(% of AGI for various income ranges: 0.9% for AGIs $25k-50k, 0.1% for AGIs $50k-75k, 0.3% for AGIs $75k-100k, 0.9% for AGIs $100k-200k, 6.4% for AGIs over 200k)
Profit/loss from business: +$27,810 (reported on 21.3% of returns)
Here:
+$27,810
State:
+$20,662
(% of AGI for various income ranges: 7.8% for AGIs below $25k, 10.4% for AGIs $25k-50k, 6.9% for AGIs $50k-75k, 6.1% for AGIs $75k-100k, 4.5% for AGIs $100k-200k, 4.1% for AGIs over 200k)
Taxable individual retirement arrangement distribution: $19,684 (reported on 15.3% of returns)
01775:
$19,684
Massachusetts:
$18,892
(% of AGI for various income ranges: 6.4% for AGIs below $25k, 4.3% for AGIs $25k-50k, 6.2% for AGIs $50k-75k, 4.9% for AGIs $75k-100k, 2.6% for AGIs $100k-200k, 1.4% for AGIs over 200k)
Self-employment retirement plans: $21,467 (reported on 2.7% of returns)
01775:
$21,467
Massachusetts:
$20,669
(% of AGI for various income ranges: 0.6% for AGIs $100k-200k, 0.6% for AGIs over 200k)
Total itemized deductions: $31,332 (18% of AGI, reported on 63.7% of returns)
Here:
$31,332
State:
$28,907
Here:
17.7% of AGI
State:
18.2% of AGI
(% of AGI for various income ranges: 24.2% for AGIs below $25k, 19.6% for AGIs $25k-50k, 20.5% for AGIs $50k-75k, 21.5% for AGIs $75k-100k, 18.9% for AGIs $100k-200k, 12.9% for AGIs over 200k)
Charity contributions: $2,539 (reported on 55.3% of returns)
Here:
$2,539
State:
$4,208
(% of AGI for various income ranges: 0.8% for AGIs below $25k, 1.1% for AGIs $25k-50k, 1.5% for AGIs $50k-75k, 1.6% for AGIs $75k-100k, 1.4% for AGIs $100k-200k, 0.9% for AGIs over 200k)
Taxes paid: $16,955 (reported on 63.4% of returns)
01775:
$16,955
State:
$13,303
(% of AGI for various income ranges: 8.3% for AGIs below $25k, 8.1% for AGIs $25k-50k, 9.0% for AGIs $50k-75k, 10.4% for AGIs $75k-100k, 10.1% for AGIs $100k-200k, 7.7% for AGIs over 200k)
Earned income credit: $1,492 (reported on 3.9% of returns)
Here:
$1,492
State:
$1,971
(% of AGI for various income ranges: 1.7% for AGIs below $25k, 0.4% for AGIs $25k-50k)
Percentage of individuals using paid preparers for their 2012 taxes: 48.9%
Here:
49%
State:
56%
(% for various income ranges: 41.0% for AGIs below $25k, 48.8% for AGIs $25k-50k, 51.4% for AGIs $50k-75k, 60.0% for AGIs $75k-100k, 46.5% for AGIs $100k-200k, 57.1% for AGIs over 200k)
Averages for the 2004 tax year for zip code 01775, filed in 2005:
Average Adjusted Gross Income (AGI) in 2004: $94,860 (Individual Income Tax Returns)
Here:
$94,860
State:
$62,877
Salary/wage: $85,174 (reported on 83.5% of returns)
Here:
$85,174
State:
$52,969
(% of AGI for various income ranges: 97.7% for AGIs below $10k, 58.2% for AGIs $10k-25k, 69.7% for AGIs $25k-50k, 70.6% for AGIs $50k-75k, 77.2% for AGIs $75k-100k, 75.7% for AGIs over 100k)
Taxable interest for individuals: $1,741 (reported on 75.0% of returns)
This zip code:
$1,741
Massachusetts:
$1,945
(% of AGI for various income ranges: 6.6% for AGIs below $10k, 5.1% for AGIs $10k-25k, 2.4% for AGIs $25k-50k, 1.9% for AGIs $50k-75k, 1.4% for AGIs $75k-100k, 1.1% for AGIs over 100k)
Taxable dividends: $3,596 (reported on 52.4% of returns)
Here:
$3,596
State:
$5,323
(% of AGI for various income ranges: 10.7% for AGIs below $10k, 4.3% for AGIs $10k-25k, 2.9% for AGIs $25k-50k, 2.7% for AGIs $50k-75k, 1.7% for AGIs $75k-100k, 1.7% for AGIs over 100k)
Net capital gain/loss: +$11,328 (reported on 44.3% of returns)
Here:
+$11,328
State:
+$20,377
(% of AGI for various income ranges: -4.3% for AGIs below $10k, 1.0% for AGIs $10k-25k, 1.0% for AGIs $25k-50k, 2.6% for AGIs $50k-75k, 1.7% for AGIs $75k-100k, 6.6% for AGIs over 100k)
Profit/loss from business: +$21,501 (reported on 22.5% of returns)
Here:
+$21,501
State:
+$17,837
(% of AGI for various income ranges: 7.9% for AGIs below $10k, 11.9% for AGIs $10k-25k, 10.7% for AGIs $25k-50k, 7.5% for AGIs $50k-75k, 7.9% for AGIs $75k-100k, 3.9% for AGIs over 100k)
Profit/loss from farming: +$4,211 (reported on 0.6% of returns)
Here:
+$4,211
State:
-$2,642
IRA payment deduction: $3,297 (reported on 4.9% of returns)
01775:
$3,297
Massachusetts:
$3,100
(% of AGI for various income ranges: 1.0% for AGIs $25k-50k, 0.4% for AGIs $50k-75k, 0.2% for AGIs $75k-100k, 0.1% for AGIs over 100k)
Self-employed pension: $10,339 (reported on 3.7% of returns)
Here:
$10,339
Massachusetts:
$14,516
(% of AGI for various income ranges: 0.6% for AGIs $25k-50k, 0.3% for AGIs $50k-75k, 0.4% for AGIs $75k-100k, 0.4% for AGIs over 100k)
Total itemized deductions: $26,617 (20% of AGI, reported on 63.7% of returns)
Here:
$26,617
State:
$22,573
Here:
19.6% of AGI
State:
19.5% of AGI
(% of AGI for various income ranges: 26.6% for AGIs below $10k, 30.6% for AGIs $10k-25k, 21.2% for AGIs $25k-50k, 23.6% for AGIs $50k-75k, 23.5% for AGIs $75k-100k, 15.9% for AGIs over 100k)
Charity contributions deductions: $2,697 (2% of AGI, reported on 58.9% of returns)
Here:
$2,697
State:
$3,295
Here:
1.9% of AGI
State:
2.7% of AGI
(% of AGI for various income ranges: 1.0% for AGIs below $10k, 1.4% for AGIs $10k-25k, 1.6% for AGIs $25k-50k, 1.8% for AGIs $50k-75k, 1.7% for AGIs $75k-100k, 1.7% for AGIs over 100k)
Total tax: $18,212 (reported on 84.4% of returns)
01775:
$18,212
State:
$11,494
(% of AGI for various income ranges: 4.0% for AGIs below $10k, 5.5% for AGIs $10k-25k, 8.6% for AGIs $25k-50k, 9.5% for AGIs $50k-75k, 10.0% for AGIs $75k-100k, 18.7% for AGIs over 100k)
Earned income credit: $1,172 (reported on 3.1% of returns)
Here:
$1,172
State:
$1,518
Percentage of individuals using paid preparers for their 2004 taxes: 49.8%
Here:
50%
State:
58%
(% for various income ranges: 42.7% for AGIs below $10k, 51.0% for AGIs $10k-25k, 51.8% for AGIs $25k-50k, 53.6% for AGIs $50k-75k, 54.0% for AGIs $75k-100k, 50.0% for AGIs over 100k)
Household received Food Stamps/SNAP in the past 12 months: 68 Household did not receive Food Stamps/SNAP in the past 12 months: 2,534
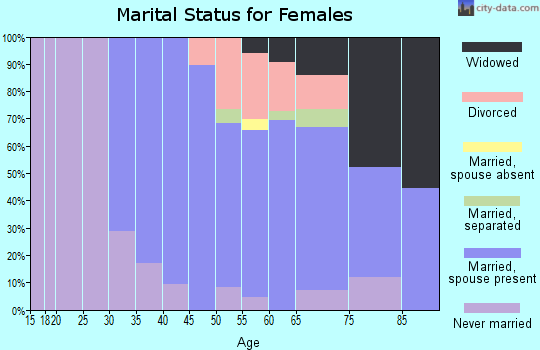
Women who had a birth in the past 12 months: 104 (102 now married, 5 unmarried) Women who did not have a birth in the past 12 months: 1,277 (784 now married, 472 unmarried)
Housing units in zip code 01775 with a mortgage: 1,666 (274 second mortgage, 278 both second mortgage and home equity loan) Houses without a mortgage: 44
Median monthly owner costs for units with a mortgage: $3,278 Median monthly owner costs for units without a mortgage: $1,365
Residents with income below the poverty level in 2022:
This zip code:
4.3%
Whole state:
10.4%
Residents with income below 50% of the poverty level in 2022:
This zip code:
3.3%
Whole state:
5.1%
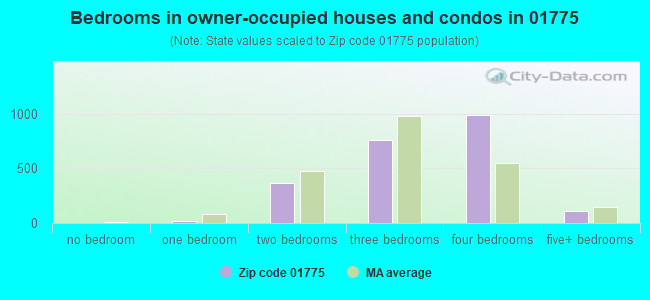
Median number of rooms in houses and condos:
Here:
7.9
State:
6.5
Median number of rooms in apartments:
Here:
4.1
State:
4.0
Notable locations in this zip code not listed on our city pages
Notable locations in zip code 01775: Carver Hill Orchards (A), Derby Orchard (B), Honey Pot Hill Orchards (C), One Stack Farm (D), Shelburne Farm (E), Butternut Farm Golf Course (F), Stowe Acres Country Club (G), Stow Away Golf Club (H), Stow Fire Department (I), Randall Library (J), Stowe Town Hall (K). Display/hide their locations on the map
In group quarters: 6 (-1 institutionalized population)
Size of family households: 927 2-persons, 515 3-persons, 457 4-persons, 191 5-persons, 81 6-persons
Size of nonfamily households: 366 1-person, 97 2-persons, 5 3-persons
1,359 married couples with children.
199 single-parent households (199 women).
88.8% of residents of 01775 zip code speak English at home.
0.2% of residents speak Spanish at home (62% very well, 38% well).
5.9% of residents speak other Indo-European language at home (88% very well, 12% well).
4.4% of residents speak Asian or Pacific Island language at home (69% very well, 31% well).
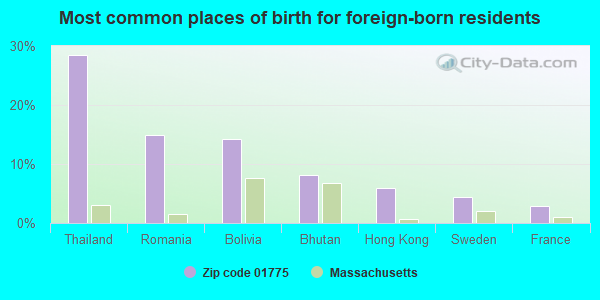
Foreign born population: 676 (9.5%) (48.5% of them are naturalized citizens)
This zip code:
9.5%
Whole state:
18.0%
29%Thailand
15%Romania
14%Bolivia
8%Bhutan
6%Hong Kong
4%Sweden
3%France
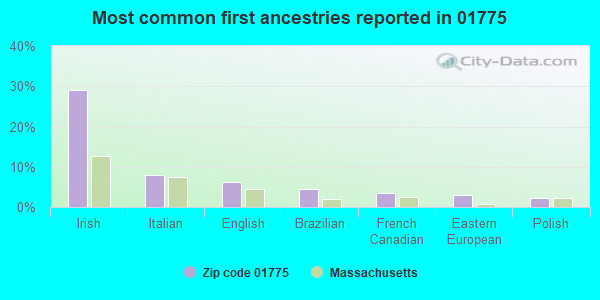
29%Irish
8%Italian
6%English
5%Brazilian
3%French Canadian
3%Eastern European
2%Polish
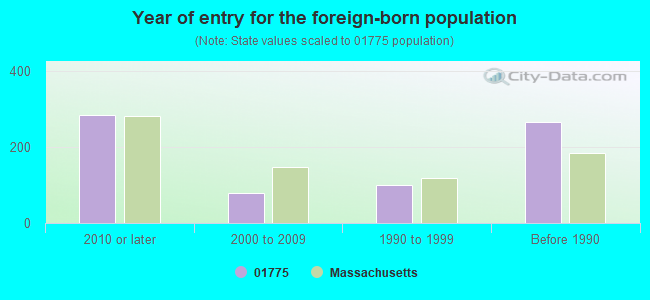
Year of entry for the foreign-born population
2852010 or later
802000 to 2009
1011990 to 1999
267Before 1990
Facilities with environmental interests located in this zip code:
(Resource Conservation and Recovery Act (tracking hazardous waste))
OIL ENERGY RECOVERY INC (365 TAYLOR ST in STOW, MA)
(Resource Conservation and Recovery Act (tracking hazardous waste)) Organizations: MICHAEL E GENTUSO (CONTACT/OWNER)
JOHNSONS GARAGE (383 HUDSON RD in STOW, MA)
(Resource Conservation and Recovery Act (tracking hazardous waste)) Organizations: ARNOLD JOHNSON (CONTACT/OWNER)
AUTO SPORT ENGINEERING INC (370 HUDSON RD in STOW, MA)
Conditionally Exempt Small Quantity Generators, less than 100 kg/month of hazardous waste (Resource Conservation and Recovery Act (tracking hazardous waste)) - notification Organizations: H LEONARD CUMMINGS (CONTACT/OWNER)
AUTO TECH (626 GREAT RD in STOW, MA)
Conditionally Exempt Small Quantity Generators, less than 100 kg/month of hazardous waste (Resource Conservation and Recovery Act (tracking hazardous waste)) - notification Organizations: ROBERT SLUYSKI (CONTACT/OWNER)
Conditionally Exempt Small Quantity Generators, less than 100 kg/month of hazardous waste (Resource Conservation and Recovery Act (tracking hazardous waste)) Organizations: WILLIAM LAZOTT (CONTACT/OWNER)
BODY WORKS UNLIMITED (43 CRESENT ST in STOW, MA)
(Resource Conservation and Recovery Act (tracking hazardous waste))
ERKKINEN BUICK (92 GREAT RD in STOW, MA)
Conditionally Exempt Small Quantity Generators, less than 100 kg/month of hazardous waste (Resource Conservation and Recovery Act (tracking hazardous waste)) - notification
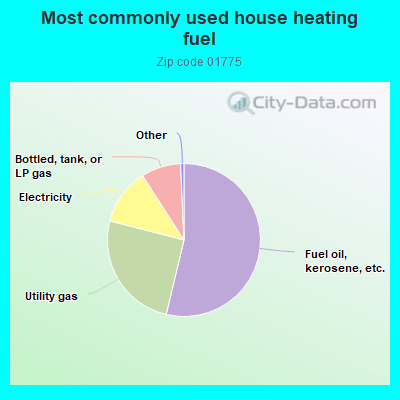
53.8%Fuel oil, kerosene, etc.
25.3%Utility gas
11.9%Electricity
8.4%Bottled, tank, or LP gas
Population in 1990: 5,328. Population change in the 1990s: +574 (+10.8%).
Place of birth for U.S.-born residents:
This state: 4,324
Northeast: 1,359
Midwest: 195
South: 259
West: 228
69% of the 01775 zip code residents lived in the same house 5 years ago. Out of people who lived in different houses, 70% lived in this county. Out of people who lived in different counties, 50% lived in Massachusetts.
90% of the 01775 zip code residents lived in the same house 1 year ago. Out of people who lived in different houses, 82% moved from this county. Out of people who lived in different houses, 3% moved from different county within same state. Out of people who lived in different houses, 7% moved from different state.
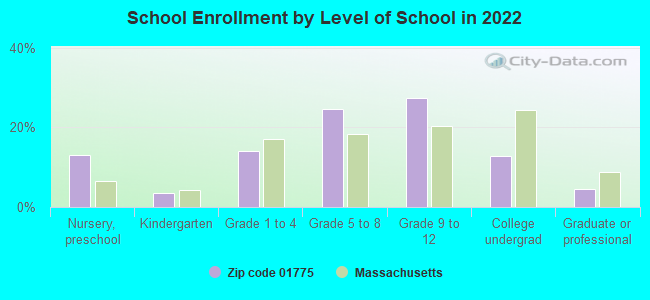
Private vs. public school enrollment:
Students in private schools in grades 1 to 8 (elementary and middle school): 7
Here:
1.0%
Massachusetts:
10.3%
Students in private schools in grades 9 to 12 (high school): 62
Here:
11.4%
Massachusetts:
12.3%
Students in private undergraduate colleges: 75
Here:
29.4%
Massachusetts:
51.2%
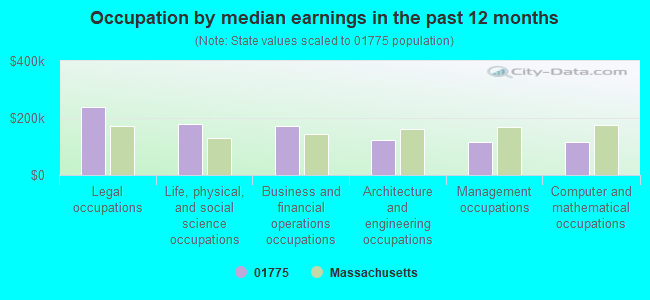
Occupation by median earnings in the past 12 months ($)
240,064Legal occupations
178,688Life, physical, and social science occupations
172,852Business and financial operations occupations
121,118Architecture and engineering occupations
117,086Management occupations
115,878Computer and mathematical occupations
Companies with federal contracts located in this zip code (STOW, MA):
RADANT MEMS, INC (255 HUDSON ROAD; small business) : $6,420,317 in 15 contractsfrom 2002 to 2006
Contracts for Defense Electronics and Communication Equipment -- Advanced Development (R&D), Other Defense -- Basic Research (R&D), Defense Electronics and Communication Equipment -- Operational Systems Development (R&D), Defense Electronics and Communication Equipment -- Management and Support (R&D), and moreby Air Force Signed by year:2000: $0; 2001: $0; 2002: $906,372; 2003: $1,825,600; 2004: $1,782,858; 2005: $1,526,550; 2006: $378,937.
Biggest contracts:
$1,023,600 with Air Force for Defense Electronics and Communication Equipment -- Advanced Development (R&D). Signed on 2003-01-24. Completion date: 2005-07-04.
$893,000, same as above.Signed on 2004-02-10. Completion date: 2005-07-04.
$802,000, same as above.Signed on 2003-07-14. Completion date: 2005-07-04.
$790,213, same as above.Signed on 2004-05-28. Completion date: 2005-07-04.
COLLINGS FOUNDATION INC (137 BARTON RD) : $58,150 in 8 contractsfrom 2005 to 2006
Contracts for Recreational Services, Other Management Support Services, Other Social Services, Air Charter for Things by Air Force, Army Signed by year:2000: $0; 2001: $0; 2002: $0; 2003: $0; 2004: $0; 2005: $46,000; 2006: $12,150.
Biggest contracts:
$12,500 with Air Force for Recreational Services. Taking place in AR. Signed on 2005-09-15. Completion date: 2005-10-09.
$12,500 with Army for Other Management Support Services. Signed on 2005-05-18. Completion date: 2005-05-22.
$11,300 with Air Force for Other Social Services. Taking place in TX. Signed on 2005-10-25. Completion date: 2005-11-06.
$9,700 with Air Force for Recreational Services. Taking place in CA. Signed on 2005-10-18. Completion date: 2005-10-23.
CAPONE, CATHERINE F (200 RED ACRE RD; small business) : $38,009 in 2 contractsin 2005
$23,036 with Army for Other Professional Services. Signed on 2005-10-26. Completion date: 2006-10-31.
$14,973 with Army for Technical Representation Services -- Miscellaneous. Signed on 2005-03-04. Completion date: 2005-09-30.
BILLS PAINTING & WALLCOVERING, (501 GLEASONDALE ROAD; small business) : $21,360 in 4 contractsfrom 2003 to 2005
$6,483 with Army for Maintenance, Repair or Alteration of Real Property -- Office Buildings. Signed on 2005-08-31. Completion date: 2005-09-29.
$6,482, same as above.Signed on 2005-05-24. Completion date: 2005-06-25.
$5,235 with Army for Maintenance, Repair or Alteration of Real Property -- Hospitals and Infirmaries. Signed on 2005-04-12. Completion date: 2005-05-28.
$3,160 with Army for Maintenance, Repair or Alteration of Real Property -- Office Buildings. Signed on 2003-04-16. Completion date: 2003-04-25.
FACILIS TECHNOLOGY INC (291 HUDSON RD; small business)
$18,660 with Army for Office Furniture. Signed on 2005-01-28. Completion date: 2005-02-07.
Top industries in this zip code by the number of employees in 2005:
Construction: Highway, Street, and Bridge Construction (100-249 employees: 1 establishment, 10-19 employees: 1 establishment)
Arts, Entertainment, and Recreation: Fitness and Recreational Sports Centers (50-99: 1, 1-4: 1)
Arts, Entertainment, and Recreation: Golf Courses and Country Clubs (20-49: 2, 5-9: 1)
Professional, Scientific, and Technical Services: Research and Development in the Physical, Engineering, and Life Sciences (50-99: 1)
Accommodation and Food Services: Full-Service Restaurants (20-49: 1, 10-19: 2)
Health Care and Social Assistance: Child Day Care Services (20-49: 1, 10-19: 1)
Other Services (except Public Administration): Commercial and Industrial Machinery and Equipment (except Automotive and Electronic) Repair and Maintenance (20-49: 1)
Accommodation and Food Services: Snack and Nonalcoholic Beverage Bars (10-19: 2)
People in group quarters in 2010:
2 people in other noninstitutional facilities
People in group quarters in 2000:
26 people in nursing homes
2 people in agriculture workers' dormitories on farms
Fatal accident statistics in 2013:
Fatal accident count: 1
Vehicles involved in fatal accidents: 1
Fatal accidents caused by drunken drivers: 0
Fatalities: 1
Persons involved in fatal accidents: 1
Pedestrians involved in fatal accidents: 0
Home Mortgage Disclosure Act Aggregated Statistics For Year 2009 (Based on 2 full tracts)
A) FHA, FSA/RHS & VA Home Purchase Loans
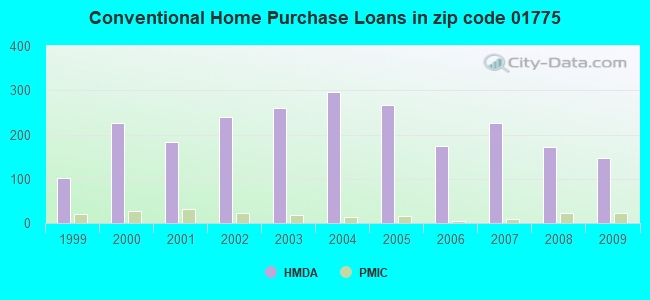
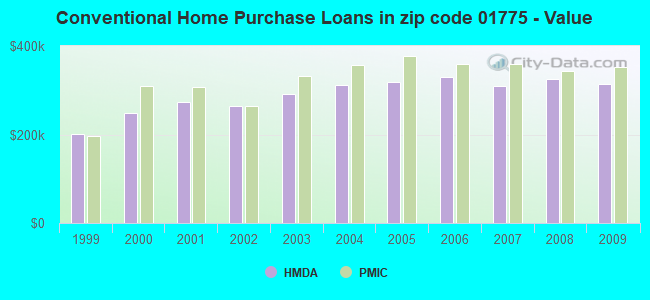
B) Conventional Home Purchase Loans
C) Refinancings
D) Home Improvement Loans
F) Non-occupant Loans on < 5 Family Dwellings (A B C & D)
Number
Average Value
Number
Average Value
Number
Average Value
Number
Average Value
Number
Average Value
LOANS ORIGINATED
16
$321,666
148
$314,914
702
$296,236
30
$182,464
6
$290,692
APPLICATIONS APPROVED, NOT ACCEPTED
0
$0
10
$174,415
44
$297,072
2
$29,935
0
$0
APPLICATIONS DENIED
2
$272,400
16
$285,121
118
$308,895
6
$226,168
2
$318,300
APPLICATIONS WITHDRAWN
2
$439,030
10
$247,854
98
$313,085
2
$449,010
0
$0
FILES CLOSED FOR INCOMPLETENESS
0
$0
0
$0
30
$340,782
6
$66,520
0
$0
Aggregated Statistics For Year 2008 (Based on 2 full tracts)
A) FHA, FSA/RHS & VA Home Purchase Loans
B) Conventional Home Purchase Loans
C) Refinancings
D) Home Improvement Loans
F) Non-occupant Loans on < 5 Family Dwellings (A B C & D)
Number
Average Value
Number
Average Value
Number
Average Value
Number
Average Value
Number
Average Value
LOANS ORIGINATED
10
$470,962
172
$325,283
257
$292,336
22
$100,324
20
$322,190
APPLICATIONS APPROVED, NOT ACCEPTED
0
$0
24
$293,935
18
$276,945
6
$168,295
2
$236,480
APPLICATIONS DENIED
4
$467,968
8
$243,962
50
$296,426
6
$157,320
0
$0
APPLICATIONS WITHDRAWN
4
$227,000
14
$224,362
30
$327,278
2
$272,400
0
$0
FILES CLOSED FOR INCOMPLETENESS
2
$261,425
6
$360,538
12
$219,018
4
$87,308
0
$0
Aggregated Statistics For Year 2007 (Based on 2 full tracts)
A) FHA, FSA/RHS & VA Home Purchase Loans
B) Conventional Home Purchase Loans
C) Refinancings
D) Home Improvement Loans
F) Non-occupant Loans on < 5 Family Dwellings (A B C & D)
Number
Average Value
Number
Average Value
Number
Average Value
Number
Average Value
Number
Average Value
LOANS ORIGINATED
4
$303,330
227
$309,274
196
$285,819
26
$65,087
10
$199,360
APPLICATIONS APPROVED, NOT ACCEPTED
0
$0
36
$264,362
26
$319,066
4
$42,408
6
$204,548
APPLICATIONS DENIED
0
$0
18
$375,173
48
$308,029
4
$65,355
0
$0
APPLICATIONS WITHDRAWN
0
$0
20
$290,060
34
$263,771
4
$284,872
2
$561,760
FILES CLOSED FOR INCOMPLETENESS
0
$0
2
$183,595
14
$291,215
0
$0
2
$277,390
Aggregated Statistics For Year 2006 (Based on 2 full tracts)
B) Conventional Home Purchase Loans
C) Refinancings
D) Home Improvement Loans
F) Non-occupant Loans on < 5 Family Dwellings (A B C & D)
Number
Average Value
Number
Average Value
Number
Average Value
Number
Average Value
LOANS ORIGINATED
174
$329,928
249
$257,777
48
$89,927
8
$159,648
APPLICATIONS APPROVED, NOT ACCEPTED
26
$330,425
26
$184,823
8
$243,464
0
$0
APPLICATIONS DENIED
8
$380,411
98
$326,953
24
$225,253
2
$105,765
APPLICATIONS WITHDRAWN
24
$237,393
66
$311,132
4
$105,268
6
$142,020
FILES CLOSED FOR INCOMPLETENESS
4
$71,342
14
$282,377
4
$87,308
0
$0
Aggregated Statistics For Year 2005 (Based on 2 full tracts)
B) Conventional Home Purchase Loans
C) Refinancings
D) Home Improvement Loans
F) Non-occupant Loans on < 5 Family Dwellings (A B C & D)
Number
Average Value
Number
Average Value
Number
Average Value
Number
Average Value
LOANS ORIGINATED
267
$318,160
345
$292,902
66
$128,172
12
$332,268
APPLICATIONS APPROVED, NOT ACCEPTED
34
$398,298
20
$311,314
8
$118,489
0
$0
APPLICATIONS DENIED
26
$156,501
110
$291,158
14
$232,915
0
$0
APPLICATIONS WITHDRAWN
38
$388,249
44
$288,273
6
$117,740
4
$294,350
FILES CLOSED FOR INCOMPLETENESS
18
$142,796
48
$296,679
2
$358,210
2
$138,695
Aggregated Statistics For Year 2004 (Based on 2 full tracts)
B) Conventional Home Purchase Loans
C) Refinancings
D) Home Improvement Loans
E) Loans on Dwellings For 5+ Families
F) Non-occupant Loans on < 5 Family Dwellings (A B C & D)
Number
Average Value
Number
Average Value
Number
Average Value
Number
Average Value
Number
Average Value
LOANS ORIGINATED
297
$312,362
417
$265,649
62
$143,361
0
$0
16
$245,209
APPLICATIONS APPROVED, NOT ACCEPTED
30
$367,257
44
$179,513
22
$142,323
0
$0
2
$224,505
APPLICATIONS DENIED
18
$316,081
78
$247,147
18
$76,387
0
$0
0
$0
APPLICATIONS WITHDRAWN
28
$283,803
58
$242,328
2
$249,450
2
$256,435
0
$0
FILES CLOSED FOR INCOMPLETENESS
8
$324,035
40
$288,863
0
$0
0
$0
0
$0
Aggregated Statistics For Year 2003 (Based on 2 full tracts)
A) FHA, FSA/RHS & VA Home Purchase Loans
B) Conventional Home Purchase Loans
C) Refinancings
D) Home Improvement Loans
F) Non-occupant Loans on < 5 Family Dwellings (A B C & D)
Number
Average Value
Number
Average Value
Number
Average Value
Number
Average Value
Number
Average Value
LOANS ORIGINATED
2
$152,665
259
$290,687
1,371
$232,939
16
$70,969
20
$201,056
APPLICATIONS APPROVED, NOT ACCEPTED
0
$0
30
$299,207
126
$224,299
14
$52,314
4
$109,758
APPLICATIONS DENIED
0
$0
20
$277,189
122
$266,004
0
$0
4
$250,448
APPLICATIONS WITHDRAWN
0
$0
36
$252,887
78
$233,050
4
$79,825
4
$224,005
FILES CLOSED FOR INCOMPLETENESS
2
$202,555
0
$0
26
$264,417
0
$0
0
$0
Aggregated Statistics For Year 2002 (Based on 2 full tracts)
A) FHA, FSA/RHS & VA Home Purchase Loans
B) Conventional Home Purchase Loans
C) Refinancings
D) Home Improvement Loans
F) Non-occupant Loans on < 5 Family Dwellings (A B C & D)
Number
Average Value
Number
Average Value
Number
Average Value
Number
Average Value
Number
Average Value
LOANS ORIGINATED
2
$193,575
239
$265,281
1,050
$217,083
38
$67,063
14
$182,740
APPLICATIONS APPROVED, NOT ACCEPTED
0
$0
30
$258,696
104
$225,215
44
$55,605
0
$0
APPLICATIONS DENIED
0
$0
10
$367,390
112
$203,872
8
$26,940
2
$39,910
APPLICATIONS WITHDRAWN
2
$191,580
20
$295,548
102
$223,077
4
$54,880
0
$0
FILES CLOSED FOR INCOMPLETENESS
0
$0
10
$194,771
20
$213,330
4
$82,818
2
$155,655
Aggregated Statistics For Year 2001 (Based on 2 full tracts)
B) Conventional Home Purchase Loans
C) Refinancings
D) Home Improvement Loans
F) Non-occupant Loans on < 5 Family Dwellings (A B C & D)
Number
Average Value
Number
Average Value
Number
Average Value
Number
Average Value
LOANS ORIGINATED
184
$274,070
629
$221,661
46
$49,933
6
$98,450
APPLICATIONS APPROVED, NOT ACCEPTED
24
$244,378
58
$210,192
14
$59,441
4
$254,938
APPLICATIONS DENIED
8
$408,849
68
$182,861
8
$34,175
0
$0
APPLICATIONS WITHDRAWN
14
$354,931
62
$225,438
12
$94,791
6
$118,738
FILES CLOSED FOR INCOMPLETENESS
14
$316,873
16
$227,249
0
$0
0
$0
Aggregated Statistics For Year 2000 (Based on 2 full tracts)
B) Conventional Home Purchase Loans
C) Refinancings
D) Home Improvement Loans
F) Non-occupant Loans on < 5 Family Dwellings (A B C & D)
Number
Average Value
Number
Average Value
Number
Average Value
Number
Average Value
LOANS ORIGINATED
227
$249,186
140
$163,226
32
$42,656
12
$117,408
APPLICATIONS APPROVED, NOT ACCEPTED
22
$251,355
22
$118,375
12
$26,608
0
$0
APPLICATIONS DENIED
20
$312,710
32
$110,693
8
$38,665
4
$79,825
APPLICATIONS WITHDRAWN
22
$239,563
36
$85,589
8
$140,191
4
$44,900
FILES CLOSED FOR INCOMPLETENESS
4
$294,850
10
$165,435
2
$69,845
0
$0
Aggregated Statistics For Year 1999 (Based on 1 full tract)
A) FHA, FSA/RHS & VA Home Purchase Loans
B) Conventional Home Purchase Loans
C) Refinancings
D) Home Improvement Loans
F) Non-occupant Loans on < 5 Family Dwellings (A B C & D)
Detailed PMIC statistics for the following Tracts:3231.00
2002 - 2018 National Fire Incident Reporting System (NFIRS) incidents
According to the data from the years 2002 - 2018 the average number of fire incidents per year is 18. The highest number of fire incidents - 32 took place in 2006, and the least - 1 in 2003. The data has an increasing trend.
When looking into fire subcategories, the most reports belonged to: Structure Fires (44.6%), and Outside Fires (40.3%).
Fire incident types reported to NFIRS in Zip Code 01775


+$4,211
-$2,642
 Nearest zip codes: 01749, 01754, 01719, 01752, 01740, 01451.


 According to the data from the years 2002 - 2018 the average number of fire incidents per year is 18. The highest number of fire incidents - 32 took place in 2006, and the least - 1 in 2003. The data has an increasing trend.
 When looking into fire subcategories, the most reports belonged to: Structure Fires (44.6%), and Outside Fires (40.3%).