Estimated zip code population in 2022: 5,884 Zip code population in 2010: 5,589 Zip code population in 2000: 5,558
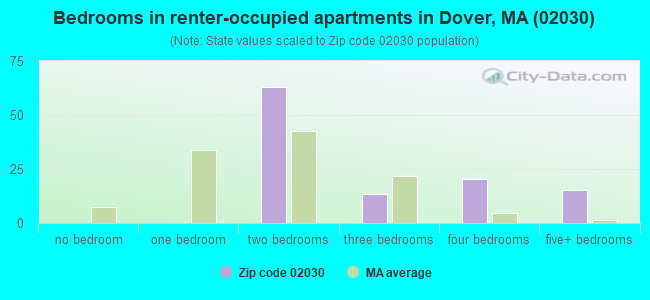
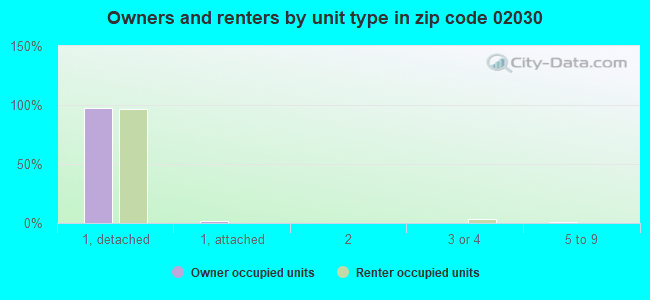
Houses and condos: 1,979 Renter-occupied apartments: 112
% of renters here:
6%
State:
38%
March 2022 cost of living index in zip code 02030: 136.0 (high, U.S. average is 100)
Land area: 15.1 sq. mi. Water area: 0.3 sq. mi.
Population density: 389 people per square mile
(very low).
OSM Map
Google Map
MSN Map
OSM Map
General Map
Google Map
MSN Map
OSM Map
Google Map
MSN Map
OSM Map
Google Map
MSN Map
Please wait while loading the map...
Real estate property taxes paid for housing units in 2022:
This zip code:
0.8% ($9,915)
Massachusetts:
1.0% ($5,536)
Median real estate property taxes paid for housing units with mortgages in 2022: $9,911 (0.7%) Median real estate property taxes paid for housing units with no mortgage in 2022: $9,925 (0.8%)
Business Search- 14 Million verified businesses
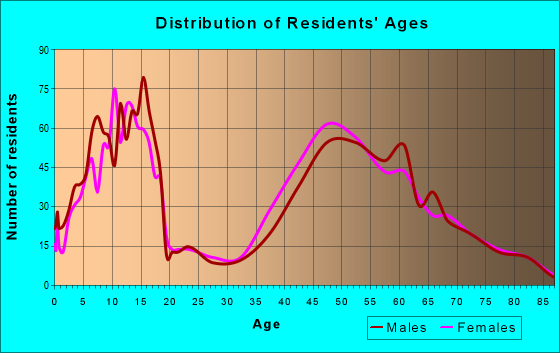
Males: 3,091
(52.5%)
Females: 2,793
(47.5%)
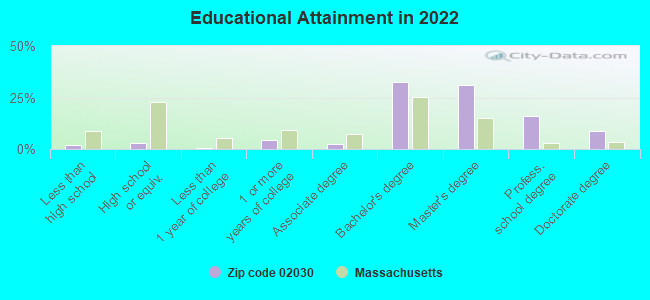
For population 25 years and over in 02030:
High school or higher: 99.2%
Bachelor's degree or higher: 89.0%
Graduate or professional degree: 56.1%
Unemployed: 7.3%
Mean travel time to work (commute): 37.8 minutes
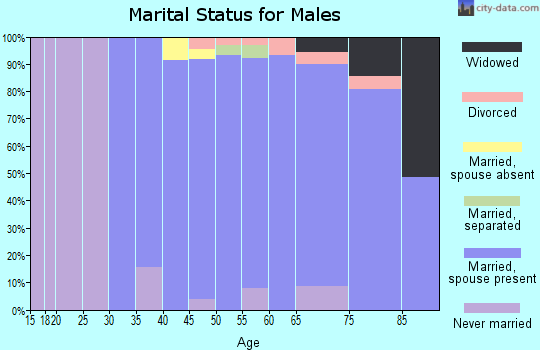
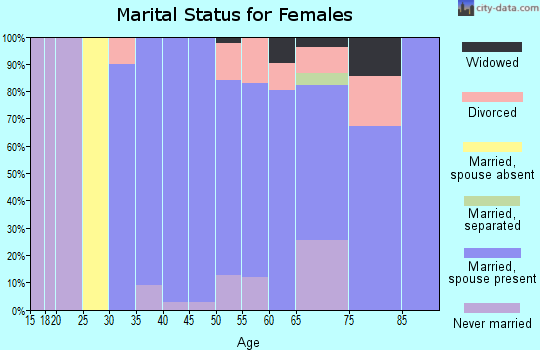
For population 15 years and over in 02030:
Never married: 26.1%
Now married: 65.7%
Separated: 0.2%
Widowed: 3.5%
Divorced: 4.5%
Zip code 02030 compared to state average:
Median household income significantly above state average.
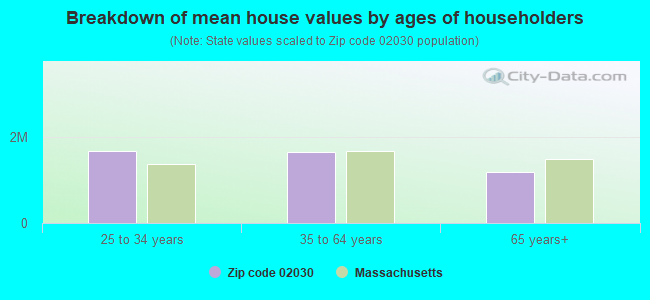
Median house value significantly above state average.
Unemployed percentage above state average.
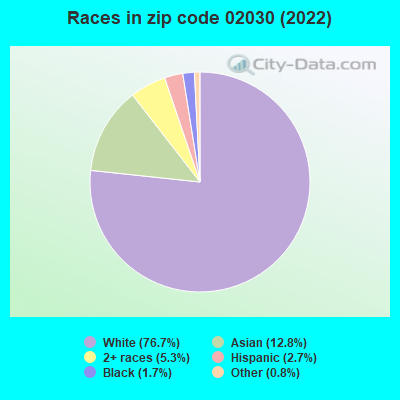
Black race population percentage significantly below state average.
Hispanic race population percentage significantly below state average.
Median age above state average.
Renting percentage significantly below state average.
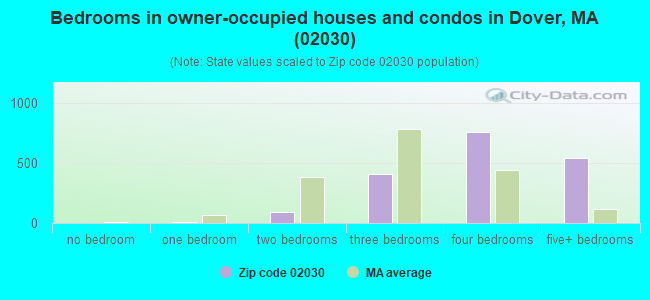
Number of rooms per house significantly above state average.
House age below state average.
Percentage of population with a bachelor's degree or higher above state average.
Estimated median house/condo value in 2022: $1,273,379
02030:
$1,273,379
Massachusetts:
$534,700
Median resident age:
This zip code:
46.8 years
Massachusetts median age:
40.3 years
Average household size:
This zip code:
3.1 people
Massachusetts:
2.4 people
Averages for the 2020 tax year for zip code 02030, filed in 2021:
Average Adjusted Gross Income (AGI) in 2020: $587,332 (Individual Income Tax Returns)
Here:
$587,332
State:
$105,130
Salary/wage: $331,317 (reported on 77.5% of returns)
Here:
$331,317
State:
$82,951
(% of AGI for various income ranges: 1376.1% for AGIs below $25k, 4118.2% for AGIs $25k-50k, 8994.0% for AGIs $50k-75k, 10347.5% for AGIs $75k-100k, 21830.7% for AGIs $100k-200k, 258147.7% for AGIs over 200k)
Taxable interest for individuals: $18,176 (reported on 67.3% of returns)
This zip code:
$18,176
Massachusetts:
$2,361
(% of AGI for various income ranges: 48.3% for AGIs below $25k, 185.5% for AGIs $25k-50k, 274.0% for AGIs $50k-75k, 306.2% for AGIs $75k-100k, 708.0% for AGIs $100k-200k, 12623.1% for AGIs over 200k)
Ordinary dividends: $44,287 (reported on 64.4% of returns)
Here:
$44,287
State:
$10,365
(% of AGI for various income ranges: 237.0% for AGIs below $25k, 554.5% for AGIs $25k-50k, 838.0% for AGIs $50k-75k, 1305.0% for AGIs $75k-100k, 2564.0% for AGIs $100k-200k, 28524.2% for AGIs over 200k)
Net capital gain/loss in AGI: +$298,044 (reported on 61.3% of returns)
Here:
+$298,044
State:
+$48,178
(% of AGI for various income ranges: 115.7% for AGIs below $25k, 866.4% for AGIs $25k-50k, 1397.0% for AGIs $50k-75k, 1111.2% for AGIs $75k-100k, 3082.7% for AGIs $100k-200k, 196333.8% for AGIs over 200k)
Profit/loss from business: +$73,165 (reported on 22.2% of returns)
Here:
+$73,165
State:
+$20,792
(% of AGI for various income ranges: 147.4% for AGIs below $25k, 241.8% for AGIs $25k-50k, 584.0% for AGIs $50k-75k, 530.0% for AGIs $75k-100k, 2366.7% for AGIs $100k-200k, 15742.7% for AGIs over 200k)
Taxable individual retirement arrangement distribution: $50,481 (reported on 12.7% of returns)
02030:
$50,481
Massachusetts:
$22,790
(% of AGI for various income ranges: 70.9% for AGIs below $25k, 317.3% for AGIs $25k-50k, 388.0% for AGIs $50k-75k, 1122.5% for AGIs $75k-100k, 1902.0% for AGIs $100k-200k, 5200.8% for AGIs over 200k)
Self-employed (Keogh) retirement plans: $39,076 (reported on 6.0% of returns)
02030:
$39,076
Massachusetts:
$26,868
(% of AGI for various income ranges: 577.5% for AGIs $75k-100k, 2377.3% for AGIs over 200k)
Total itemized deductions: $78,481 (reported on 39.1% of returns)
Here:
$78,481
State:
$36,722
(% of AGI for various income ranges: 377.4% for AGIs below $25k, 620.9% for AGIs $25k-50k, 1260.0% for AGIs $50k-75k, 1733.7% for AGIs $75k-100k, 3666.0% for AGIs $100k-200k, 29775.8% for AGIs over 200k)
Charity contributions: $46,241 (reported on 34.5% of returns)
Here:
$46,241
State:
$12,529
(% of AGI for various income ranges: 30.4% for AGIs below $25k, 141.0% for AGIs $50k-75k, 293.8% for AGIs $75k-100k, 581.3% for AGIs $100k-200k, 16922.3% for AGIs over 200k)
Taxes paid: $10,151 (reported on 39.1% of returns)
02030:
$10,151
State:
$8,782
(% of AGI for various income ranges: 80.9% for AGIs below $25k, 163.6% for AGIs $25k-50k, 292.0% for AGIs $50k-75k, 546.2% for AGIs $75k-100k, 964.0% for AGIs $100k-200k, 3356.5% for AGIs over 200k)
Earned income credit: $900 (reported on 1.8% of returns)
Here:
$900
State:
$1,909
(% of AGI for various income ranges: 19.6% for AGIs below $25k)
Percentage of individuals using paid preparers for their 2020 taxes: 92.3%
Here:
92%
State:
92%
(% for various income ranges: 90.0% for AGIs below $25k, 95.0% for AGIs $25k-50k, 90.5% for AGIs $50k-75k, 88.2% for AGIs $75k-100k, 92.5% for AGIs $100k-200k, 93.7% for AGIs over 200k)
Averages for the 2012 tax year for zip code 02030, filed in 2013:
Average Adjusted Gross Income (AGI) in 2012: $484,807 (Individual Income Tax Returns)
Here:
$484,807
State:
$81,425
Salary/wage: $242,346 (reported on 76.3% of returns)
Here:
$242,346
State:
$64,752
(% of AGI for various income ranges: 57.3% for AGIs below $25k, 58.4% for AGIs $25k-50k, 50.7% for AGIs $50k-75k, 52.8% for AGIs $75k-100k, 58.4% for AGIs $100k-200k, 36.6% for AGIs over 200k)
Taxable interest for individuals: $24,383 (reported on 70.7% of returns)
This zip code:
$24,383
Massachusetts:
$2,136
(% of AGI for various income ranges: 4.3% for AGIs below $25k, 3.0% for AGIs $25k-50k, 2.8% for AGIs $50k-75k, 1.8% for AGIs $75k-100k, 1.8% for AGIs $100k-200k, 3.7% for AGIs over 200k)
Ordinary dividends: $64,055 (reported on 63.5% of returns)
Here:
$64,055
State:
$9,473
(% of AGI for various income ranges: 14.6% for AGIs below $25k, 6.9% for AGIs $25k-50k, 7.9% for AGIs $50k-75k, 5.9% for AGIs $75k-100k, 6.8% for AGIs $100k-200k, 8.5% for AGIs over 200k)
Net capital gain/loss in AGI: +$197,384 (reported on 58.6% of returns)
Here:
+$197,384
State:
+$31,437
(% of AGI for various income ranges: 2.2% for AGIs below $25k, 3.1% for AGIs $25k-50k, 3.4% for AGIs $50k-75k, 0.4% for AGIs $75k-100k, 3.6% for AGIs $100k-200k, 25.7% for AGIs over 200k)
Profit/loss from business: +$55,807 (reported on 25.2% of returns)
Here:
+$55,807
State:
+$20,662
(% of AGI for various income ranges: 11.4% for AGIs below $25k, 6.1% for AGIs $25k-50k, 4.2% for AGIs $50k-75k, 8.3% for AGIs $75k-100k, 10.7% for AGIs $100k-200k, 2.3% for AGIs over 200k)
Taxable individual retirement arrangement distribution: $67,300 (reported on 16.5% of returns)
02030:
$67,300
Massachusetts:
$18,892
(% of AGI for various income ranges: 3.4% for AGIs below $25k, 6.5% for AGIs $25k-50k, 5.2% for AGIs $50k-75k, 5.5% for AGIs $75k-100k, 4.8% for AGIs $100k-200k, 2.1% for AGIs over 200k)
Self-employment retirement plans: $34,044 (reported on 6.0% of returns)
02030:
$34,044
Massachusetts:
$20,669
Total itemized deductions: $111,815 (16% of AGI, reported on 69.5% of returns)
Here:
$111,815
State:
$28,907
Here:
16.3% of AGI
State:
18.2% of AGI
(% of AGI for various income ranges: 39.3% for AGIs below $25k, 28.0% for AGIs $25k-50k, 21.8% for AGIs $50k-75k, 25.1% for AGIs $75k-100k, 25.0% for AGIs $100k-200k, 15.2% for AGIs over 200k)
Charity contributions: $22,050 (reported on 62.0% of returns)
Here:
$22,050
State:
$4,208
(% of AGI for various income ranges: 1.4% for AGIs below $25k, 1.5% for AGIs $25k-50k, 1.9% for AGIs $50k-75k, 1.8% for AGIs $75k-100k, 2.1% for AGIs $100k-200k, 2.9% for AGIs over 200k)
Taxes paid: $53,180 (reported on 69.5% of returns)
02030:
$53,180
State:
$13,303
(% of AGI for various income ranges: 12.8% for AGIs below $25k, 10.5% for AGIs $25k-50k, 9.8% for AGIs $50k-75k, 12.3% for AGIs $75k-100k, 12.0% for AGIs $100k-200k, 7.3% for AGIs over 200k)
Earned income credit: $1,357 (reported on 2.6% of returns)
Here:
$1,357
State:
$1,971
(% of AGI for various income ranges: 1.7% for AGIs below $25k)
Percentage of individuals using paid preparers for their 2012 taxes: 69.9%
Here:
70%
State:
56%
(% for various income ranges: 61.2% for AGIs below $25k, 57.1% for AGIs $25k-50k, 61.1% for AGIs $50k-75k, 68.8% for AGIs $75k-100k, 69.8% for AGIs $100k-200k, 80.2% for AGIs over 200k)
Averages for the 2004 tax year for zip code 02030, filed in 2005:
Average Adjusted Gross Income (AGI) in 2004: $293,204 (Individual Income Tax Returns)
Here:
$293,204
State:
$62,877
Salary/wage: $206,045 (reported on 72.7% of returns)
Here:
$206,045
State:
$52,969
(% of AGI for various income ranges: 50.3% for AGIs $10k-25k, 58.0% for AGIs $25k-50k, 58.8% for AGIs $50k-75k, 54.8% for AGIs $75k-100k, 50.1% for AGIs over 100k)
Taxable interest for individuals: $7,923 (reported on 78.5% of returns)
This zip code:
$7,923
Massachusetts:
$1,945
(% of AGI for various income ranges: 8.6% for AGIs $10k-25k, 3.3% for AGIs $25k-50k, 3.5% for AGIs $50k-75k, 3.2% for AGIs $75k-100k, 2.0% for AGIs over 100k)
Taxable dividends: $21,827 (reported on 71.4% of returns)
Here:
$21,827
State:
$5,323
(% of AGI for various income ranges: 10.8% for AGIs $10k-25k, 6.6% for AGIs $25k-50k, 7.1% for AGIs $50k-75k, 8.0% for AGIs $75k-100k, 5.1% for AGIs over 100k)
Net capital gain/loss: +$112,122 (reported on 64.6% of returns)
Here:
+$112,122
State:
+$20,377
(% of AGI for various income ranges: 3.1% for AGIs $10k-25k, 4.1% for AGIs $25k-50k, 2.3% for AGIs $50k-75k, 6.0% for AGIs $75k-100k, 25.3% for AGIs over 100k)
Profit/loss from business: +$40,120 (reported on 24.8% of returns)
Here:
+$40,120
State:
+$17,837
(% of AGI for various income ranges: 5.6% for AGIs $10k-25k, 9.2% for AGIs $25k-50k, 6.2% for AGIs $50k-75k, 10.8% for AGIs $75k-100k, 3.1% for AGIs over 100k)
IRA payment deduction: $4,121 (reported on 3.7% of returns)
02030:
$4,121
Massachusetts:
$3,100
Self-employed pension: $20,956 (reported on 7.7% of returns)
Here:
$20,956
Massachusetts:
$14,516
Total itemized deductions: $61,852 (14% of AGI, reported on 64.4% of returns)
Here:
$61,852
State:
$22,573
Here:
13.8% of AGI
State:
19.5% of AGI
(% of AGI for various income ranges: 32.0% for AGIs $10k-25k, 29.0% for AGIs $25k-50k, 25.1% for AGIs $50k-75k, 27.2% for AGIs $75k-100k, 12.7% for AGIs over 100k)
Charity contributions deductions: $16,686 (4% of AGI, reported on 60.7% of returns)
Here:
$16,686
State:
$3,295
Here:
3.6% of AGI
State:
2.7% of AGI
(% of AGI for various income ranges: 1.8% for AGIs $10k-25k, 2.2% for AGIs $25k-50k, 1.9% for AGIs $50k-75k, 2.8% for AGIs $75k-100k, 3.5% for AGIs over 100k)
Total tax: $79,607 (reported on 81.6% of returns)
02030:
$79,607
State:
$11,494
(% of AGI for various income ranges: 4.7% for AGIs $10k-25k, 8.3% for AGIs $25k-50k, 9.8% for AGIs $50k-75k, 10.3% for AGIs $75k-100k, 22.7% for AGIs over 100k)
Earned income credit: $778 (reported on 1.4% of returns)
Here:
$778
State:
$1,518
Percentage of individuals using paid preparers for their 2004 taxes: 70.6%
Here:
71%
State:
58%
(% for various income ranges: 67.7% for AGIs below $10k, 59.0% for AGIs $10k-25k, 64.6% for AGIs $25k-50k, 60.3% for AGIs $50k-75k, 70.8% for AGIs $75k-100k, 77.0% for AGIs over 100k)
Household received Food Stamps/SNAP in the past 12 months: 12 Household did not receive Food Stamps/SNAP in the past 12 months: 1,860
Women who had a birth in the past 12 months: 33 (34 now married, 0 unmarried) Women who did not have a birth in the past 12 months: 1,037 (556 now married, 470 unmarried)
Housing units in zip code 02030 with a mortgage: 1,154 (230 second mortgage, 7 home equity loan, 221 both second mortgage and home equity loan) Houses without a mortgage: 14
Median monthly owner costs for units with a mortgage: $3,900 Median monthly owner costs for units without a mortgage: $1,507
Residents with income below the poverty level in 2022:
This zip code:
1.6%
Whole state:
10.4%
Residents with income below 50% of the poverty level in 2022:
This zip code:
1.1%
Whole state:
5.1%
Median number of rooms in houses and condos:
Here:
10.0
State:
6.5
Median number of rooms in apartments:
Here:
5.3
State:
4.0
Notable locations in this zip code not listed on our city pages
Notable locations in zip code 02030: Dover Fire Department (A), Dover-Sherborn High School Library (B), Dover Town Library (C). Display/hide their locations on the map
Churches in zip code 02030 include: Saint Dunstans Episcopal Church (A), Dover Church (B), Saint Stephens Priory (C), Church of the Most Precious Blood (D). Display/hide their locations on the map
Size of family households: 519 2-persons, 390 3-persons, 478 4-persons, 206 5-persons, 40 6-persons
Size of nonfamily households: 202 1-person, 60 2-persons
1,372 married couples with children.
90 single-parent households (47 men, 43 women).
82.9% of residents of 02030 zip code speak English at home.
1.3% of residents speak Spanish at home (38% very well, 62% well).
8.2% of residents speak other Indo-European language at home (87% very well, 10% well, 2% not well).
6.8% of residents speak Asian or Pacific Island language at home (86% very well, 2% well, 7% not well, 5% not at all).
0.8% of residents speak other language at home (100% well).
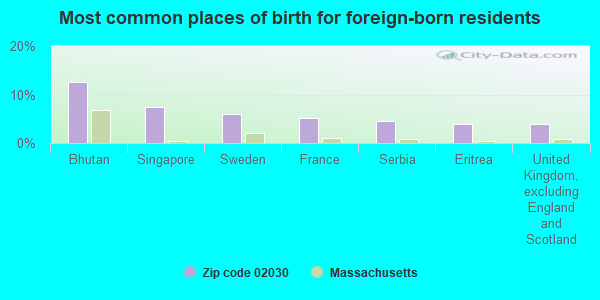
Foreign born population: 927 (15.8%) (79.9% of them are naturalized citizens)
This zip code:
15.8%
Whole state:
18.0%
13%Bhutan
7%Singapore
6%Sweden
5%France
4%Serbia
4%Eritrea
4%United Kingdom, excluding England and Scotland
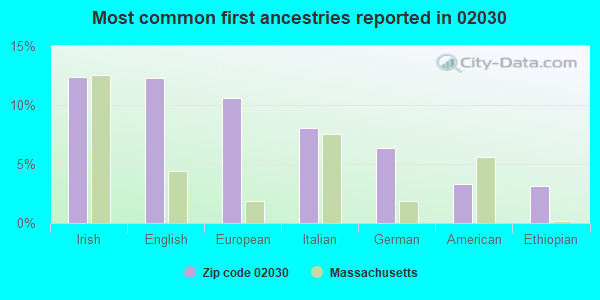
12%Irish
12%English
11%European
8%Italian
6%German
3%American
3%Ethiopian
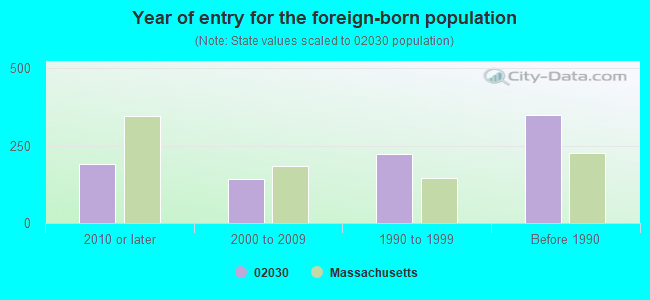
Year of entry for the foreign-born population
1902010 or later
1432000 to 2009
2221990 to 1999
349Before 1990
Facilities with environmental interests located in this zip code:
DOVER SHERBORN HS (9 JUNCTION STREET in DOVER, MA)
AIR MINOR (AIRS/AFS) (National Center for Education Statistics) - STATE ID-655505 Business SIC classification: ELEMENTARY AND SECONDARY SCHOOLS Organizations: DOVER-SHERBORN (SCHOOL DISTRICT)
Alternative names: DOVER-SHERBORN REG HIGH
DOVER AUTOMOTIVE (4 WHITING ROAD in DOVER, MA)
(Resource Conservation and Recovery Act (tracking hazardous waste)) Conditionally Exempt Small Quantity Generators, less than 100 kg/month of hazardous waste (Resource Conservation and Recovery Act (tracking hazardous waste)) - notification Business NAICS classification: GENERAL AUTOMOTIVE REPAIR.; ALL OTHER AUTOMOTIVE REPAIR AND MAINTENANCE. Organizations: DOVER AUTOMOTIVE SERVICE (CONTACT/OPERATOR)
, DAVID H TREADWELL ESTATE (CONTACT/OWNER)
, J DOUGLAS WOLFE (CONTACT/OWNER)
Alternative names: DAVID H TREADWELL ESTATE, DOVER AUTOMOTIVE SERVICE, TREADWELL DAVID H ESTATE
DOVER-SHERBORN REG JR H S (155 FARM STREET in DOVER, MA)
(National Center for Education Statistics) - STATE ID-655405
DOVER (TOWN OF DOVER in DOVER, MA)
AIR MINOR (AIRS/AFS) Business SIC classification: GENERAL GOVERNMENT
DOVER GARAGE (7 WHITING RD in DOVER, MA)
(Resource Conservation and Recovery Act (tracking hazardous waste))
LUTTAZI SE & SONS (SPRINGDALE AVE in DOVER, MA)
Conditionally Exempt Small Quantity Generators, less than 100 kg/month of hazardous waste (Resource Conservation and Recovery Act (tracking hazardous waste)) - notification Organizations: S ERNEST LUTTAZI (CONTACT/OWNER)
Alternative names: LUTTAZI S E & SONS INC
DOVER WESTWOOD LANDFILL (55 POWISSET ST in DOVER, MA)
CRITERIA AND HAZARDOUS AIR POLLUTANT INVENTORY (Inventory of air pollution sources) Business SIC classification: REFUSE SYSTEMS Business NAICS classification: SOLID WASTE LANDFILL.
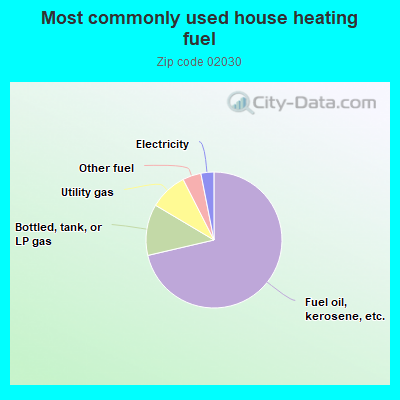
71.5%Fuel oil, kerosene, etc.
12.2%Bottled, tank, or LP gas
9.0%Utility gas
4.4%Other fuel
3.1%Electricity
Population in 1990: 4,915. Population change in the 1990s: +643 (+13.1%).
Place of birth for U.S.-born residents:
This state: 3,407
Northeast: 763
Midwest: 270
South: 303
West: 213
69% of the 02030 zip code residents lived in the same house 5 years ago. Out of people who lived in different houses, 56% lived in this county. Out of people who lived in different counties, 50% lived in Massachusetts.
93% of the 02030 zip code residents lived in the same house 1 year ago. Out of people who lived in different houses, 39% moved from this county. Out of people who lived in different houses, 55% moved from different county within same state. Out of people who lived in different houses, 2% moved from different state. Out of people who lived in different houses, 5% moved from abroad.
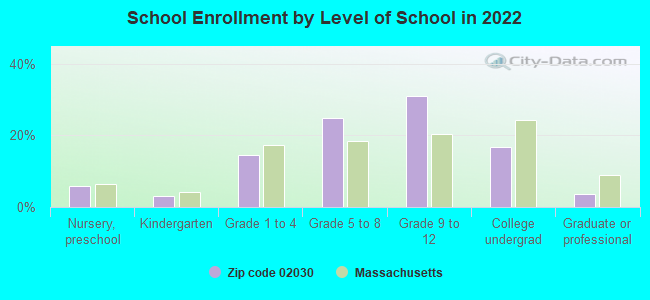
Private vs. public school enrollment:
Students in private schools in grades 1 to 8 (elementary and middle school): 56
Here:
8.8%
Massachusetts:
10.3%
Students in private schools in grades 9 to 12 (high school): 72
Here:
14.3%
Massachusetts:
12.3%
Students in private undergraduate colleges: 205
Here:
72.9%
Massachusetts:
51.2%
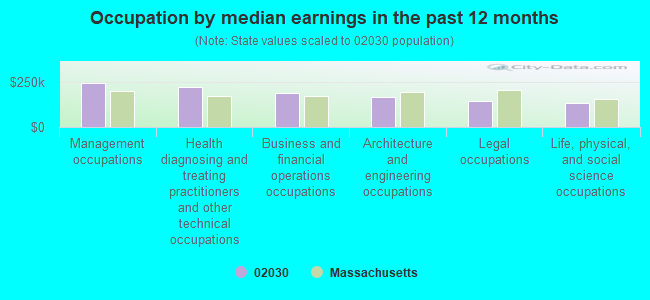
Occupation by median earnings in the past 12 months ($)
246,431Management occupations
222,987Health diagnosing and treating practitioners and other technical occupations
190,425Business and financial operations occupations
169,986Architecture and engineering occupations
146,629Legal occupations
133,787Life, physical, and social science occupations
Top industries in this zip code by the number of employees in 2005:
Educational Services: Elementary and Secondary Schools (50-99 employees: 1 establishment)
Professional, Scientific, and Technical Services: Human Resources and Executive Search Consulting Services (20-49: 1, 1-4: 1)
Administrative and Support and Waste Management and Remediation Services: Landscaping Services (5-9: 1, 1-4: 5)
Construction: Site Preparation Contractors (10-19: 1, 1-4: 1)
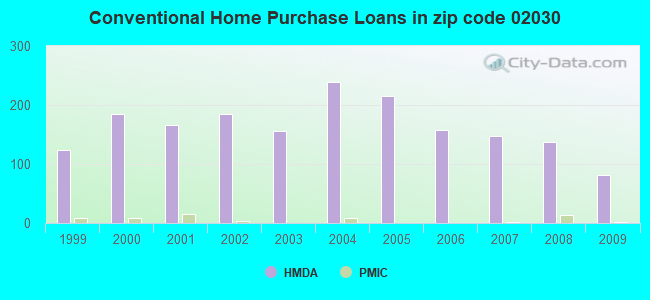
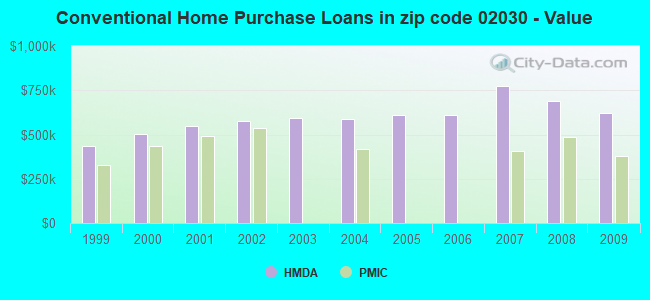
Detailed PMIC statistics for the following Tracts:4051.00
2002 - 2018 National Fire Incident Reporting System (NFIRS) incidents
According to the data from the years 2002 - 2018 the average number of fires per year is 17. The highest number of reported fires - 46 took place in 2011, and the least - 4 in 2002. The data has an increasing trend.
When looking into fire subcategories, the most incidents belonged to: Structure Fires (67.3%), and Outside Fires (26.6%).
Fire incident types reported to NFIRS in Zip Code 02030


 Nearest zip codes: 02052, 02482, 02492, 02457, 02090, 02481.
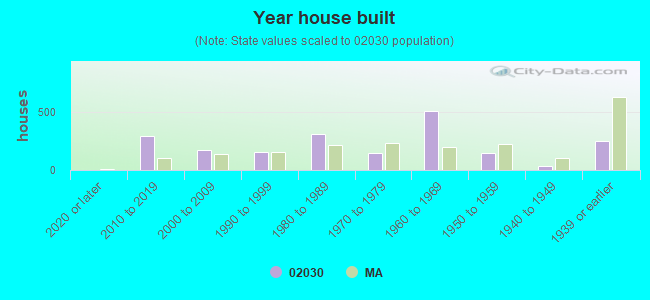


 According to the data from the years 2002 - 2018 the average number of fires per year is 17. The highest number of reported fires - 46 took place in 2011, and the least - 4 in 2002. The data has an increasing trend.
 When looking into fire subcategories, the most incidents belonged to: Structure Fires (67.3%), and Outside Fires (26.6%).