Estimated zip code population in 2022: 12,197 Zip code population in 2010: 12,564 Zip code population in 2000: 12,504
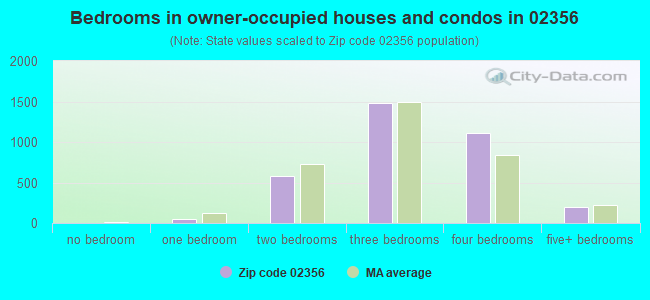
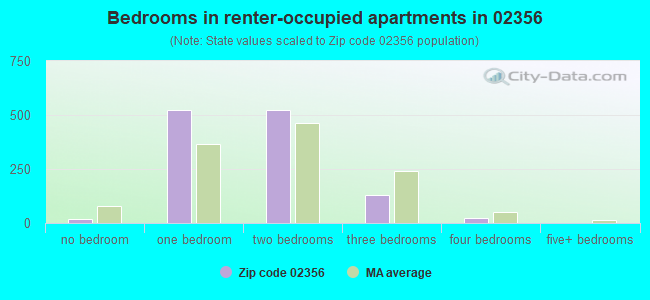
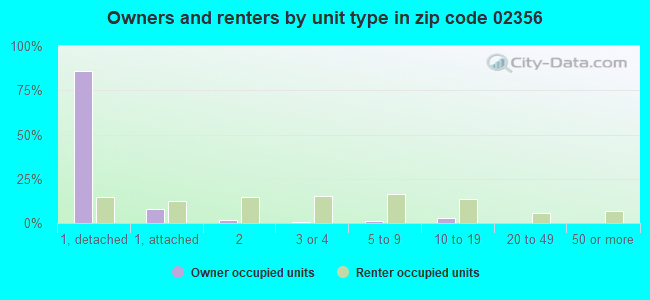
Houses and condos: 4,716 Renter-occupied apartments: 1,220
% of renters here:
26%
State:
38%
March 2022 cost of living index in zip code 02356: 132.7 (high, U.S. average is 100)
Land area: 13.7 sq. mi. Water area: 0.3 sq. mi.
Population density: 890 people per square mile
(low).
OSM Map
Google Map
MSN Map
OSM Map
General Map
Google Map
MSN Map
OSM Map
Google Map
MSN Map
OSM Map
Google Map
MSN Map
Please wait while loading the map...
Real estate property taxes paid for housing units in 2022:
This zip code:
1.1% ($6,918)
Massachusetts:
1.0% ($5,536)
Median real estate property taxes paid for housing units with mortgages in 2022: $7,426 (1.1%) Median real estate property taxes paid for housing units with no mortgage in 2022: $6,500 (1.2%)
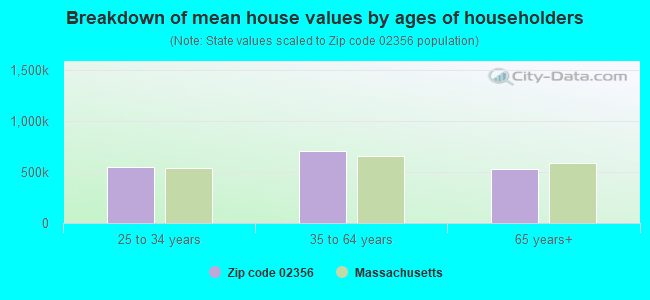
Estimated median house/condo value in 2022: $639,231
02356:
$639,231
Massachusetts:
$534,700
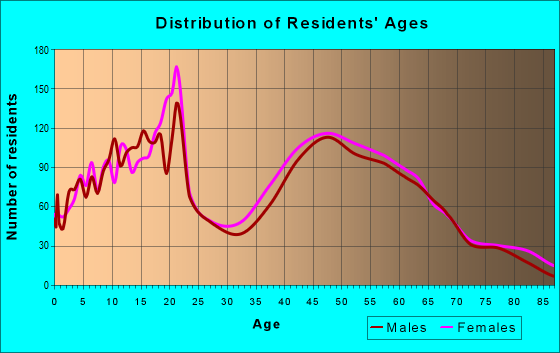
Median resident age:
This zip code:
46.6 years
Massachusetts median age:
40.3 years
Average household size:
This zip code:
2.5 people
Massachusetts:
2.4 people
Averages for the 2020 tax year for zip code 02356, filed in 2021:
Average Adjusted Gross Income (AGI) in 2020: $144,913 (Individual Income Tax Returns)
Here:
$144,913
State:
$105,130
Salary/wage: $113,217 (reported on 82.5% of returns)
Here:
$113,217
State:
$82,951
(% of AGI for various income ranges: 1137.1% for AGIs below $25k, 3602.6% for AGIs $25k-50k, 6362.1% for AGIs $50k-75k, 9019.7% for AGIs $75k-100k, 20574.7% for AGIs $100k-200k, 105750.0% for AGIs over 200k)
Taxable interest for individuals: $2,950 (reported on 49.0% of returns)
This zip code:
$2,950
Massachusetts:
$2,361
(% of AGI for various income ranges: 33.5% for AGIs below $25k, 53.1% for AGIs $25k-50k, 72.5% for AGIs $50k-75k, 100.8% for AGIs $75k-100k, 171.4% for AGIs $100k-200k, 2005.8% for AGIs over 200k)
Ordinary dividends: $8,132 (reported on 33.6% of returns)
Here:
$8,132
State:
$10,365
(% of AGI for various income ranges: 38.6% for AGIs below $25k, 94.9% for AGIs $25k-50k, 139.0% for AGIs $50k-75k, 198.4% for AGIs $75k-100k, 398.2% for AGIs $100k-200k, 3701.5% for AGIs over 200k)
Net capital gain/loss in AGI: +$36,618 (reported on 29.3% of returns)
Here:
+$36,618
State:
+$48,178
(% of AGI for various income ranges: 41.6% for AGIs below $25k, 88.0% for AGIs $25k-50k, 93.5% for AGIs $50k-75k, 240.0% for AGIs $75k-100k, 717.5% for AGIs $100k-200k, 18487.6% for AGIs over 200k)
Profit/loss from business: +$26,400 (reported on 16.4% of returns)
Here:
+$26,400
State:
+$20,792
(% of AGI for various income ranges: 118.4% for AGIs below $25k, 207.8% for AGIs $25k-50k, 221.3% for AGIs $50k-75k, 505.7% for AGIs $75k-100k, 910.0% for AGIs $100k-200k, 4784.5% for AGIs over 200k)
Taxable individual retirement arrangement distribution: $21,733 (reported on 11.7% of returns)
02356:
$21,733
Massachusetts:
$22,790
(% of AGI for various income ranges: 91.5% for AGIs below $25k, 194.8% for AGIs $25k-50k, 339.8% for AGIs $50k-75k, 565.7% for AGIs $75k-100k, 857.2% for AGIs $100k-200k, 1280.0% for AGIs over 200k)
Self-employed (Keogh) retirement plans: $30,345 (reported on 1.7% of returns)
02356:
$30,345
Massachusetts:
$26,868
(% of AGI for various income ranges: 88.1% for AGIs $75k-100k, 912.7% for AGIs over 200k)
Total itemized deductions: $33,969 (reported on 18.8% of returns)
Here:
$33,969
State:
$36,722
(% of AGI for various income ranges: 151.9% for AGIs below $25k, 234.5% for AGIs $25k-50k, 516.3% for AGIs $50k-75k, 824.3% for AGIs $75k-100k, 1488.8% for AGIs $100k-200k, 6513.3% for AGIs over 200k)
Charity contributions: $7,656 (reported on 16.0% of returns)
Here:
$7,656
State:
$12,529
(% of AGI for various income ranges: 6.0% for AGIs below $25k, 28.2% for AGIs $25k-50k, 41.5% for AGIs $50k-75k, 94.6% for AGIs $75k-100k, 172.5% for AGIs $100k-200k, 1747.6% for AGIs over 200k)
Taxes paid: $9,356 (reported on 18.8% of returns)
02356:
$9,356
State:
$8,782
(% of AGI for various income ranges: 28.2% for AGIs below $25k, 78.2% for AGIs $25k-50k, 153.3% for AGIs $50k-75k, 250.0% for AGIs $75k-100k, 506.5% for AGIs $100k-200k, 1548.5% for AGIs over 200k)
Earned income credit: $1,390 (reported on 4.7% of returns)
Here:
$1,390
State:
$1,909
(% of AGI for various income ranges: 25.8% for AGIs below $25k, 30.5% for AGIs $25k-50k)
Percentage of individuals using paid preparers for their 2020 taxes: 93.3%
Here:
93%
State:
92%
(% for various income ranges: 91.0% for AGIs below $25k, 93.5% for AGIs $25k-50k, 92.2% for AGIs $50k-75k, 93.1% for AGIs $75k-100k, 94.9% for AGIs $100k-200k, 94.9% for AGIs over 200k)
Averages for the 2012 tax year for zip code 02356, filed in 2013:
Average Adjusted Gross Income (AGI) in 2012: $108,320 (Individual Income Tax Returns)
Here:
$108,320
State:
$81,425
Salary/wage: $91,209 (reported on 85.4% of returns)
Here:
$91,209
State:
$64,752
(% of AGI for various income ranges: 72.1% for AGIs below $25k, 74.1% for AGIs $25k-50k, 70.2% for AGIs $50k-75k, 70.3% for AGIs $75k-100k, 82.3% for AGIs $100k-200k, 66.0% for AGIs over 200k)
Taxable interest for individuals: $2,334 (reported on 53.6% of returns)
This zip code:
$2,334
Massachusetts:
$2,136
(% of AGI for various income ranges: 2.1% for AGIs below $25k, 1.0% for AGIs $25k-50k, 0.8% for AGIs $50k-75k, 0.8% for AGIs $75k-100k, 0.6% for AGIs $100k-200k, 1.5% for AGIs over 200k)
Ordinary dividends: $5,451 (reported on 32.5% of returns)
Here:
$5,451
State:
$9,473
(% of AGI for various income ranges: 1.9% for AGIs below $25k, 1.5% for AGIs $25k-50k, 1.3% for AGIs $50k-75k, 1.3% for AGIs $75k-100k, 1.1% for AGIs $100k-200k, 2.1% for AGIs over 200k)
Net capital gain/loss in AGI: +$20,853 (reported on 25.6% of returns)
Here:
+$20,853
State:
+$31,437
(% of AGI for various income ranges: 0.1% for AGIs below $25k, 0.4% for AGIs $50k-75k, 0.7% for AGIs $75k-100k, 0.7% for AGIs $100k-200k, 9.6% for AGIs over 200k)
Profit/loss from business: +$24,757 (reported on 17.7% of returns)
Here:
+$24,757
State:
+$20,662
(% of AGI for various income ranges: 8.2% for AGIs below $25k, 5.9% for AGIs $25k-50k, 4.5% for AGIs $50k-75k, 4.2% for AGIs $75k-100k, 4.4% for AGIs $100k-200k, 3.3% for AGIs over 200k)
Taxable individual retirement arrangement distribution: $17,727 (reported on 12.5% of returns)
02356:
$17,727
Massachusetts:
$18,892
(% of AGI for various income ranges: 5.0% for AGIs below $25k, 3.1% for AGIs $25k-50k, 3.4% for AGIs $50k-75k, 4.3% for AGIs $75k-100k, 1.9% for AGIs $100k-200k, 1.3% for AGIs over 200k)
Self-employment retirement plans: $19,246 (reported on 2.2% of returns)
02356:
$19,246
Massachusetts:
$20,669
Total itemized deductions: $30,803 (18% of AGI, reported on 54.1% of returns)
Here:
$30,803
State:
$28,907
Here:
17.6% of AGI
State:
18.2% of AGI
(% of AGI for various income ranges: 18.6% for AGIs below $25k, 12.7% for AGIs $25k-50k, 17.8% for AGIs $50k-75k, 20.1% for AGIs $75k-100k, 18.5% for AGIs $100k-200k, 12.6% for AGIs over 200k)
Charity contributions: $3,140 (reported on 47.3% of returns)
Here:
$3,140
State:
$4,208
(% of AGI for various income ranges: 0.8% for AGIs below $25k, 0.8% for AGIs $25k-50k, 1.6% for AGIs $50k-75k, 1.5% for AGIs $75k-100k, 1.3% for AGIs $100k-200k, 1.4% for AGIs over 200k)
Taxes paid: $15,586 (reported on 54.0% of returns)
02356:
$15,586
State:
$13,303
(% of AGI for various income ranges: 5.7% for AGIs below $25k, 4.7% for AGIs $25k-50k, 7.4% for AGIs $50k-75k, 8.6% for AGIs $75k-100k, 8.7% for AGIs $100k-200k, 7.5% for AGIs over 200k)
Earned income credit: $1,553 (reported on 6.5% of returns)
Here:
$1,553
State:
$1,971
(% of AGI for various income ranges: 2.8% for AGIs below $25k, 0.4% for AGIs $25k-50k)
Percentage of individuals using paid preparers for their 2012 taxes: 58.9%
Here:
59%
State:
56%
(% for various income ranges: 50.0% for AGIs below $25k, 53.4% for AGIs $25k-50k, 59.7% for AGIs $50k-75k, 67.3% for AGIs $75k-100k, 62.3% for AGIs $100k-200k, 74.6% for AGIs over 200k)
Averages for the 2004 tax year for zip code 02356, filed in 2005:
Average Adjusted Gross Income (AGI) in 2004: $83,784 (Individual Income Tax Returns)
Here:
$83,784
State:
$62,877
Salary/wage: $72,746 (reported on 87.0% of returns)
Here:
$72,746
State:
$52,969
(% of AGI for various income ranges: 194.7% for AGIs below $10k, 68.5% for AGIs $10k-25k, 79.7% for AGIs $25k-50k, 79.2% for AGIs $50k-75k, 83.5% for AGIs $75k-100k, 72.4% for AGIs over 100k)
Taxable interest for individuals: $2,266 (reported on 69.4% of returns)
This zip code:
$2,266
Massachusetts:
$1,945
(% of AGI for various income ranges: 13.9% for AGIs below $10k, 3.0% for AGIs $10k-25k, 1.7% for AGIs $25k-50k, 1.8% for AGIs $50k-75k, 1.2% for AGIs $75k-100k, 1.9% for AGIs over 100k)
Taxable dividends: $3,369 (reported on 39.8% of returns)
Here:
$3,369
State:
$5,323
(% of AGI for various income ranges: 8.8% for AGIs below $10k, 1.9% for AGIs $10k-25k, 0.9% for AGIs $25k-50k, 0.9% for AGIs $50k-75k, 0.8% for AGIs $75k-100k, 1.9% for AGIs over 100k)
Net capital gain/loss: +$8,109 (reported on 33.0% of returns)
Here:
+$8,109
State:
+$20,377
(% of AGI for various income ranges: -7.5% for AGIs below $10k, 0.3% for AGIs $10k-25k, 0.8% for AGIs $25k-50k, 0.7% for AGIs $50k-75k, 0.9% for AGIs $75k-100k, 4.5% for AGIs over 100k)
Profit/loss from business: +$27,058 (reported on 17.9% of returns)
Here:
+$27,058
State:
+$17,837
(% of AGI for various income ranges: 19.1% for AGIs below $10k, 8.9% for AGIs $10k-25k, 5.2% for AGIs $25k-50k, 6.5% for AGIs $50k-75k, 4.6% for AGIs $75k-100k, 5.8% for AGIs over 100k)
IRA payment deduction: $3,589 (reported on 3.6% of returns)
02356:
$3,589
Massachusetts:
$3,100
(% of AGI for various income ranges: 0.4% for AGIs $10k-25k, 0.3% for AGIs $25k-50k, 0.3% for AGIs $50k-75k, 0.2% for AGIs $75k-100k, 0.1% for AGIs over 100k)
Self-employed pension: $13,289 (reported on 2.8% of returns)
Here:
$13,289
Massachusetts:
$14,516
(% of AGI for various income ranges: 0.4% for AGIs $50k-75k, 0.2% for AGIs $75k-100k, 0.6% for AGIs over 100k)
Total itemized deductions: $24,525 (18% of AGI, reported on 54.8% of returns)
Here:
$24,525
State:
$22,573
Here:
18.4% of AGI
State:
19.5% of AGI
(% of AGI for various income ranges: 24.8% for AGIs below $10k, 17.8% for AGIs $10k-25k, 17.0% for AGIs $25k-50k, 20.6% for AGIs $50k-75k, 20.5% for AGIs $75k-100k, 14.3% for AGIs over 100k)
Charity contributions deductions: $3,029 (2% of AGI, reported on 51.8% of returns)
Here:
$3,029
State:
$3,295
Here:
2.2% of AGI
State:
2.7% of AGI
(% of AGI for various income ranges: 1.7% for AGIs below $10k, 1.5% for AGIs $10k-25k, 1.5% for AGIs $25k-50k, 2.0% for AGIs $50k-75k, 2.1% for AGIs $75k-100k, 1.9% for AGIs over 100k)
Total tax: $16,623 (reported on 83.8% of returns)
02356:
$16,623
State:
$11,494
(% of AGI for various income ranges: 5.6% for AGIs below $10k, 5.9% for AGIs $10k-25k, 8.2% for AGIs $25k-50k, 9.8% for AGIs $50k-75k, 10.0% for AGIs $75k-100k, 20.4% for AGIs over 100k)
Earned income credit: $1,203 (reported on 4.0% of returns)
Here:
$1,203
State:
$1,518
Percentage of individuals using paid preparers for their 2004 taxes: 60.5%
Here:
61%
State:
58%
(% for various income ranges: 50.7% for AGIs below $10k, 54.8% for AGIs $10k-25k, 59.4% for AGIs $25k-50k, 66.0% for AGIs $50k-75k, 61.7% for AGIs $75k-100k, 68.2% for AGIs over 100k)
Household received Food Stamps/SNAP in the past 12 months: 498 Household did not receive Food Stamps/SNAP in the past 12 months: 4,127
Women who had a birth in the past 12 months: 91 (96 now married, 0 unmarried) Women who did not have a birth in the past 12 months: 2,489 (890 now married, 1,600 unmarried)
Housing units in zip code 02356 with a mortgage: 1,940 (343 second mortgage, 36 home equity loan, 286 both second mortgage and home equity loan) Houses without a mortgage: 57
Median monthly owner costs for units with a mortgage: $2,982 Median monthly owner costs for units without a mortgage: $1,045
Residents with income below the poverty level in 2022:
This zip code:
7.8%
Whole state:
10.4%
Residents with income below 50% of the poverty level in 2022:
This zip code:
6.9%
Whole state:
5.1%
Median number of rooms in houses and condos:
Here:
7.3
State:
6.5
Median number of rooms in apartments:
Here:
3.7
State:
4.0
Notable locations in this zip code not listed on our city pages
Notable locations in zip code 02356: Easton Fire Department Station 1 (A), Easton Townhall (B), Easton Town Hall (C), Moreau Hall (D). Display/hide their locations on the map
Lakes and reservoirs: Longwater Pond (A), Flyaway Pond (B), Leach Pond (C), Old Pond (D), New Pond (E), French Pond (F), Monte Pond (G), Morse Pond (H). Display/hide their locations on the map
1,626 married couples with children.
656 single-parent households (110 men, 546 women).
89.9% of residents of 02356 zip code speak English at home.
3.6% of residents speak Spanish at home (76% very well, 18% well, 2% not well, 4% not at all).
4.2% of residents speak other Indo-European language at home (68% very well, 20% well, 13% not well).
1.0% of residents speak Asian or Pacific Island language at home (52% very well, 9% well, 37% not well, 3% not at all).
1.1% of residents speak other language at home (30% very well, 70% well).
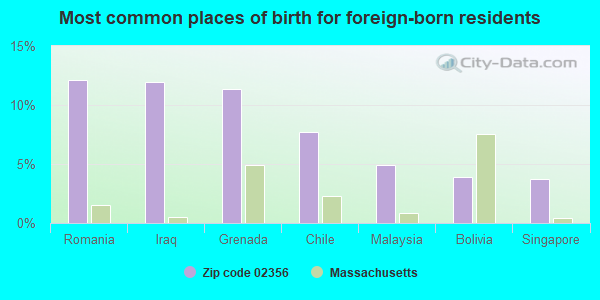
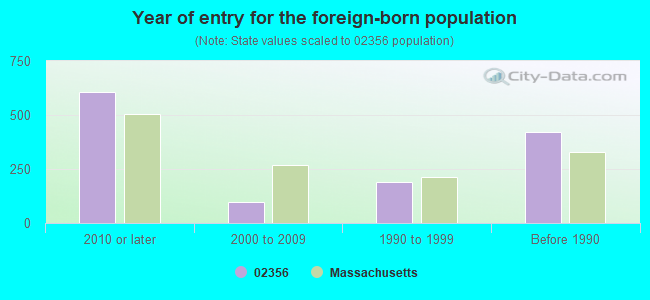
Foreign born population: 960 (7.9%) (69.4% of them are naturalized citizens)
This zip code:
7.9%
Whole state:
18.0%
12%Romania
12%Iraq
11%Grenada
8%Chile
5%Malaysia
4%Bolivia
4%Singapore
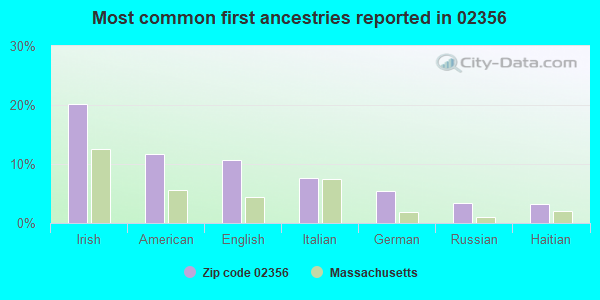
20%Irish
12%American
11%English
8%Italian
5%German
3%Russian
3%Haitian
Year of entry for the foreign-born population
6072010 or later
972000 to 2009
1911990 to 1999
423Before 1990
Major facilities with environmental interests located in this zip code:
EASTON JUNIOR HIGH SCHOOL (99 COLUMBUS AVENUE in EASTON, MA)
AIR MINOR (AIRS/AFS) (National Center for Education Statistics) - STATE ID-088405 CRITERIA AND HAZARDOUS AIR POLLUTANT INVENTORY (Inventory of air pollution sources) Business SIC classification: ELEMENTARY AND SECONDARY SCHOOLS Alternative names: EASTON - JR HIGH SCH, EASTON PUBLIC SCHOOL
MOREAU HALL SCHOOL (360 WASHINGTON ST. in EASTON, MA)
AIR MINOR (AIRS/AFS) (National Center for Education Statistics) - STATE ID-088020 Business SIC classification: ELEMENTARY AND SECONDARY SCHOOLS Organizations: EASTON (SCHOOL DISTRICT)
PARKVIEW SCHOOL (SPOONER STREET in NORTH EASTON, MA)
AIR MINOR (AIRS/AFS) (National Center for Education Statistics) - STATE ID-088015 Business SIC classification: ELEMENTARY AND SECONDARY SCHOOLS Organizations: EASTON (SCHOOL DISTRICT)
Alternative names: PARKVIEW ELEMENTARY
OLIVER AMES HIGH (100 LOTHROP STREET in NORTH EASTON, MA)
(National Center for Education Statistics) - STATE ID-088505 Organizations: EASTON (SCHOOL DISTRICT)
OLIVER AMES HIGH SCHOOL (100 LOTROP STREET in EASTON, MA)
AIR MINOR (AIRS/AFS) COMPLIANCE ACTIVITY (Tracking inspections of insecticide, fungicide, and rodenticide, and toxic substances) CRITERIA AND HAZARDOUS AIR POLLUTANT INVENTORY (Inventory of air pollution sources) Business SIC classification: ELEMENTARY AND SECONDARY SCHOOLS Alternative names: EASTON - OLIVER AMES
MIDDLE SCHOOL (BARROWS ST. in EASTON, MA)
AIR MINOR (AIRS/AFS) CRITERIA AND HAZARDOUS AIR POLLUTANT INVENTORY (Inventory of air pollution sources) Business SIC classification: ELEMENTARY AND SECONDARY SCHOOLS Alternative names: EASTON MIDDLE SCHOOL, EASTON PUBLIC SCHOOL
NORTH EASTON MACHINE CO (218 ELM ST in EASTON, MA)
(Resource Conservation and Recovery Act (tracking hazardous waste)) Business NAICS classification: PRECISION TURNED PRODUCT MANUFACTURING. Organizations: DONALD HOLBROOK (CONTACT/OWNER)
PAINT BY NUMBERS INC (9 WASHINGTON ST in EASTON, MA)
(Resource Conservation and Recovery Act (tracking hazardous waste)) Organizations: ANTHONY MCLAUGHLIN (CONTACT/OWNER)
AIR MINOR (AIRS/AFS) CRITERIA AND HAZARDOUS AIR POLLUTANT INVENTORY (Inventory of air pollution sources) Alternative names: EASTON BRASS& ALUMIN
EASTON AUTO BODY INC (PARK ST in EASTON, MA)
(Resource Conservation and Recovery Act (tracking hazardous waste)) Organizations: KEMPF WILLIAM D (CONTACT/OWNER)
EASTON DPW (130 CENTER ST in EASTON, MA)
Small Quantity Generators, between 100 kg and 1000 kg of hazardous waste/month (Resource Conservation and Recovery Act (tracking hazardous waste)) - notification Organizations: EASTON TOWN OF DPW (CONTACT/OPERATOR)
, TOWN OF EASTON (CONTACT/OWNER)
Alternative names: EASTON DPW LANDFILL, EASTON TOWN OF D P W
BENSON ENTERPRISES INC (87 UNION ST in EASTON, MA)
Conditionally Exempt Small Quantity Generators, less than 100 kg/month of hazardous waste (Resource Conservation and Recovery Act (tracking hazardous waste)) - notification Organizations: WAYNE E BENSON (CONTACT/OWNER)
NEW ENGLAND STAMPING & FABRICA (227 BAY RD in EASTON, MA)
Conditionally Exempt Small Quantity Generators, less than 100 kg/month of hazardous waste (Resource Conservation and Recovery Act (tracking hazardous waste)) - notification Business NAICS classification: SHEET METAL WORK MANUFACTURING. Organizations: ZEITSIFF ROBERT (CONTACT/OWNER)
Alternative names: NEW ENGLAND STAMPING & FABRICATING
Housing units lacking complete plumbing facilities: 0.5% Housing units lacking complete kitchen facilities: 0.7%
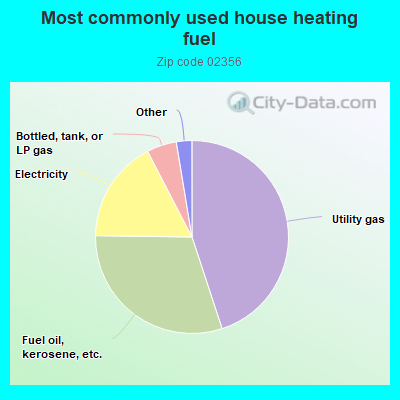
45.0%Utility gas
30.3%Fuel oil, kerosene, etc.
17.2%Electricity
5.0%Bottled, tank, or LP gas
0.9%Wood
0.8%No fuel used
0.6%Other fuel
Population in 1990: 10,397. Population change in the 1990s: +2,107 (+20.3%).
Place of birth for U.S.-born residents:
This state: 8,288
Northeast: 1,474
Midwest: 388
South: 481
West: 233
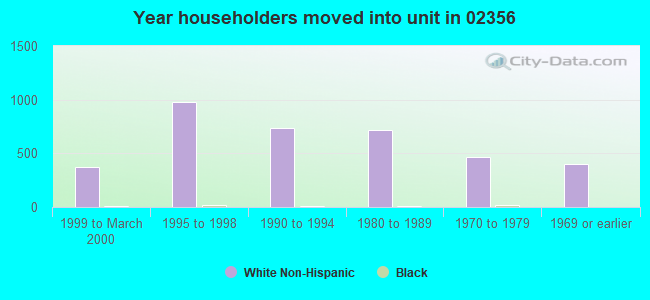
59% of the 02356 zip code residents lived in the same house 5 years ago. Out of people who lived in different houses, 33% lived in this county. Out of people who lived in different counties, 50% lived in Massachusetts.
92% of the 02356 zip code residents lived in the same house 1 year ago. Out of people who lived in different houses, 26% moved from this county. Out of people who lived in different houses, 50% moved from different county within same state. Out of people who lived in different houses, 28% moved from different state.
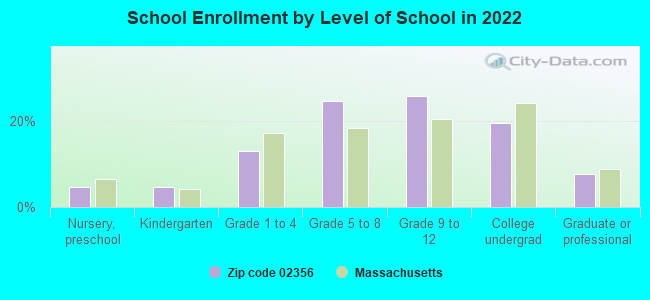
Private vs. public school enrollment:
Students in private schools in grades 1 to 8 (elementary and middle school): 71
Here:
6.6%
Massachusetts:
10.3%
Students in private schools in grades 9 to 12 (high school): 45
Here:
6.2%
Massachusetts:
12.3%
Students in private undergraduate colleges: 304
Here:
53.4%
Massachusetts:
51.2%
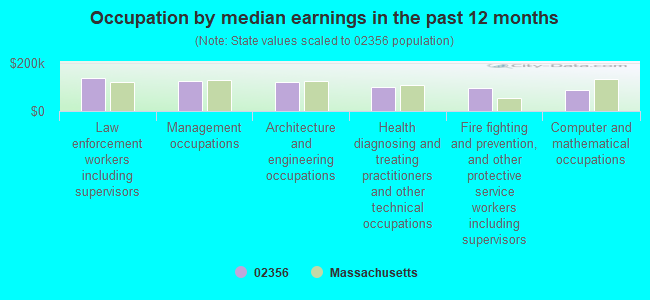
Occupation by median earnings in the past 12 months ($)
139,850Law enforcement workers including supervisors
127,011Management occupations
120,927Architecture and engineering occupations
102,099Health diagnosing and treating practitioners and other technical occupations
94,845Fire fighting and prevention, and other protective service workers including supervisors
88,400Computer and mathematical occupations
Companies with federal contracts located in this zip code:
MILTRON SYSTEMS INC (15 MEREDITH DR in NORTH EASTON, MA; small business) : $80,588 in 4 contractsfrom 2003 to 2005
$38,640 with Navy for Converters, Electrical, Nonrotating. Signed on 2003-03-06. Completion date: 2003-05-15.
$29,120 with Navy for Electrical Control Equipment. Signed on 2003-06-23. Completion date: 2003-09-01.
$9,168 with Navy for Miscellaneous Electrical and Electronic Components. Signed on 2003-09-27. Completion date: 2003-10-04.
$3,660 with Navy for Miscellaneous Communication Equipment. Signed on 2005-07-29. Completion date: 2005-09-30.
Top industries in this zip code by the number of employees in 2005:
Accommodation and Food Services: Food Service Contractors (100-249 employees: 1 establishment, 1-4 employees: 1 establishment)
Health Care and Social Assistance: Nursing Care Facilities (100-249: 1)
Accommodation and Food Services: Full-Service Restaurants (20-49: 3, 5-9: 1)
Administrative and Support and Waste Management and Remediation Services: Convention and Trade Show Organizers (50-99: 1)
Other Services (except Public Administration): Beauty Salons (20-49: 1, 10-19: 2, 1-4: 4)
Health Care and Social Assistance: Home Health Care Services (20-49: 2)
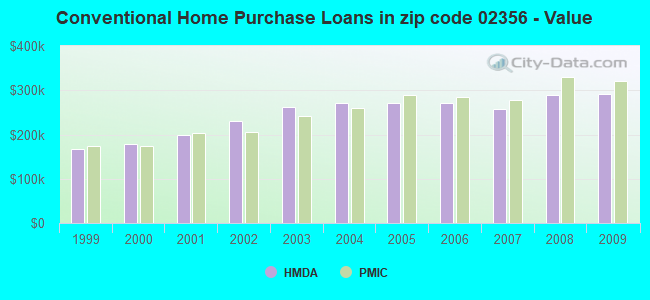
Detailed PMIC statistics for the following Tracts:6001.00
, 6002.01
2002 - 2018 National Fire Incident Reporting System (NFIRS) incidents
According to the data from the years 2002 - 2018 the average number of fires per year is 12. The highest number of reported fire incidents - 28 took place in 2015, and the least - 2 in 2010. The data has a rising trend.
When looking into fire subcategories, the most reports belonged to: Structure Fires (57.2%), and Outside Fires (18.4%).
Fire incident types reported to NFIRS in Zip Code 02356


 Nearest zip codes: 02357, 02072, 02067, 02375, 02301, 02322.


 According to the data from the years 2002 - 2018 the average number of fires per year is 12. The highest number of reported fire incidents - 28 took place in 2015, and the least - 2 in 2010. The data has a rising trend.
 When looking into fire subcategories, the most reports belonged to: Structure Fires (57.2%), and Outside Fires (18.4%).