Estimated zip code population in 2022: 10,172 Zip code population in 2010: 9,679 Zip code population in 2000: 9,954
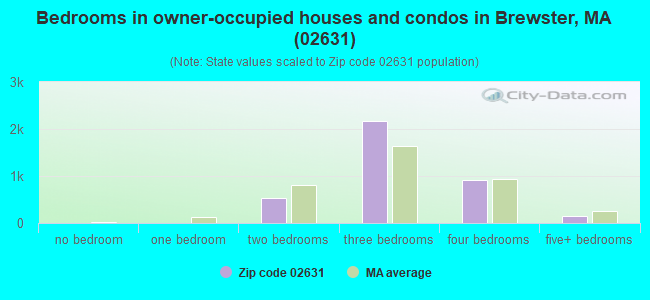
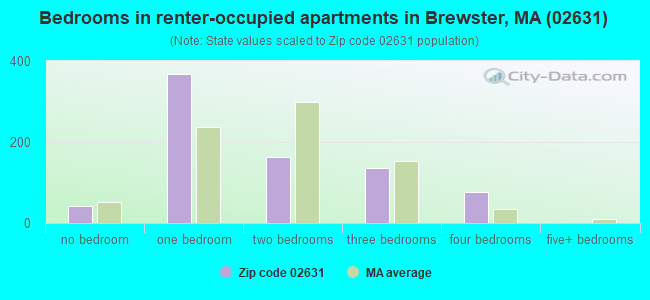
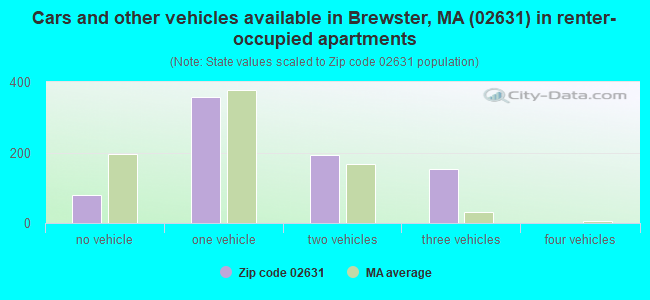
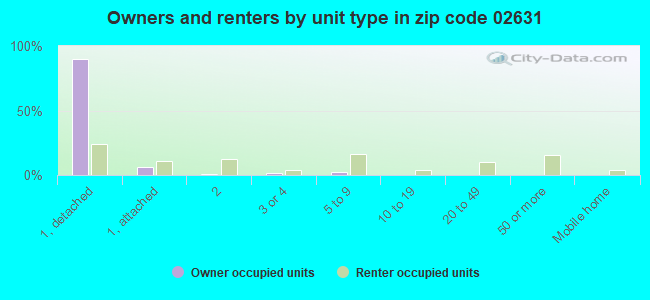
Houses and condos: 8,161 Renter-occupied apartments: 782
% of renters here:
17%
State:
38%
March 2022 cost of living index in zip code 02631: 117.9 (more than average, U.S. average is 100)
Land area: 22.0 sq. mi. Water area: 2.8 sq. mi.
Population density: 463 people per square mile
(low).
OSM Map
Google Map
MSN Map
OSM Map
General Map
Google Map
MSN Map
OSM Map
Google Map
MSN Map
OSM Map
Google Map
MSN Map
Please wait while loading the map...
Real estate property taxes paid for housing units in 2022:
This zip code:
0.6% ($4,088)
Massachusetts:
1.0% ($5,536)
Median real estate property taxes paid for housing units with mortgages in 2022: $4,142 (0.6%) Median real estate property taxes paid for housing units with no mortgage in 2022: $3,996 (0.6%)
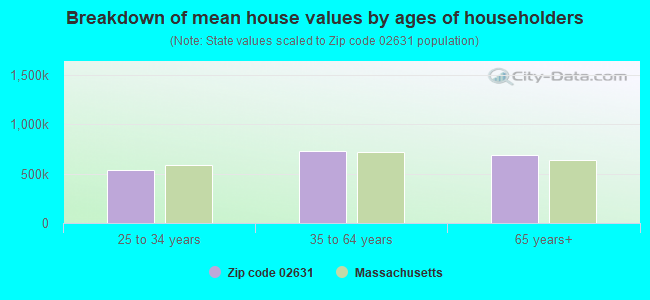
Estimated median house/condo value in 2022: $652,159
02631:
$652,159
Massachusetts:
$534,700
According to our research of Massachusetts and other state lists, there was 1 registered sex offender living in 02631 zip code as of April 24, 2024. The ratio of all residents to sex offenders in zip code 02631 is 9,922 to 1. The ratio of registered sex offenders to all residents in this zip code is much lower than the state average.
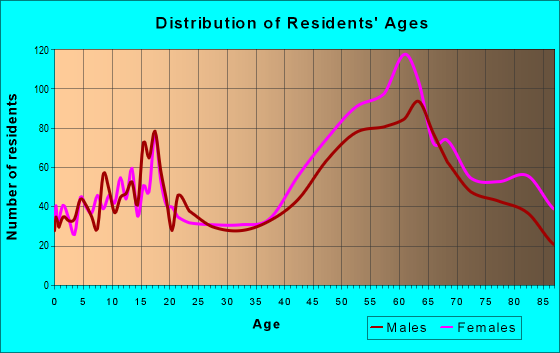
Median resident age:
This zip code:
56.7 years
Massachusetts median age:
40.3 years
Average household size:
This zip code:
2.2 people
Massachusetts:
2.4 people
Averages for the 2020 tax year for zip code 02631, filed in 2021:
Average Adjusted Gross Income (AGI) in 2020: $95,218 (Individual Income Tax Returns)
Here:
$95,218
State:
$105,130
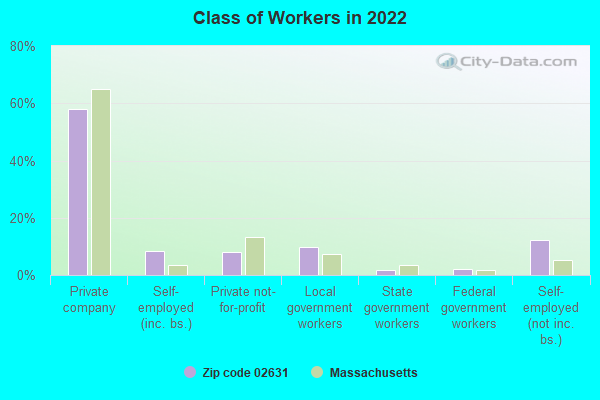
Salary/wage: $69,390 (reported on 68.0% of returns)
Here:
$69,390
State:
$82,951
(% of AGI for various income ranges: 1167.9% for AGIs below $25k, 3445.4% for AGIs $25k-50k, 6102.3% for AGIs $50k-75k, 8304.7% for AGIs $75k-100k, 15553.7% for AGIs $100k-200k, 103866.0% for AGIs over 200k)
Taxable interest for individuals: $1,785 (reported on 48.8% of returns)
This zip code:
$1,785
Massachusetts:
$2,361
(% of AGI for various income ranges: 42.8% for AGIs below $25k, 75.4% for AGIs $25k-50k, 84.4% for AGIs $50k-75k, 152.5% for AGIs $75k-100k, 311.6% for AGIs $100k-200k, 1658.0% for AGIs over 200k)
Ordinary dividends: $9,377 (reported on 37.6% of returns)
Here:
$9,377
State:
$10,365
(% of AGI for various income ranges: 112.5% for AGIs below $25k, 160.8% for AGIs $25k-50k, 338.6% for AGIs $50k-75k, 552.2% for AGIs $75k-100k, 1191.4% for AGIs $100k-200k, 8808.0% for AGIs over 200k)
Net capital gain/loss in AGI: +$24,301 (reported on 33.6% of returns)
Here:
+$24,301
State:
+$48,178
(% of AGI for various income ranges: 29.1% for AGIs below $25k, 130.3% for AGIs $25k-50k, 350.5% for AGIs $50k-75k, 434.7% for AGIs $75k-100k, 1733.9% for AGIs $100k-200k, 33756.0% for AGIs over 200k)
Profit/loss from business: +$25,774 (reported on 21.9% of returns)
Here:
+$25,774
State:
+$20,792
(% of AGI for various income ranges: 171.1% for AGIs below $25k, 444.2% for AGIs $25k-50k, 664.7% for AGIs $50k-75k, 826.6% for AGIs $75k-100k, 1781.0% for AGIs $100k-200k, 13092.0% for AGIs over 200k)
Taxable individual retirement arrangement distribution: $28,173 (reported on 19.8% of returns)
02631:
$28,173
Massachusetts:
$22,790
(% of AGI for various income ranges: 127.8% for AGIs below $25k, 278.3% for AGIs $25k-50k, 568.4% for AGIs $50k-75k, 1042.5% for AGIs $75k-100k, 2328.2% for AGIs $100k-200k, 11171.0% for AGIs over 200k)
Self-employed (Keogh) retirement plans: $23,200 (reported on 1.7% of returns)
02631:
$23,200
Massachusetts:
$26,868
(% of AGI for various income ranges: 29.0% for AGIs $25k-50k, 88.0% for AGIs $100k-200k, 1665.0% for AGIs over 200k)
Total itemized deductions: $32,819 (reported on 15.4% of returns)
Here:
$32,819
State:
$36,722
(% of AGI for various income ranges: 212.6% for AGIs below $25k, 362.3% for AGIs $25k-50k, 715.1% for AGIs $50k-75k, 1161.2% for AGIs $75k-100k, 1560.2% for AGIs $100k-200k, 9839.0% for AGIs over 200k)
Charity contributions: $6,431 (reported on 12.4% of returns)
Here:
$6,431
State:
$12,529
(% of AGI for various income ranges: 6.7% for AGIs below $25k, 27.7% for AGIs $25k-50k, 55.6% for AGIs $50k-75k, 74.4% for AGIs $75k-100k, 238.6% for AGIs $100k-200k, 2621.0% for AGIs over 200k)
Taxes paid: $7,894 (reported on 15.4% of returns)
02631:
$7,894
State:
$8,782
(% of AGI for various income ranges: 40.5% for AGIs below $25k, 84.5% for AGIs $25k-50k, 185.3% for AGIs $50k-75k, 291.6% for AGIs $75k-100k, 447.5% for AGIs $100k-200k, 2007.0% for AGIs over 200k)
Earned income credit: $1,593 (reported on 7.2% of returns)
Here:
$1,593
State:
$1,909
(% of AGI for various income ranges: 47.0% for AGIs below $25k, 38.3% for AGIs $25k-50k)
Percentage of individuals using paid preparers for their 2020 taxes: 91.6%
Here:
92%
State:
92%
(% for various income ranges: 89.2% for AGIs below $25k, 91.4% for AGIs $25k-50k, 92.3% for AGIs $50k-75k, 92.1% for AGIs $75k-100k, 93.2% for AGIs $100k-200k, 94.0% for AGIs over 200k)
Averages for the 2012 tax year for zip code 02631, filed in 2013:
Average Adjusted Gross Income (AGI) in 2012: $67,296 (Individual Income Tax Returns)
Here:
$67,296
State:
$81,425
Salary/wage: $50,530 (reported on 70.7% of returns)
Here:
$50,530
State:
$64,752
(% of AGI for various income ranges: 60.3% for AGIs below $25k, 60.0% for AGIs $25k-50k, 59.1% for AGIs $50k-75k, 51.9% for AGIs $75k-100k, 52.1% for AGIs $100k-200k, 46.9% for AGIs over 200k)
Taxable interest for individuals: $1,522 (reported on 50.6% of returns)
This zip code:
$1,522
Massachusetts:
$2,136
(% of AGI for various income ranges: 2.6% for AGIs below $25k, 1.4% for AGIs $25k-50k, 1.2% for AGIs $50k-75k, 0.7% for AGIs $75k-100k, 1.1% for AGIs $100k-200k, 1.0% for AGIs over 200k)
Ordinary dividends: $8,098 (reported on 36.2% of returns)
Here:
$8,098
State:
$9,473
(% of AGI for various income ranges: 4.8% for AGIs below $25k, 2.9% for AGIs $25k-50k, 3.6% for AGIs $50k-75k, 3.1% for AGIs $75k-100k, 4.1% for AGIs $100k-200k, 6.3% for AGIs over 200k)
Net capital gain/loss in AGI: +$12,142 (reported on 28.1% of returns)
Here:
+$12,142
State:
+$31,437
(% of AGI for various income ranges: 0.6% for AGIs $25k-50k, 1.0% for AGIs $50k-75k, 1.4% for AGIs $75k-100k, 3.1% for AGIs $100k-200k, 14.5% for AGIs over 200k)
Profit/loss from business: +$19,376 (reported on 23.6% of returns)
Here:
+$19,376
State:
+$20,662
(% of AGI for various income ranges: 13.1% for AGIs below $25k, 9.6% for AGIs $25k-50k, 6.6% for AGIs $50k-75k, 6.0% for AGIs $75k-100k, 6.2% for AGIs $100k-200k, 5.3% for AGIs over 200k)
Taxable individual retirement arrangement distribution: $21,844 (reported on 20.9% of returns)
02631:
$21,844
Massachusetts:
$18,892
(% of AGI for various income ranges: 5.8% for AGIs below $25k, 5.5% for AGIs $25k-50k, 4.3% for AGIs $50k-75k, 7.6% for AGIs $75k-100k, 8.8% for AGIs $100k-200k, 6.5% for AGIs over 200k)
Self-employment retirement plans: $19,078 (reported on 1.7% of returns)
02631:
$19,078
Massachusetts:
$20,669
(% of AGI for various income ranges: 1.0% for AGIs $50k-75k, 0.4% for AGIs $100k-200k, 0.9% for AGIs over 200k)
Total itemized deductions: $24,167 (23% of AGI, reported on 46.3% of returns)
Here:
$24,167
State:
$28,907
Here:
22.6% of AGI
State:
18.2% of AGI
(% of AGI for various income ranges: 28.6% for AGIs below $25k, 16.8% for AGIs $25k-50k, 18.7% for AGIs $50k-75k, 18.0% for AGIs $75k-100k, 16.4% for AGIs $100k-200k, 12.3% for AGIs over 200k)
Charity contributions: $2,892 (reported on 38.8% of returns)
Here:
$2,892
State:
$4,208
(% of AGI for various income ranges: 1.1% for AGIs below $25k, 1.2% for AGIs $25k-50k, 1.4% for AGIs $50k-75k, 1.5% for AGIs $75k-100k, 2.0% for AGIs $100k-200k, 2.0% for AGIs over 200k)
Taxes paid: $9,324 (reported on 45.9% of returns)
02631:
$9,324
State:
$13,303
(% of AGI for various income ranges: 6.0% for AGIs below $25k, 4.7% for AGIs $25k-50k, 6.1% for AGIs $50k-75k, 6.2% for AGIs $75k-100k, 7.0% for AGIs $100k-200k, 6.7% for AGIs over 200k)
Earned income credit: $1,712 (reported on 9.5% of returns)
Here:
$1,712
State:
$1,971
(% of AGI for various income ranges: 3.0% for AGIs below $25k, 0.5% for AGIs $25k-50k)
Percentage of individuals using paid preparers for their 2012 taxes: 60.3%
Here:
60%
State:
56%
(% for various income ranges: 52.3% for AGIs below $25k, 57.0% for AGIs $25k-50k, 66.7% for AGIs $50k-75k, 63.6% for AGIs $75k-100k, 68.5% for AGIs $100k-200k, 85.0% for AGIs over 200k)
Averages for the 2004 tax year for zip code 02631, filed in 2005:
Average Adjusted Gross Income (AGI) in 2004: $52,111 (Individual Income Tax Returns)
Here:
$52,111
State:
$62,877
Salary/wage: $41,612 (reported on 70.6% of returns)
Here:
$41,612
State:
$52,969
(% of AGI for various income ranges: 108.5% for AGIs below $10k, 54.8% for AGIs $10k-25k, 59.7% for AGIs $25k-50k, 59.0% for AGIs $50k-75k, 58.1% for AGIs $75k-100k, 51.9% for AGIs over 100k)
Taxable interest for individuals: $1,846 (reported on 65.9% of returns)
This zip code:
$1,846
Massachusetts:
$1,945
(% of AGI for various income ranges: 8.9% for AGIs below $10k, 5.4% for AGIs $10k-25k, 2.5% for AGIs $25k-50k, 2.0% for AGIs $50k-75k, 2.3% for AGIs $75k-100k, 1.8% for AGIs over 100k)
Taxable dividends: $4,707 (reported on 42.4% of returns)
Here:
$4,707
State:
$5,323
(% of AGI for various income ranges: 10.4% for AGIs below $10k, 5.1% for AGIs $10k-25k, 3.6% for AGIs $25k-50k, 3.0% for AGIs $50k-75k, 3.2% for AGIs $75k-100k, 4.1% for AGIs over 100k)
Net capital gain/loss: +$9,696 (reported on 35.8% of returns)
Here:
+$9,696
State:
+$20,377
(% of AGI for various income ranges: -6.0% for AGIs below $10k, -0.3% for AGIs $10k-25k, 1.0% for AGIs $25k-50k, 1.8% for AGIs $50k-75k, 2.4% for AGIs $75k-100k, 14.3% for AGIs over 100k)
Profit/loss from business: +$19,977 (reported on 24.4% of returns)
Here:
+$19,977
State:
+$17,837
(% of AGI for various income ranges: 12.9% for AGIs below $10k, 13.2% for AGIs $10k-25k, 10.3% for AGIs $25k-50k, 10.3% for AGIs $50k-75k, 6.6% for AGIs $75k-100k, 8.9% for AGIs over 100k)
IRA payment deduction: $3,615 (reported on 4.8% of returns)
02631:
$3,615
Massachusetts:
$3,100
(% of AGI for various income ranges: 1.0% for AGIs below $10k, 0.7% for AGIs $10k-25k, 0.5% for AGIs $25k-50k, 0.3% for AGIs $50k-75k, 0.4% for AGIs $75k-100k, 0.2% for AGIs over 100k)
Self-employed pension: $11,807 (reported on 2.7% of returns)
Here:
$11,807
Massachusetts:
$14,516
(% of AGI for various income ranges: 0.4% for AGIs $10k-25k, 0.6% for AGIs $25k-50k, 0.6% for AGIs $50k-75k, 0.4% for AGIs $75k-100k, 0.8% for AGIs over 100k)
Total itemized deductions: $19,632 (25% of AGI, reported on 48.8% of returns)
Here:
$19,632
State:
$22,573
Here:
24.6% of AGI
State:
19.5% of AGI
(% of AGI for various income ranges: 53.0% for AGIs below $10k, 23.1% for AGIs $10k-25k, 20.7% for AGIs $25k-50k, 19.8% for AGIs $50k-75k, 19.2% for AGIs $75k-100k, 14.7% for AGIs over 100k)
Charity contributions deductions: $2,368 (3% of AGI, reported on 43.1% of returns)
Here:
$2,368
State:
$3,295
Here:
2.8% of AGI
State:
2.7% of AGI
(% of AGI for various income ranges: 1.7% for AGIs below $10k, 1.7% for AGIs $10k-25k, 1.6% for AGIs $25k-50k, 1.8% for AGIs $50k-75k, 1.9% for AGIs $75k-100k, 2.3% for AGIs over 100k)
Total tax: $8,191 (reported on 80.9% of returns)
02631:
$8,191
State:
$11,494
(% of AGI for various income ranges: 5.6% for AGIs below $10k, 5.5% for AGIs $10k-25k, 8.2% for AGIs $25k-50k, 9.8% for AGIs $50k-75k, 10.7% for AGIs $75k-100k, 18.0% for AGIs over 100k)
Earned income credit: $1,182 (reported on 7.2% of returns)
Here:
$1,182
State:
$1,518
Percentage of individuals using paid preparers for their 2004 taxes: 60.9%
Here:
61%
State:
58%
(% for various income ranges: 51.5% for AGIs below $10k, 55.9% for AGIs $10k-25k, 61.4% for AGIs $25k-50k, 65.1% for AGIs $50k-75k, 66.0% for AGIs $75k-100k, 74.7% for AGIs over 100k)
Household received Food Stamps/SNAP in the past 12 months: 302 Household did not receive Food Stamps/SNAP in the past 12 months: 4,206
Women who had a birth in the past 12 months: 36 (38 now married, 0 unmarried) Women who did not have a birth in the past 12 months: 1,515 (715 now married, 790 unmarried)
Housing units in zip code 02631 with a mortgage: 2,150 (423 second mortgage, 16 home equity loan, 413 both second mortgage and home equity loan) Houses without a mortgage: 66
Median monthly owner costs for units with a mortgage: $2,245 Median monthly owner costs for units without a mortgage: $865
Residents with income below the poverty level in 2022:
This zip code:
7.1%
Whole state:
10.4%
Residents with income below 50% of the poverty level in 2022:
This zip code:
4.4%
Whole state:
5.1%
Median number of rooms in houses and condos:
Here:
6.2
State:
6.5
Median number of rooms in apartments:
Here:
4.0
State:
4.0
Notable locations in this zip code not listed on our city pages
Notable locations in zip code 02631: Brewster County Club (A), Ellis Landing (B), Point of Rocks Landing (C), Breakwater Landing (D), Girl Scout Camp (E), Youth Forestry Camp (F), Old Higgins Windmill (G), Sealand of Cape Cod (H), Stony Brook Mill (I), Brewster Fire Department Station 1 (J), Drummer Boy Museum (K), Cape Cod Museum of Natural History (L). Display/hide their locations on the map
Churches in zip code 02631 include: The Church of Jesus Christ of Latter Day Saints (A), Cape Cod Bible Alliance Church (B), Cape Cod Covenant Church (C), Captains Church (D). Display/hide their locations on the map
Cemeteries: Dillingham Cemetery (1), Foster Cemetery (2), Brewster Cemetery (3), Red Top Cemetery (4), Sears Cemetery (5). Display/hide their locations on the map
Lakes, reservoirs, and swamps: Widger Hole (A), Upper Millpond (B), Smith Pond (C), Smalls Pond (D), Sheep Pond (E), Schoolhouse Pond (F), Salls Pond (G), Rafe Pond (H). Display/hide their locations on the map
Beaches: Linnell Landing Beach (A), Crosby Landing Beach (B), Ellis Landing Beach (C), Point of Rocks Landing Beach (D), Town Beach (E), Saints Landing Beach (F), Robbins Hill Beach (G), Paine's Creek Beach (H). Display/hide their locations on the map
In group quarters: 248 (-1 institutionalized population)
Size of family households: 1,818 2-persons, 500 3-persons, 280 4-persons, 160 5-persons, 88 6-persons, 14 7-or-more-persons
Size of nonfamily households: 1,405 1-person, 274 2-persons, 59 3-persons
1,210 married couples with children.
91 single-parent households (40 men, 51 women).
94.3% of residents of 02631 zip code speak English at home.
1.3% of residents speak Spanish at home (74% very well, 26% well).
4.2% of residents speak other Indo-European language at home (75% very well, 25% well).
0.8% of residents speak Asian or Pacific Island language at home (90% very well, 10% not well).
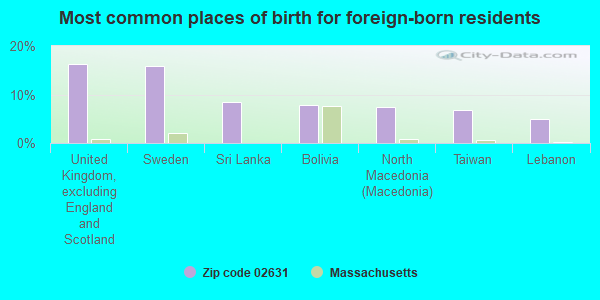
Foreign born population: 671 (6.6%) (82.0% of them are naturalized citizens)
This zip code:
6.6%
Whole state:
18.0%
16%United Kingdom, excluding England and Scotland
16%Sweden
8%Sri Lanka
8%Bolivia
7%North Macedonia (Macedonia)
7%Taiwan
5%Lebanon
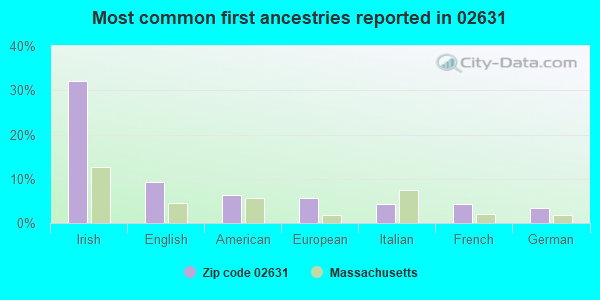
32%Irish
9%English
6%American
6%European
4%Italian
4%French
3%German
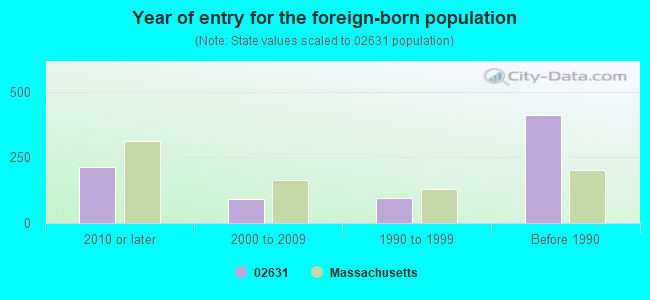
Year of entry for the foreign-born population
2142010 or later
912000 to 2009
941990 to 1999
411Before 1990
Facilities with environmental interests located in this zip code:
BREWSTER TOWN OF (201 RUN HILL RD in BREWSTER, MA)
(Integrated Compliance Information System) - ICIS-01-1997-0106, FORMAL ENFORCEMENT ACTION CRITERIA AND HAZARDOUS AIR POLLUTANT INVENTORY (Inventory of air pollution sources) Small Quantity Generators, between 100 kg and 1000 kg of hazardous waste/month (Resource Conservation and Recovery Act (tracking hazardous waste)) - notification Business SIC classification: REFUSE SYSTEMS Business NAICS classification: SOLID WASTE LANDFILL. Organizations: TOWN OF BREWSTER (CONTACT/OWNER)
Alternative names: BREWSTER TOWN OF TRANSFER STATION
EDDY ELEMENTARY (2298 MAIN STREET in BREWSTER, MA)
(National Center for Education Statistics) - STATE ID-041010 Organizations: BREWSTER (SCHOOL DISTRICT)
BREWSTER POLICE FIRE STA (1657 MAIN ST in BREWSTER, MA)
(Integrated Compliance Information System) - ICIS-01-1997-0106, FORMAL ENFORCEMENT ACTION
CAPE COD READY MIX BREWSTER (4053 MAIN ST. in BREWSTER, MA)
AIR MINOR (AIRS/AFS) CRITERIA AND HAZARDOUS AIR POLLUTANT INVENTORY (Inventory of air pollution sources) TRI REPORTER (Tracking of toxic chemicals releasing facilities) Business SIC classification: READY-MIXED CONCRETE Alternative names: CAPE COD READY MIX INC., CAPE COD READY MIX INC., CAPE COD REDI MIX CONCRETE, CAPE COD RM CONCRETE
ANIMAL RESCUE LEAGUE (3981 ROUTE 6A in BREWSTER, MA)
AIR MINOR (AIRS/AFS) CRITERIA AND HAZARDOUS AIR POLLUTANT INVENTORY (Inventory of air pollution sources) Business SIC classification: ANIMAL SPECIALTY SERVICES, EXCEPT VETERINARY
CAPE COD TRUCK SERVICE (RTE 6A CRANBERRY HWY in BREWSTER, MA)
(Resource Conservation and Recovery Act (tracking hazardous waste)) Organizations: FRANK JOY INC (CONTACT/OWNER)
BREWSTER (TOWN OF BREWSTER in BREWSTER, MA)
AIR MINOR (AIRS/AFS) Business SIC classification: GENERAL GOVERNMENT
BREWSTER LANDFILL TOWN OF (201 RUN HILL RD in BREWSTER, MA)
Conditionally Exempt Small Quantity Generators, less than 100 kg/month of hazardous waste (Resource Conservation and Recovery Act (tracking hazardous waste)) - notification Organizations: TOWN OF BREWSTER (CONTACT/OWNER)
PARACLETE PRESS (36 SOUTHERN EAGLE CARTWAY in BREWSTER, MA)
Small Quantity Generators, between 100 kg and 1000 kg of hazardous waste/month (Resource Conservation and Recovery Act (tracking hazardous waste)) - notification
DONS AUTO COSMETICS INC (UNDERPASS RD in BREWSTER, MA)
Conditionally Exempt Small Quantity Generators, less than 100 kg/month of hazardous waste (Resource Conservation and Recovery Act (tracking hazardous waste)) - notification
Housing units lacking complete plumbing facilities: 1.0% Housing units lacking complete kitchen facilities: 2.5%
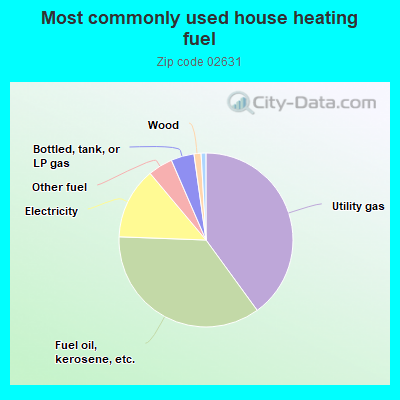
40.0%Utility gas
35.6%Fuel oil, kerosene, etc.
13.3%Electricity
4.6%Other fuel
4.3%Bottled, tank, or LP gas
1.3%Wood
0.9%Solar energy
Population in 1990: 8,535. Population change in the 1990s: +1,419 (+16.6%).
Place of birth for U.S.-born residents:
This state: 5,717
Northeast: 2,419
Midwest: 479
South: 436
West: 289
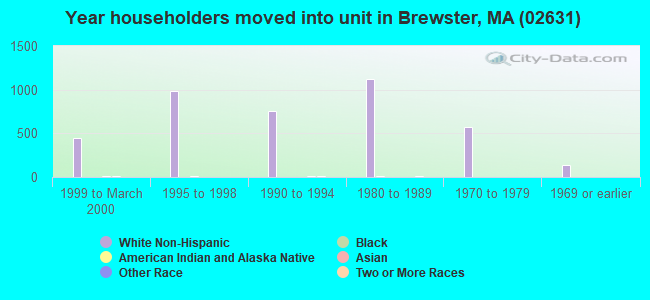
63% of the 02631 zip code residents lived in the same house 5 years ago. Out of people who lived in different houses, 51% lived in this county. Out of people who lived in different counties, 50% lived in Massachusetts.
91% of the 02631 zip code residents lived in the same house 1 year ago. Out of people who lived in different houses, 30% moved from this county. Out of people who lived in different houses, 21% moved from different county within same state. Out of people who lived in different houses, 51% moved from different state. Out of people who lived in different houses, 3% moved from abroad.
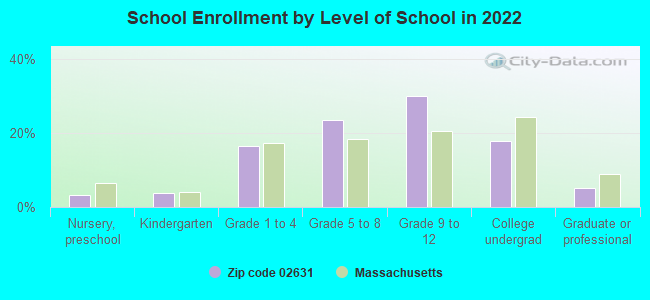
Private vs. public school enrollment:
Students in private schools in grades 1 to 8 (elementary and middle school): 11
Here:
1.6%
Massachusetts:
10.3%
Students in private schools in grades 9 to 12 (high school): 48
Here:
9.2%
Massachusetts:
12.3%
Students in private undergraduate colleges: 22
Here:
7.1%
Massachusetts:
51.2%
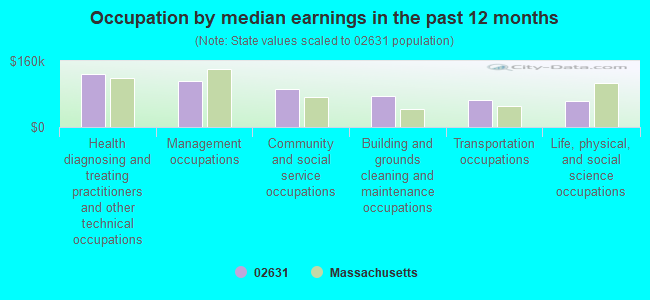
Occupation by median earnings in the past 12 months ($)
129,152Health diagnosing and treating practitioners and other technical occupations
110,724Management occupations
91,954Community and social service occupations
75,291Building and grounds cleaning and maintenance occupations
64,497Transportation occupations
62,541Life, physical, and social science occupations
Companies with federal contracts located in this zip code:
CARBONMAX SPORTS TECHNOLOGY IN (51 FAR FIELDS RD in BREWSTER, MA; small business)
$5,950 with Army for Athletic and Sporting Equipment. Signed on 2003-09-26. Completion date: 2003-10-31.
Top industries in this zip code by the number of employees in 2005:
Health Care and Social Assistance: Nursing Care Facilities (100-249 employees: 2 establishments)
Health Care and Social Assistance: Other Residential Care Facilities (100-249: 1, 20-49: 2)
Accommodation and Food Services: Hotels (except Casino Hotels) and Motels (100-249: 1)
Information: Book Publishers (50-99: 1, 1-4: 2)
Information: Data Processing, Hosting, and Related Services (50-99: 1, 1-4: 1)
Health Care and Social Assistance: Child Day Care Services (20-49: 1, 10-19: 1, 5-9: 1, 1-4: 1)
Other Services (except Public Administration): Religious Organizations (10-19: 2, 5-9: 3, 1-4: 1)
Health Care and Social Assistance: Residential Mental Retardation Facilities (10-19: 2, 5-9: 3)
Detailed PMIC statistics for the following Tracts:0108.00
, 0109.00
2002 - 2018 National Fire Incident Reporting System (NFIRS) incidents
Based on the data from the years 2002 - 2018 the average number of fire incidents per year is 58. The highest number of fire incidents - 107 took place in 2006, and the least - 13 in 2005. The data has an increasing trend.
When looking into fire subcategories, the most reports belonged to: Structure Fires (54.8%), and Outside Fires (29.6%).
Fire incident types reported to NFIRS in Zip Code 02631


 Nearest zip codes: 02645, 02646, 02659, 02641, 02671, 02653.


 Based on the data from the years 2002 - 2018 the average number of fire incidents per year is 58. The highest number of fire incidents - 107 took place in 2006, and the least - 13 in 2005. The data has an increasing trend.
 When looking into fire subcategories, the most reports belonged to: Structure Fires (54.8%), and Outside Fires (29.6%).