Estimated zip code population in 2022: 3,836 Zip code population in 2010: 3,955 Zip code population in 2000: 3,823
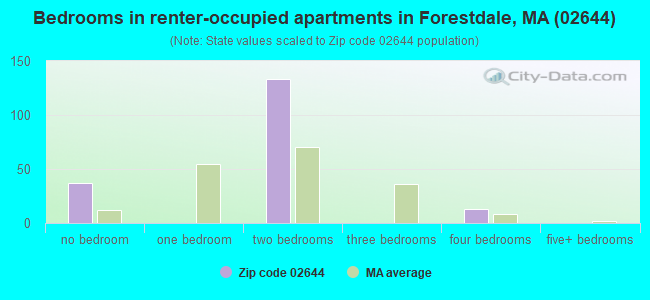
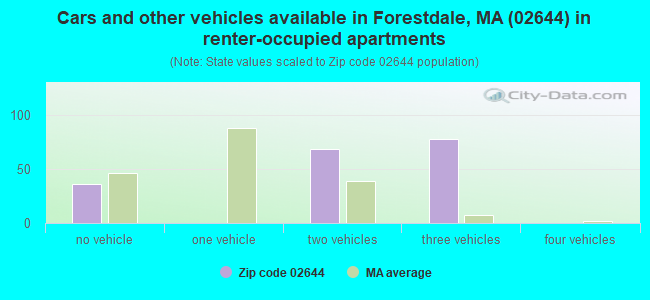
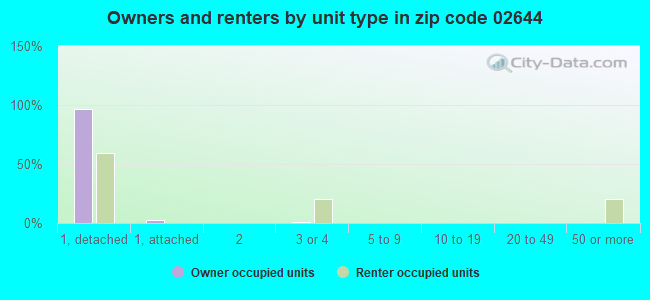
Houses and condos: 1,621 Renter-occupied apartments: 184
% of renters here:
12%
State:
38%
March 2022 cost of living index in zip code 02644: 116.0 (more than average, U.S. average is 100)
Land area: 3.6 sq. mi. Water area: 0.2 sq. mi.
Population density: 1,077 people per square mile
(low).
OSM Map
Google Map
MSN Map
OSM Map
General Map
Google Map
MSN Map
OSM Map
Google Map
MSN Map
OSM Map
Google Map
MSN Map
Please wait while loading the map...
Real estate property taxes paid for housing units in 2022:
This zip code:
1.1% ($5,290)
Massachusetts:
1.0% ($5,536)
Median real estate property taxes paid for housing units with mortgages in 2022: $5,256 (1.1%) Median real estate property taxes paid for housing units with no mortgage in 2022: $5,388 (1.1%)
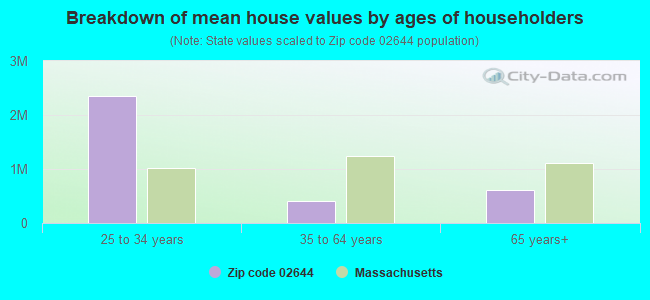
Estimated median house/condo value in 2022: $494,258
02644:
$494,258
Massachusetts:
$534,700
According to our research of Massachusetts and other state lists, there were 2 registered sex offenders living in 02644 zip code as of April 19, 2024. The ratio of all residents to sex offenders in zip code 02644 is 2,449 to 1. The ratio of registered sex offenders to all residents in this zip code is lower than the state average.
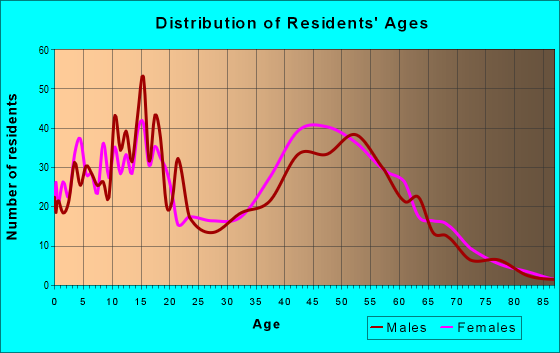
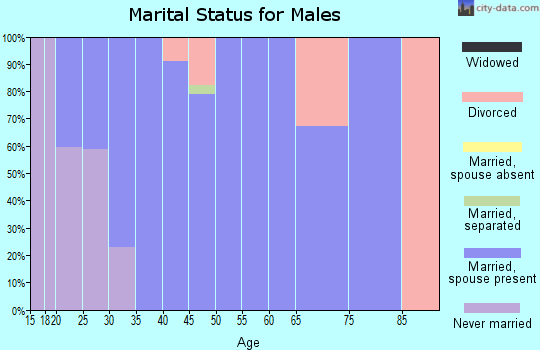
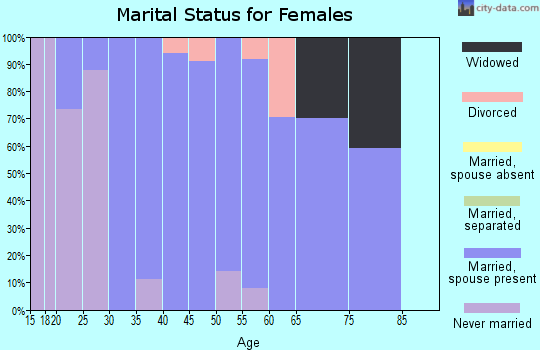
Median resident age:
This zip code:
51.2 years
Massachusetts median age:
40.3 years
Average household size:
This zip code:
2.5 people
Massachusetts:
2.4 people
Averages for the 2020 tax year for zip code 02644, filed in 2021:
Average Adjusted Gross Income (AGI) in 2020: $78,409 (Individual Income Tax Returns)
Here:
$78,409
State:
$105,130
Salary/wage: $68,169 (reported on 85.3% of returns)
Here:
$68,169
State:
$82,951
(% of AGI for various income ranges: 1217.2% for AGIs below $25k, 3600.0% for AGIs $25k-50k, 6223.6% for AGIs $50k-75k, 9145.0% for AGIs $75k-100k, 19056.4% for AGIs $100k-200k, 60706.0% for AGIs over 200k)
Taxable interest for individuals: $709 (reported on 35.1% of returns)
This zip code:
$709
Massachusetts:
$2,361
(% of AGI for various income ranges: 22.5% for AGIs below $25k, 21.1% for AGIs $25k-50k, 25.2% for AGIs $50k-75k, 34.4% for AGIs $75k-100k, 57.5% for AGIs $100k-200k, 252.0% for AGIs over 200k)
Ordinary dividends: $2,949 (reported on 20.9% of returns)
Here:
$2,949
State:
$10,365
(% of AGI for various income ranges: 25.0% for AGIs below $25k, 55.7% for AGIs $25k-50k, 53.6% for AGIs $50k-75k, 101.9% for AGIs $75k-100k, 241.8% for AGIs $100k-200k, 254.0% for AGIs over 200k)
Net capital gain/loss in AGI: +$10,165 (reported on 17.8% of returns)
Here:
+$10,165
State:
+$48,178
(% of AGI for various income ranges: 6.9% for AGIs below $25k, 56.3% for AGIs $25k-50k, 58.0% for AGIs $50k-75k, 118.8% for AGIs $75k-100k, 406.1% for AGIs $100k-200k, 4744.0% for AGIs over 200k)
Profit/loss from business: +$14,808 (reported on 17.8% of returns)
Here:
+$14,808
State:
+$20,792
(% of AGI for various income ranges: 113.3% for AGIs below $25k, 245.7% for AGIs $25k-50k, 278.8% for AGIs $50k-75k, 369.4% for AGIs $75k-100k, 661.1% for AGIs $100k-200k, 3032.0% for AGIs over 200k)
Taxable individual retirement arrangement distribution: $18,919 (reported on 9.3% of returns)
02644:
$18,919
Massachusetts:
$22,790
(% of AGI for various income ranges: 49.4% for AGIs below $25k, 86.9% for AGIs $25k-50k, 157.2% for AGIs $50k-75k, 381.9% for AGIs $75k-100k, 888.2% for AGIs $100k-200k)
Total itemized deductions: $24,594 (reported on 13.8% of returns)
Here:
$24,594
State:
$36,722
(% of AGI for various income ranges: 330.0% for AGIs $25k-50k, 369.6% for AGIs $50k-75k, 866.2% for AGIs $75k-100k, 1065.0% for AGIs $100k-200k, 2354.0% for AGIs over 200k)
Charity contributions: $3,479 (reported on 10.7% of returns)
Here:
$3,479
State:
$12,529
(% of AGI for various income ranges: 32.6% for AGIs $25k-50k, 37.6% for AGIs $50k-75k, 44.4% for AGIs $75k-100k, 109.6% for AGIs $100k-200k, 498.0% for AGIs over 200k)
Taxes paid: $8,710 (reported on 13.3% of returns)
02644:
$8,710
State:
$8,782
(% of AGI for various income ranges: 95.7% for AGIs $25k-50k, 130.0% for AGIs $50k-75k, 333.1% for AGIs $75k-100k, 371.4% for AGIs $100k-200k, 760.0% for AGIs over 200k)
Earned income credit: $1,678 (reported on 8.0% of returns)
Here:
$1,678
State:
$1,909
(% of AGI for various income ranges: 47.8% for AGIs below $25k, 37.1% for AGIs $25k-50k)
Percentage of individuals using paid preparers for their 2020 taxes: 93.3%
Here:
93%
State:
92%
(% for various income ranges: 91.2% for AGIs below $25k, 93.6% for AGIs $25k-50k, 94.1% for AGIs $50k-75k, 91.7% for AGIs $75k-100k, 94.0% for AGIs $100k-200k, 100.0% for AGIs over 200k)
Averages for the 2012 tax year for zip code 02644, filed in 2013:
Average Adjusted Gross Income (AGI) in 2012: $59,262 (Individual Income Tax Returns)
Here:
$59,262
State:
$81,425
Salary/wage: $54,217 (reported on 85.5% of returns)
Here:
$54,217
State:
$64,752
(% of AGI for various income ranges: 72.3% for AGIs below $25k, 73.4% for AGIs $25k-50k, 76.6% for AGIs $50k-75k, 81.2% for AGIs $75k-100k, 84.8% for AGIs $100k-200k, 61.6% for AGIs over 200k)
Taxable interest for individuals: $554 (reported on 36.2% of returns)
This zip code:
$554
Massachusetts:
$2,136
(% of AGI for various income ranges: 1.0% for AGIs below $25k, 0.4% for AGIs $25k-50k, 0.4% for AGIs $50k-75k, 0.3% for AGIs $75k-100k, 0.2% for AGIs $100k-200k, 0.2% for AGIs over 200k)
Ordinary dividends: $1,829 (reported on 19.0% of returns)
Here:
$1,829
State:
$9,473
(% of AGI for various income ranges: 1.5% for AGIs below $25k, 0.6% for AGIs $25k-50k, 0.5% for AGIs $50k-75k, 0.8% for AGIs $75k-100k, 0.4% for AGIs $100k-200k, 0.4% for AGIs over 200k)
Net capital gain/loss in AGI: +$1,997 (reported on 13.1% of returns)
Here:
+$1,997
State:
+$31,437
(% of AGI for various income ranges: 1.3% for AGIs $100k-200k)
Profit/loss from business: +$10,322 (reported on 18.1% of returns)
Here:
+$10,322
State:
+$20,662
(% of AGI for various income ranges: 9.7% for AGIs below $25k, 6.3% for AGIs $25k-50k, 3.7% for AGIs $50k-75k, 1.6% for AGIs $75k-100k, 2.5% for AGIs $100k-200k)
Taxable individual retirement arrangement distribution: $12,500 (reported on 9.5% of returns)
02644:
$12,500
Massachusetts:
$18,892
(% of AGI for various income ranges: 3.3% for AGIs below $25k, 2.1% for AGIs $25k-50k, 1.9% for AGIs $50k-75k, 1.7% for AGIs $75k-100k, 2.5% for AGIs $100k-200k)
Total itemized deductions: $21,220 (22% of AGI, reported on 46.2% of returns)
Here:
$21,220
State:
$28,907
Here:
22.5% of AGI
State:
18.2% of AGI
(% of AGI for various income ranges: 17.9% for AGIs below $25k, 14.4% for AGIs $25k-50k, 18.0% for AGIs $50k-75k, 18.0% for AGIs $75k-100k, 16.9% for AGIs $100k-200k, 12.0% for AGIs over 200k)
Charity contributions: $1,812 (reported on 37.1% of returns)
Here:
$1,812
State:
$4,208
(% of AGI for various income ranges: 0.7% for AGIs below $25k, 1.0% for AGIs $25k-50k, 0.9% for AGIs $50k-75k, 1.1% for AGIs $75k-100k, 1.2% for AGIs $100k-200k, 1.6% for AGIs over 200k)
Taxes paid: $8,617 (reported on 46.2% of returns)
02644:
$8,617
State:
$13,303
(% of AGI for various income ranges: 4.4% for AGIs below $25k, 4.8% for AGIs $25k-50k, 6.6% for AGIs $50k-75k, 7.1% for AGIs $75k-100k, 7.6% for AGIs $100k-200k, 6.3% for AGIs over 200k)
Earned income credit: $1,918 (reported on 10.0% of returns)
Here:
$1,918
State:
$1,971
(% of AGI for various income ranges: 3.3% for AGIs below $25k, 0.9% for AGIs $25k-50k)
Percentage of individuals using paid preparers for their 2012 taxes: 54.8%
Here:
55%
State:
56%
(% for various income ranges: 44.3% for AGIs below $25k, 52.4% for AGIs $25k-50k, 62.5% for AGIs $50k-75k, 63.0% for AGIs $75k-100k, 62.2% for AGIs $100k-200k, 100.0% for AGIs over 200k)
Averages for the 2004 tax year for zip code 02644, filed in 2005:
Average Adjusted Gross Income (AGI) in 2004: $51,056 (Individual Income Tax Returns)
Here:
$51,056
State:
$62,877
Salary/wage: $46,643 (reported on 88.3% of returns)
Here:
$46,643
State:
$52,969
(% of AGI for various income ranges: 91.0% for AGIs below $10k, 73.1% for AGIs $10k-25k, 81.1% for AGIs $25k-50k, 80.0% for AGIs $50k-75k, 85.5% for AGIs $75k-100k, 78.3% for AGIs over 100k)
Taxable interest for individuals: $631 (reported on 54.3% of returns)
This zip code:
$631
Massachusetts:
$1,945
(% of AGI for various income ranges: 2.7% for AGIs below $10k, 1.8% for AGIs $10k-25k, 0.6% for AGIs $25k-50k, 0.8% for AGIs $50k-75k, 0.4% for AGIs $75k-100k, 0.5% for AGIs over 100k)
Taxable dividends: $1,157 (reported on 23.3% of returns)
Here:
$1,157
State:
$5,323
(% of AGI for various income ranges: 0.6% for AGIs below $10k, 1.5% for AGIs $10k-25k, 0.6% for AGIs $25k-50k, 0.4% for AGIs $50k-75k, 0.4% for AGIs $75k-100k, 0.5% for AGIs over 100k)
Net capital gain/loss: +$6,340 (reported on 17.7% of returns)
Here:
+$6,340
State:
+$20,377
(% of AGI for various income ranges: -0.9% for AGIs below $10k, 0.6% for AGIs $10k-25k, -0.3% for AGIs $25k-50k, 0.4% for AGIs $50k-75k, 0.9% for AGIs $75k-100k, 6.1% for AGIs over 100k)
Profit/loss from business: +$14,000 (reported on 18.6% of returns)
Here:
+$14,000
State:
+$17,837
(% of AGI for various income ranges: 9.9% for AGIs below $10k, 13.5% for AGIs $10k-25k, 7.0% for AGIs $25k-50k, 6.2% for AGIs $50k-75k, 3.1% for AGIs $75k-100k, 3.0% for AGIs over 100k)
IRA payment deduction: $2,893 (reported on 2.9% of returns)
02644:
$2,893
Massachusetts:
$3,100
(% of AGI for various income ranges: 0.6% for AGIs $10k-25k, 0.2% for AGIs $25k-50k, 0.2% for AGIs $50k-75k, 0.1% for AGIs over 100k)
Self-employed pension: $6,333 (reported on 1.1% of returns)
Here:
$6,333
Massachusetts:
$14,516
Total itemized deductions: $19,371 (26% of AGI, reported on 54.5% of returns)
Here:
$19,371
State:
$22,573
Here:
26.1% of AGI
State:
19.5% of AGI
(% of AGI for various income ranges: 11.8% for AGIs below $10k, 22.5% for AGIs $10k-25k, 21.3% for AGIs $25k-50k, 24.0% for AGIs $50k-75k, 21.3% for AGIs $75k-100k, 17.6% for AGIs over 100k)
Charity contributions deductions: $1,703 (2% of AGI, reported on 49.9% of returns)
Here:
$1,703
State:
$3,295
Here:
2.3% of AGI
State:
2.7% of AGI
(% of AGI for various income ranges: 0.8% for AGIs below $10k, 1.2% for AGIs $10k-25k, 1.8% for AGIs $25k-50k, 1.9% for AGIs $50k-75k, 1.7% for AGIs $75k-100k, 1.5% for AGIs over 100k)
Total tax: $6,200 (reported on 82.7% of returns)
02644:
$6,200
State:
$11,494
(% of AGI for various income ranges: 3.1% for AGIs below $10k, 5.8% for AGIs $10k-25k, 7.5% for AGIs $25k-50k, 7.8% for AGIs $50k-75k, 9.0% for AGIs $75k-100k, 14.8% for AGIs over 100k)
Earned income credit: $1,581 (reported on 7.0% of returns)
Here:
$1,581
State:
$1,518
Percentage of individuals using paid preparers for their 2004 taxes: 56.2%
Here:
56%
State:
58%
(% for various income ranges: 34.9% for AGIs below $10k, 52.4% for AGIs $10k-25k, 59.3% for AGIs $25k-50k, 67.3% for AGIs $50k-75k, 62.7% for AGIs $75k-100k, 63.8% for AGIs over 100k)
Household received Food Stamps/SNAP in the past 12 months: 191 Household did not receive Food Stamps/SNAP in the past 12 months: 1,344
Women who had a birth in the past 12 months: 29 (30 now married, 0 unmarried) Women who did not have a birth in the past 12 months: 794 (269 now married, 526 unmarried)
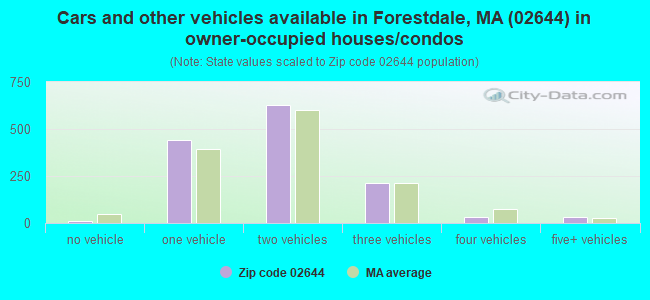
Housing units in zip code 02644 with a mortgage: 983 (118 second mortgage, 120 both second mortgage and home equity loan) Houses without a mortgage: 83
Median monthly owner costs for units with a mortgage: $2,216 Median monthly owner costs for units without a mortgage: $959
Residents with income below the poverty level in 2022:
This zip code:
5.0%
Whole state:
10.4%
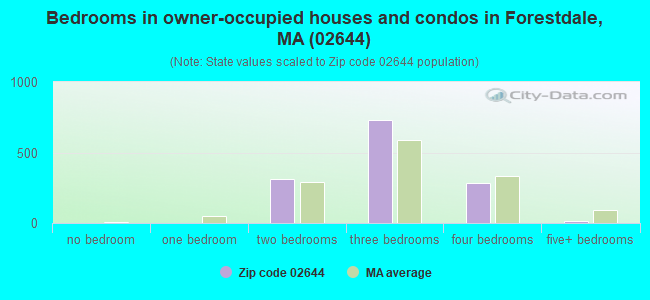
Median number of rooms in houses and condos:
Here:
6.2
State:
6.5
Median number of rooms in apartments:
Here:
4.5
State:
4.0
Notable locations in this zip code not listed on our city pages
Size of family households: 553 2-persons, 212 3-persons, 160 4-persons, 118 5-persons, 12 6-persons
Size of nonfamily households: 403 1-person, 69 2-persons, 13 4-persons
339 married couples with children.
198 single-parent households (26 men, 172 women).
98.0% of residents of 02644 zip code speak English at home.
0.6% of residents speak other Indo-European language at home (100% well).
0.6% of residents speak Asian or Pacific Island language at home (100% well).
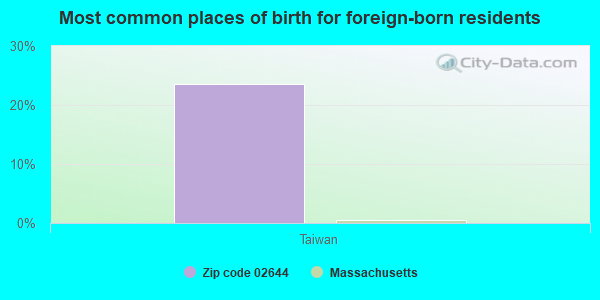
Foreign born population: 85 (2.2%) (78.6% of them are naturalized citizens)
This zip code:
2.2%
Whole state:
18.0%
24%Taiwan
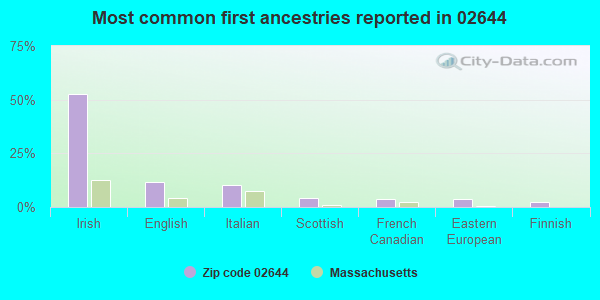
52%Irish
12%English
10%Italian
4%Scottish
4%French Canadian
4%Eastern European
2%Finnish
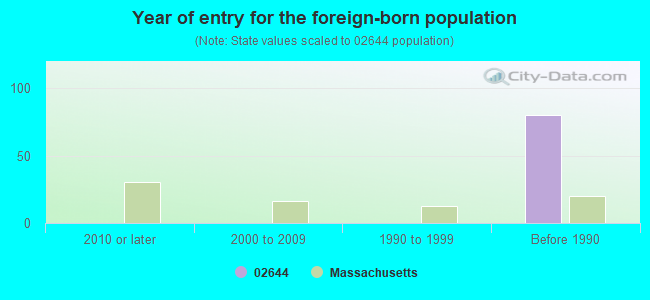
Year of entry for the foreign-born population
02010 or later
02000 to 2009
01990 to 1999
80Before 1990
Facilities with environmental interests located in this zip code:
FORESTDALE (151 ROUTE 130 in FORESTDALE, MA)
(National Center for Education Statistics) - STATE ID-261010 Organizations: SANDWICH (SCHOOL DISTRICT)
TILCON CAPALDI INC (RTE 130 in SANDWICH, MA)
AIR MINOR (AIRS/AFS) Conditionally Exempt Small Quantity Generators, less than 100 kg/month of hazardous waste (Resource Conservation and Recovery Act (tracking hazardous waste)) - notification Business SIC classification: ASPHALT PAVING MIXTURES AND BLOCKS Organizations: TILCON MASSACHUSETTS INC (CONTACT/OWNER)
WAKEBY GAS STATION (267 COTUIT RD in SANDWICH, MA)
CROCKER JUNKYARD (FORMER) (J BRADEN THOMPSON ROAD in SANDWICH, MA)
SUPERFUND (Superfund database)
HERITAGE CHRISTIAN SCHOOL (P. O. BOX 417 in FORESTDALE, MA)
COMPLIANCE ACTIVITY (Tracking inspections of insecticide, fungicide, and rodenticide, and toxic substances)
Housing units lacking complete plumbing facilities: 1.9%
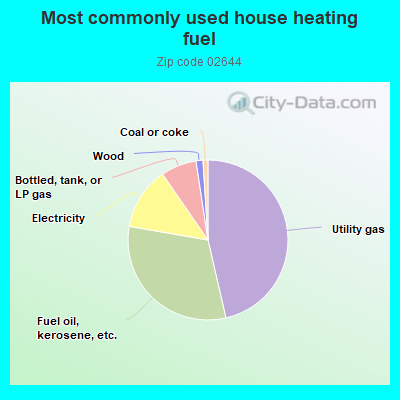
46.5%Utility gas
31.4%Fuel oil, kerosene, etc.
12.7%Electricity
7.2%Bottled, tank, or LP gas
1.4%Wood
1.0%Coal or coke
Population in 1990: 2,712. Population change in the 1990s: +1,111 (+41.0%).
Place of birth for U.S.-born residents:
This state: 2,875
Northeast: 578
Midwest: 89
South: 87
West: 96
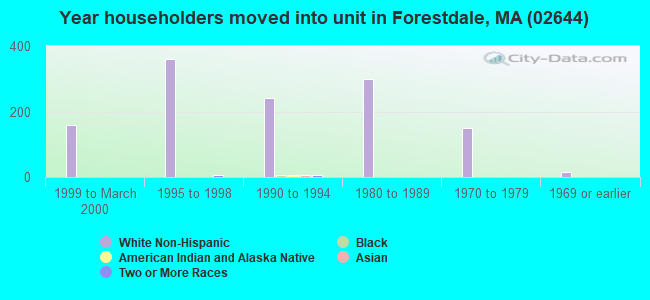
60% of the 02644 zip code residents lived in the same house 5 years ago. Out of people who lived in different houses, 54% lived in this county. Out of people who lived in different counties, 50% lived in Massachusetts.
94% of the 02644 zip code residents lived in the same house 1 year ago. Out of people who lived in different houses, 42% moved from different county within same state. Out of people who lived in different houses, 51% moved from different state. Out of people who lived in different houses, 19% moved from abroad.
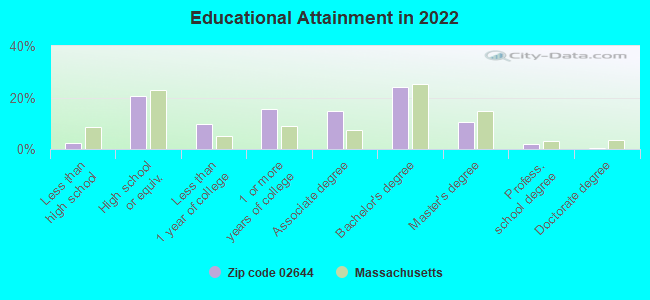
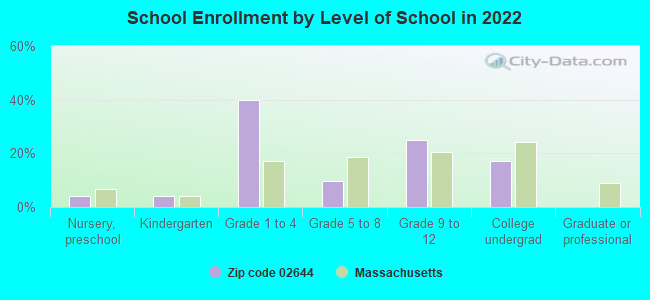
Private vs. public school enrollment:
Students in private schools in grades 1 to 8 (elementary and middle school):
Here:
0.0%
Massachusetts:
10.3%
Students in private schools in grades 9 to 12 (high school):
Here:
0.0%
Massachusetts:
12.3%
Students in private undergraduate colleges:
Here:
0.0%
Massachusetts:
51.2%
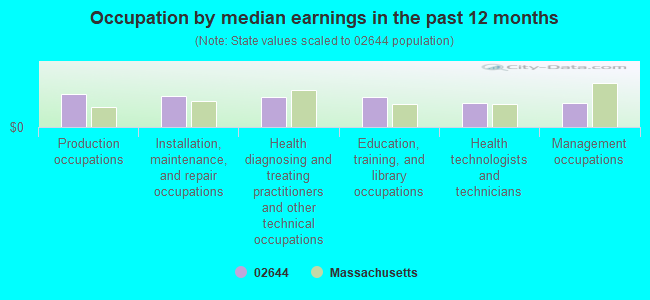
Occupation by median earnings in the past 12 months ($)
85,255Production occupations
81,153Installation, maintenance, and repair occupations
78,630Health diagnosing and treating practitioners and other technical occupations
77,415Education, training, and library occupations
63,333Health technologists and technicians
63,279Management occupations
Companies with federal contracts located in this zip code:
FALL,WILLIAM (6 KNOLL TOP RD in FORESTDALE, MA; small business) : $39,391 in 5 contractsfrom 2004 to 2006
Contracts for Technical Assistance by Army Signed by year:2000: $0; 2001: $0; 2002: $0; 2003: $0; 2004: $19,898; 2005: $6,780; 2006: $12,713.
Biggest contracts:
$12,713 with Army for Technical Assistance. Signed on 2006-07-11. Completion date: 2006-09-08.
$10,204, same as above.Signed on 2004-08-17. Completion date: 2005-08-31.
$7,143, same as above.Signed on 2004-12-29. Completion date: 2005-08-31.
$6,780, same as above.Signed on 2005-09-06. Completion date: 2006-09-08.
Top industries in this zip code by the number of employees in 2005:
Health Care and Social Assistance: Residential Mental Retardation Facilities (250-499 employees: 1 establishment)
Accommodation and Food Services: Full-Service Restaurants (20-49: 1, 1-4: 2)
Real Estate and Rental and Leasing: Passenger Car Rental (20-49: 1)
Health Care and Social Assistance: Offices of Physicians (except Mental Health Specialists) (20-49: 1)
Accommodation and Food Services: Snack and Nonalcoholic Beverage Bars (10-19: 1)
Other Services (except Public Administration): Pet Care (except Veterinary) Services (10-19: 1)
Construction: Plumbing, Heating, and Air-Conditioning Contractors (5-9: 2)
Other Services (except Public Administration): Religious Organizations (5-9: 1, 1-4: 2)
Administrative and Support and Waste Management and Remediation Services: Landscaping Services (1-4: 4)
Real Estate and Rental and Leasing: Other Commercial and Industrial Machinery and Equipment Rental and Leasing (5-9: 1)
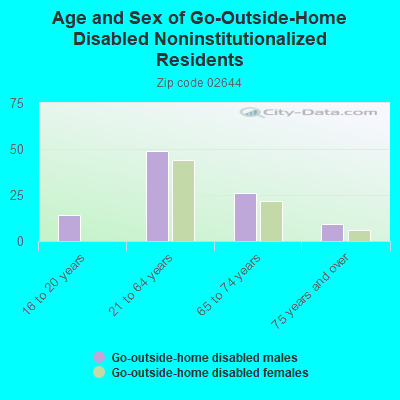
People in group quarters in 2000:
3 people in homes for the mentally retarded
Home Mortgage Disclosure Act Aggregated Statistics For Year 2009 (Based on 2 partial tracts)
A) FHA, FSA/RHS & VA Home Purchase Loans
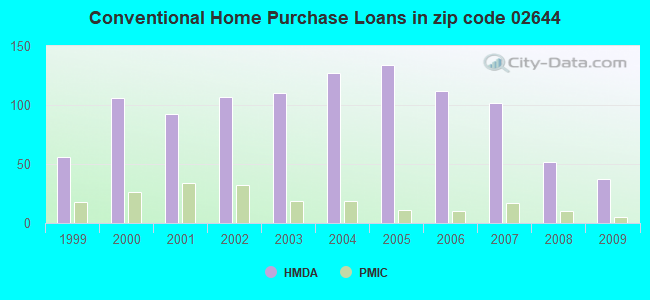
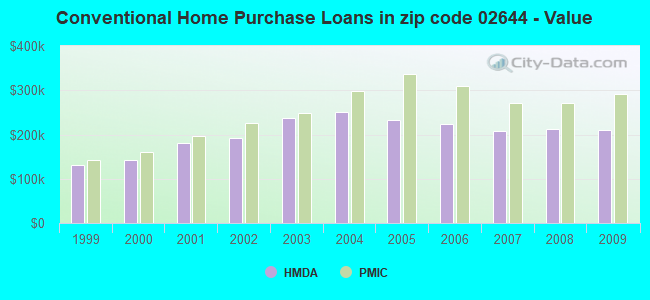
B) Conventional Home Purchase Loans
C) Refinancings
D) Home Improvement Loans
F) Non-occupant Loans on < 5 Family Dwellings (A B C & D)
Number
Average Value
Number
Average Value
Number
Average Value
Number
Average Value
Number
Average Value
LOANS ORIGINATED
28
$271,190
37
$209,718
237
$216,274
15
$97,473
18
$247,407
APPLICATIONS APPROVED, NOT ACCEPTED
0
$0
1
$146,940
8
$293,888
2
$18,370
0
$0
APPLICATIONS DENIED
6
$290,980
11
$198,625
72
$267,012
3
$9,490
4
$202,738
APPLICATIONS WITHDRAWN
4
$308,582
5
$151,904
44
$261,494
1
$9,180
2
$194,700
FILES CLOSED FOR INCOMPLETENESS
1
$249,800
1
$382,970
11
$238,033
0
$0
2
$288,835
Aggregated Statistics For Year 2008 (Based on 2 partial tracts)
A) FHA, FSA/RHS & VA Home Purchase Loans
B) Conventional Home Purchase Loans
C) Refinancings
D) Home Improvement Loans
F) Non-occupant Loans on < 5 Family Dwellings (A B C & D)
Number
Average Value
Number
Average Value
Number
Average Value
Number
Average Value
Number
Average Value
LOANS ORIGINATED
14
$256,234
52
$212,645
114
$221,133
23
$103,500
14
$196,275
APPLICATIONS APPROVED, NOT ACCEPTED
0
$0
6
$232,967
17
$274,439
3
$42,860
2
$169,905
APPLICATIONS DENIED
8
$274,028
10
$149,516
48
$297,619
8
$112,734
4
$402,490
APPLICATIONS WITHDRAWN
2
$288,380
4
$243,605
27
$257,254
2
$336,135
3
$281,643
FILES CLOSED FOR INCOMPLETENESS
0
$0
2
$161,640
5
$213,620
0
$0
0
$0
Aggregated Statistics For Year 2007 (Based on 2 partial tracts)
A) FHA, FSA/RHS & VA Home Purchase Loans
B) Conventional Home Purchase Loans
C) Refinancings
D) Home Improvement Loans
F) Non-occupant Loans on < 5 Family Dwellings (A B C & D)
G) Loans On Manufactured Home Dwelling (A B C & D)
Number
Average Value
Number
Average Value
Number
Average Value
Number
Average Value
Number
Average Value
Number
Average Value
LOANS ORIGINATED
6
$229,907
102
$207,675
144
$238,695
45
$82,717
10
$242,458
0
$0
APPLICATIONS APPROVED, NOT ACCEPTED
0
$0
13
$270,009
31
$221,483
2
$13,775
1
$214,910
1
$34,900
APPLICATIONS DENIED
0
$0
22
$229,725
112
$293,322
16
$61,246
5
$238,416
0
$0
APPLICATIONS WITHDRAWN
0
$0
5
$253,478
39
$253,926
5
$116,820
6
$244,447
0
$0
FILES CLOSED FOR INCOMPLETENESS
0
$0
0
$0
22
$274,059
4
$48,675
0
$0
0
$0
Aggregated Statistics For Year 2006 (Based on 2 partial tracts)
A) FHA, FSA/RHS & VA Home Purchase Loans
B) Conventional Home Purchase Loans
C) Refinancings
D) Home Improvement Loans
F) Non-occupant Loans on < 5 Family Dwellings (A B C & D)
G) Loans On Manufactured Home Dwelling (A B C & D)
Number
Average Value
Number
Average Value
Number
Average Value
Number
Average Value
Number
Average Value
Number
Average Value
LOANS ORIGINATED
3
$243,070
112
$223,056
234
$229,349
62
$86,848
18
$224,906
1
$27,550
APPLICATIONS APPROVED, NOT ACCEPTED
0
$0
18
$193,221
27
$210,620
6
$83,422
3
$258,990
1
$33,060
APPLICATIONS DENIED
0
$0
20
$229,738
122
$255,880
22
$106,618
9
$249,192
2
$33,520
APPLICATIONS WITHDRAWN
0
$0
8
$262,318
96
$218,761
6
$124,902
4
$177,710
0
$0
FILES CLOSED FOR INCOMPLETENESS
0
$0
3
$248,580
16
$261,457
1
$58,780
0
$0
0
$0
Aggregated Statistics For Year 2005 (Based on 2 partial tracts)
A) FHA, FSA/RHS & VA Home Purchase Loans
B) Conventional Home Purchase Loans
C) Refinancings
D) Home Improvement Loans
F) Non-occupant Loans on < 5 Family Dwellings (A B C & D)
G) Loans On Manufactured Home Dwelling (A B C & D)
Number
Average Value
Number
Average Value
Number
Average Value
Number
Average Value
Number
Average Value
Number
Average Value
LOANS ORIGINATED
5
$265,602
134
$233,719
301
$231,379
46
$109,529
22
$218,746
0
$0
APPLICATIONS APPROVED, NOT ACCEPTED
0
$0
15
$258,193
29
$262,694
6
$192,712
3
$233,887
0
$0
APPLICATIONS DENIED
2
$253,480
15
$259,601
136
$239,844
26
$102,613
3
$142,657
2
$70,715
APPLICATIONS WITHDRAWN
0
$0
21
$253,785
131
$226,326
12
$159,878
4
$226,615
0
$0
FILES CLOSED FOR INCOMPLETENESS
0
$0
1
$109,290
8
$326,146
1
$68,880
0
$0
0
$0
Aggregated Statistics For Year 2004 (Based on 2 partial tracts)
A) FHA, FSA/RHS & VA Home Purchase Loans
B) Conventional Home Purchase Loans
C) Refinancings
D) Home Improvement Loans
F) Non-occupant Loans on < 5 Family Dwellings (A B C & D)
Number
Average Value
Number
Average Value
Number
Average Value
Number
Average Value
Number
Average Value
LOANS ORIGINATED
6
$249,040
127
$250,839
320
$215,339
48
$117,421
21
$264,412
APPLICATIONS APPROVED, NOT ACCEPTED
0
$0
6
$228,070
48
$234,517
9
$57,553
3
$190,413
APPLICATIONS DENIED
0
$0
16
$305,828
111
$228,673
25
$74,133
0
$0
APPLICATIONS WITHDRAWN
0
$0
14
$224,680
121
$220,021
12
$65,589
2
$341,185
FILES CLOSED FOR INCOMPLETENESS
0
$0
6
$232,815
15
$228,988
1
$18,370
1
$165,310
Aggregated Statistics For Year 2003 (Based on 2 partial tracts)
A) FHA, FSA/RHS & VA Home Purchase Loans
B) Conventional Home Purchase Loans
C) Refinancings
D) Home Improvement Loans
E) Loans on Dwellings For 5+ Families
F) Non-occupant Loans on < 5 Family Dwellings (A B C & D)
Number
Average Value
Number
Average Value
Number
Average Value
Number
Average Value
Number
Average Value
Number
Average Value
LOANS ORIGINATED
3
$226,540
110
$237,874
737
$175,189
16
$48,388
1
$229,600
32
$203,655
APPLICATIONS APPROVED, NOT ACCEPTED
1
$195,620
15
$241,049
81
$174,632
4
$21,812
0
$0
1
$114,800
APPLICATIONS DENIED
1
$241,540
12
$189,956
112
$207,091
14
$49,003
0
$0
3
$161,333
APPLICATIONS WITHDRAWN
0
$0
15
$249,437
127
$185,350
6
$95,513
0
$0
6
$175,720
FILES CLOSED FOR INCOMPLETENESS
0
$0
3
$229,600
12
$196,308
1
$166,230
0
$0
1
$367,360
Aggregated Statistics For Year 2002 (Based on 2 partial tracts)
A) FHA, FSA/RHS & VA Home Purchase Loans
B) Conventional Home Purchase Loans
C) Refinancings
D) Home Improvement Loans
E) Loans on Dwellings For 5+ Families
F) Non-occupant Loans on < 5 Family Dwellings (A B C & D)
Number
Average Value
Number
Average Value
Number
Average Value
Number
Average Value
Number
Average Value
Number
Average Value
LOANS ORIGINATED
3
$165,923
107
$192,091
496
$160,518
27
$39,389
0
$0
26
$175,273
APPLICATIONS APPROVED, NOT ACCEPTED
1
$172,660
10
$204,803
54
$148,220
16
$39,434
1
$587,780
1
$119,390
APPLICATIONS DENIED
2
$185,060
6
$236,335
63
$160,501
14
$38,507
0
$0
1
$75,310
APPLICATIONS WITHDRAWN
0
$0
6
$225,927
73
$166,683
8
$77,375
0
$0
1
$236,030
FILES CLOSED FOR INCOMPLETENESS
1
$198,370
4
$154,980
15
$150,434
1
$12,860
0
$0
2
$140,055
Aggregated Statistics For Year 2001 (Based on 2 partial tracts)
A) FHA, FSA/RHS & VA Home Purchase Loans
B) Conventional Home Purchase Loans
C) Refinancings
D) Home Improvement Loans
F) Non-occupant Loans on < 5 Family Dwellings (A B C & D)
Number
Average Value
Number
Average Value
Number
Average Value
Number
Average Value
Number
Average Value
LOANS ORIGINATED
8
$167,379
92
$181,624
442
$144,883
31
$26,959
16
$124,616
APPLICATIONS APPROVED, NOT ACCEPTED
0
$0
14
$147,797
48
$106,343
6
$38,878
3
$160,413
APPLICATIONS DENIED
2
$150,160
5
$156,862
75
$122,282
13
$26,987
2
$125,820
APPLICATIONS WITHDRAWN
2
$135,925
6
$150,923
84
$144,539
9
$49,186
3
$197,763
FILES CLOSED FOR INCOMPLETENESS
0
$0
1
$143,270
13
$148,781
2
$52,810
0
$0
Aggregated Statistics For Year 2000 (Based on 2 partial tracts)
A) FHA, FSA/RHS & VA Home Purchase Loans
B) Conventional Home Purchase Loans
C) Refinancings
D) Home Improvement Loans
F) Non-occupant Loans on < 5 Family Dwellings (A B C & D)
Number
Average Value
Number
Average Value
Number
Average Value
Number
Average Value
Number
Average Value
LOANS ORIGINATED
11
$150,200
106
$142,187
129
$112,294
38
$21,558
10
$148,597
APPLICATIONS APPROVED, NOT ACCEPTED
1
$128,580
10
$155,761
18
$85,616
14
$21,189
1
$133,170
APPLICATIONS DENIED
2
$133,170
13
$184,245
51
$86,942
27
$29,627
6
$122,453
APPLICATIONS WITHDRAWN
1
$157,960
9
$150,413
54
$102,316
4
$17,910
0
$0
FILES CLOSED FOR INCOMPLETENESS
1
$107,450
3
$178,783
4
$75,538
1
$18,370
0
$0
Aggregated Statistics For Year 1999 (Based on 1 partial tract)
A) FHA, FSA/RHS & VA Home Purchase Loans
B) Conventional Home Purchase Loans
C) Refinancings
D) Home Improvement Loans
F) Non-occupant Loans on < 5 Family Dwellings (A B C & D)
Detailed PMIC statistics for the following Tracts:0136.00
2002 - 2018 National Fire Incident Reporting System (NFIRS) incidents
According to the data from the years 2002 - 2018 the average number of fire incidents per year is 13. The highest number of fires - 22 took place in 2003, and the least - 1 in 2015. The data has a decreasing trend.
When looking into fire subcategories, the most incidents belonged to: Structure Fires (64.2%), and Outside Fires (26.2%).
Fire incident types reported to NFIRS in Zip Code 02644


 Nearest zip codes: 02542, 02563, 02649, 02537, 02561, 02635.


 According to the data from the years 2002 - 2018 the average number of fire incidents per year is 13. The highest number of fires - 22 took place in 2003, and the least - 1 in 2015. The data has a decreasing trend.
 When looking into fire subcategories, the most incidents belonged to: Structure Fires (64.2%), and Outside Fires (26.2%).