Estimated zip code population in 2022: 5,303 Zip code population in 2010: 4,907 Zip code population in 2000: 5,123
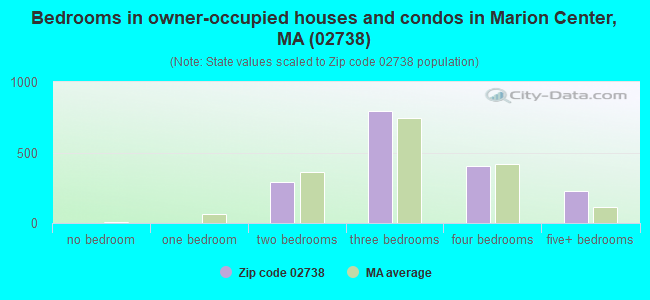
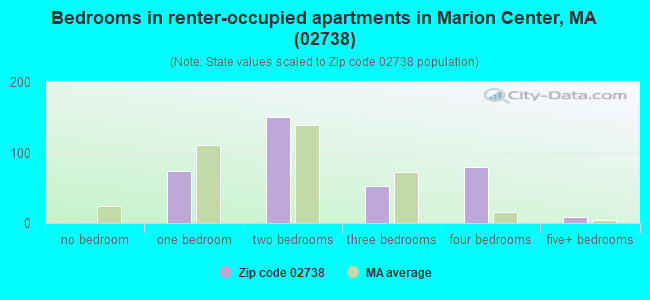
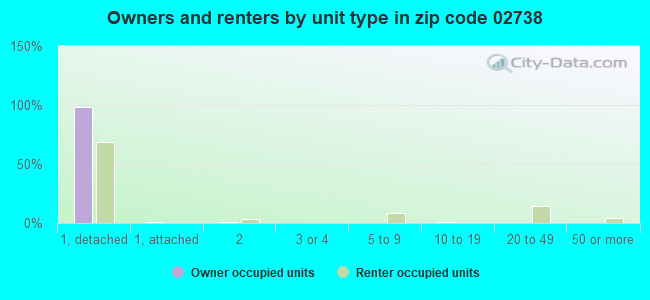
Houses and condos: 2,520 Renter-occupied apartments: 366
% of renters here:
18%
State:
38%
March 2022 cost of living index in zip code 02738: 132.9 (high, U.S. average is 100)
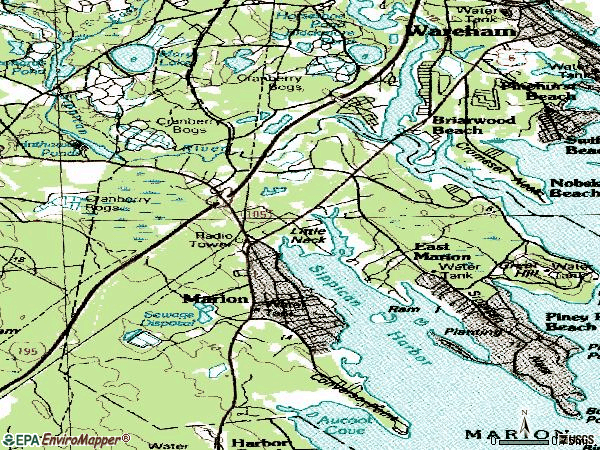
Land area: 14.0 sq. mi. Water area: 6.0 sq. mi.
Population density: 379 people per square mile
(very low).
OSM Map
Google Map
MSN Map
OSM Map
General Map
Google Map
MSN Map
OSM Map
Google Map
MSN Map
OSM Map
Google Map
MSN Map
Please wait while loading the map...
Real estate property taxes paid for housing units in 2022:
This zip code:
0.9% ($5,247)
Massachusetts:
1.0% ($5,536)
Median real estate property taxes paid for housing units with mortgages in 2022: $5,035 (0.8%) Median real estate property taxes paid for housing units with no mortgage in 2022: $5,582 (0.9%)
Business Search- 14 Million verified businesses
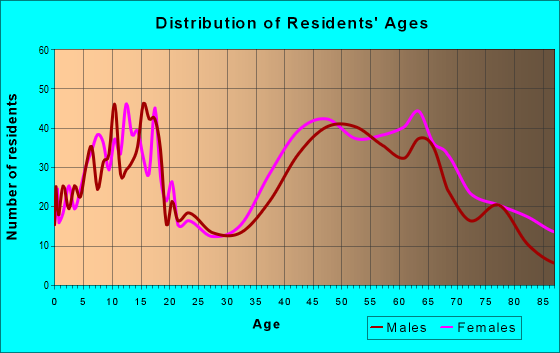
Males: 2,672
(50.4%)
Females: 2,631
(49.6%)
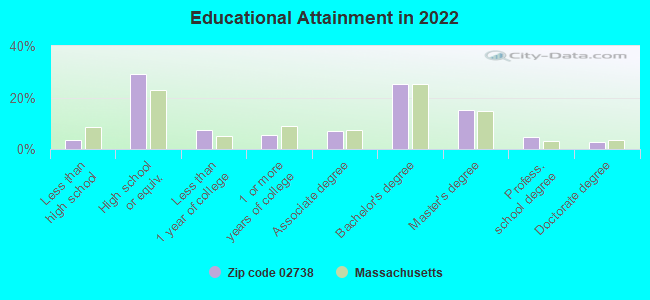
For population 25 years and over in 02738:
High school or higher: 96.7%
Bachelor's degree or higher: 47.9%
Graduate or professional degree: 22.7%
Unemployed: 4.3%
Mean travel time to work (commute): 34.5 minutes
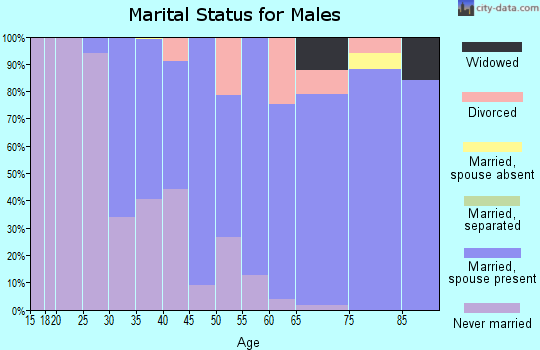
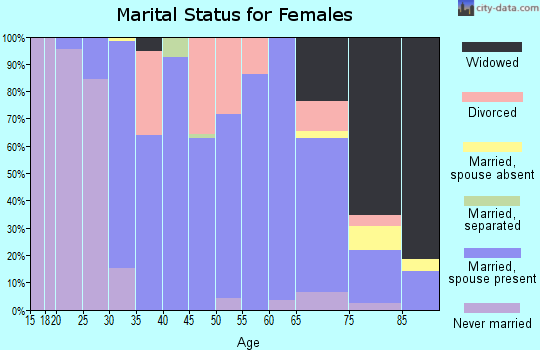
For population 15 years and over in 02738:
Never married: 30.4%
Now married: 50.3%
Separated: 1.7%
Widowed: 6.2%
Divorced: 11.3%
Zip code 02738 compared to state average:
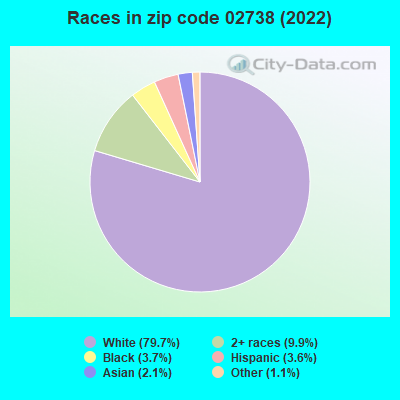
Black race population percentage below state average.
Hispanic race population percentage significantly below state average.
Median age significantly above state average.
Foreign-born population percentage significantly below state average.
Renting percentage below state average.
Length of stay since moving in significantly above state average.
Estimated median house/condo value in 2022: $614,922
02738:
$614,922
Massachusetts:
$534,700
According to our research of Massachusetts and other state lists, there was 1 registered sex offender living in 02738 zip code as of April 25, 2024. The ratio of all residents to sex offenders in zip code 02738 is 5,085 to 1. The ratio of registered sex offenders to all residents in this zip code is much lower than the state average.
Median resident age:
This zip code:
50.5 years
Massachusetts median age:
40.3 years
Average household size:
This zip code:
2.4 people
Massachusetts:
2.4 people
Averages for the 2020 tax year for zip code 02738, filed in 2021:
Average Adjusted Gross Income (AGI) in 2020: $161,629 (Individual Income Tax Returns)
Here:
$161,629
State:
$105,130
Salary/wage: $96,933 (reported on 74.9% of returns)
Here:
$96,933
State:
$82,951
(% of AGI for various income ranges: 1103.1% for AGIs below $25k, 3325.0% for AGIs $25k-50k, 6161.3% for AGIs $50k-75k, 9484.4% for AGIs $75k-100k, 19306.7% for AGIs $100k-200k, 93070.0% for AGIs over 200k)
Taxable interest for individuals: $2,299 (reported on 44.1% of returns)
This zip code:
$2,299
Massachusetts:
$2,361
(% of AGI for various income ranges: 22.4% for AGIs below $25k, 24.7% for AGIs $25k-50k, 50.0% for AGIs $50k-75k, 49.4% for AGIs $75k-100k, 137.0% for AGIs $100k-200k, 1842.5% for AGIs over 200k)
Ordinary dividends: $27,771 (reported on 36.9% of returns)
Here:
$27,771
State:
$10,365
(% of AGI for various income ranges: 108.3% for AGIs below $25k, 148.4% for AGIs $25k-50k, 261.3% for AGIs $50k-75k, 393.1% for AGIs $75k-100k, 1164.3% for AGIs $100k-200k, 20514.2% for AGIs over 200k)
Net capital gain/loss in AGI: +$136,173 (reported on 33.6% of returns)
Here:
+$136,173
State:
+$48,178
(% of AGI for various income ranges: 35.2% for AGIs below $25k, 135.9% for AGIs $25k-50k, 212.6% for AGIs $50k-75k, 466.9% for AGIs $75k-100k, 1435.7% for AGIs $100k-200k, 107237.5% for AGIs over 200k)
Profit/loss from business: +$25,604 (reported on 18.6% of returns)
Here:
+$25,604
State:
+$20,792
(% of AGI for various income ranges: 122.1% for AGIs below $25k, 166.9% for AGIs $25k-50k, 471.7% for AGIs $50k-75k, 639.4% for AGIs $75k-100k, 1006.7% for AGIs $100k-200k, 6589.2% for AGIs over 200k)
Taxable individual retirement arrangement distribution: $28,448 (reported on 14.9% of returns)
02738:
$28,448
Massachusetts:
$22,790
(% of AGI for various income ranges: 94.3% for AGIs below $25k, 218.1% for AGIs $25k-50k, 425.2% for AGIs $50k-75k, 653.1% for AGIs $75k-100k, 1537.0% for AGIs $100k-200k, 3990.8% for AGIs over 200k)
Self-employed (Keogh) retirement plans: $26,500 (reported on 1.4% of returns)
02738:
$26,500
Massachusetts:
$26,868
(% of AGI for various income ranges: 883.3% for AGIs over 200k)
Total itemized deductions: $46,389 (reported on 18.0% of returns)
Here:
$46,389
State:
$36,722
(% of AGI for various income ranges: 191.7% for AGIs below $25k, 312.2% for AGIs $25k-50k, 572.6% for AGIs $50k-75k, 1091.9% for AGIs $75k-100k, 1542.7% for AGIs $100k-200k, 12575.0% for AGIs over 200k)
Charity contributions: $20,019 (reported on 14.6% of returns)
Here:
$20,019
State:
$12,529
(% of AGI for various income ranges: 11.2% for AGIs below $25k, 12.8% for AGIs $25k-50k, 77.0% for AGIs $50k-75k, 60.0% for AGIs $75k-100k, 206.0% for AGIs $100k-200k, 6357.5% for AGIs over 200k)
Taxes paid: $10,434 (reported on 18.0% of returns)
02738:
$10,434
State:
$8,782
(% of AGI for various income ranges: 50.0% for AGIs below $25k, 66.9% for AGIs $25k-50k, 178.3% for AGIs $50k-75k, 268.1% for AGIs $75k-100k, 459.7% for AGIs $100k-200k, 2406.7% for AGIs over 200k)
Earned income credit: $1,894 (reported on 5.8% of returns)
Here:
$1,894
State:
$1,909
(% of AGI for various income ranges: 44.8% for AGIs below $25k, 41.9% for AGIs $25k-50k)
Percentage of individuals using paid preparers for their 2020 taxes: 93.6%
Here:
94%
State:
92%
(% for various income ranges: 92.2% for AGIs below $25k, 91.3% for AGIs $25k-50k, 94.4% for AGIs $50k-75k, 92.9% for AGIs $75k-100k, 95.2% for AGIs $100k-200k, 95.6% for AGIs over 200k)
Averages for the 2012 tax year for zip code 02738, filed in 2013:
Average Adjusted Gross Income (AGI) in 2012: $108,172 (Individual Income Tax Returns)
Here:
$108,172
State:
$81,425
Salary/wage: $77,890 (reported on 77.7% of returns)
Here:
$77,890
State:
$64,752
(% of AGI for various income ranges: 64.0% for AGIs below $25k, 70.1% for AGIs $25k-50k, 66.6% for AGIs $50k-75k, 61.2% for AGIs $75k-100k, 68.8% for AGIs $100k-200k, 45.3% for AGIs over 200k)
Taxable interest for individuals: $2,474 (reported on 50.6% of returns)
This zip code:
$2,474
Massachusetts:
$2,136
(% of AGI for various income ranges: 2.2% for AGIs below $25k, 1.2% for AGIs $25k-50k, 1.2% for AGIs $50k-75k, 1.4% for AGIs $75k-100k, 0.8% for AGIs $100k-200k, 1.2% for AGIs over 200k)
Ordinary dividends: $19,442 (reported on 39.4% of returns)
Here:
$19,442
State:
$9,473
(% of AGI for various income ranges: 4.6% for AGIs below $25k, 4.1% for AGIs $25k-50k, 3.9% for AGIs $50k-75k, 3.6% for AGIs $75k-100k, 3.7% for AGIs $100k-200k, 10.2% for AGIs over 200k)
Net capital gain/loss in AGI: +$33,641 (reported on 32.3% of returns)
Here:
+$33,641
State:
+$31,437
(% of AGI for various income ranges: 0.6% for AGIs below $25k, 1.6% for AGIs $25k-50k, 1.5% for AGIs $50k-75k, 2.0% for AGIs $75k-100k, 3.0% for AGIs $100k-200k, 17.5% for AGIs over 200k)
Profit/loss from business: +$27,645 (reported on 20.3% of returns)
Here:
+$27,645
State:
+$20,662
(% of AGI for various income ranges: 9.4% for AGIs below $25k, 7.8% for AGIs $25k-50k, 2.6% for AGIs $50k-75k, 5.2% for AGIs $75k-100k, 4.7% for AGIs $100k-200k, 5.2% for AGIs over 200k)
Taxable individual retirement arrangement distribution: $28,123 (reported on 17.5% of returns)
02738:
$28,123
Massachusetts:
$18,892
(% of AGI for various income ranges: 5.2% for AGIs below $25k, 4.1% for AGIs $25k-50k, 4.5% for AGIs $50k-75k, 6.4% for AGIs $75k-100k, 5.7% for AGIs $100k-200k, 3.7% for AGIs over 200k)
Self-employment retirement plans: $16,650 (reported on 2.4% of returns)
02738:
$16,650
Massachusetts:
$20,669
Total itemized deductions: $35,076 (20% of AGI, reported on 51.4% of returns)
Here:
$35,076
State:
$28,907
Here:
19.7% of AGI
State:
18.2% of AGI
(% of AGI for various income ranges: 25.5% for AGIs below $25k, 14.9% for AGIs $25k-50k, 18.5% for AGIs $50k-75k, 17.5% for AGIs $75k-100k, 17.1% for AGIs $100k-200k, 15.8% for AGIs over 200k)
Charity contributions: $6,138 (reported on 44.6% of returns)
Here:
$6,138
State:
$4,208
(% of AGI for various income ranges: 0.9% for AGIs below $25k, 1.0% for AGIs $25k-50k, 1.1% for AGIs $50k-75k, 1.4% for AGIs $75k-100k, 1.6% for AGIs $100k-200k, 3.7% for AGIs over 200k)
Taxes paid: $15,212 (reported on 51.4% of returns)
02738:
$15,212
State:
$13,303
(% of AGI for various income ranges: 5.9% for AGIs below $25k, 4.6% for AGIs $25k-50k, 6.5% for AGIs $50k-75k, 6.5% for AGIs $75k-100k, 7.7% for AGIs $100k-200k, 7.6% for AGIs over 200k)
Earned income credit: $1,500 (reported on 7.6% of returns)
Here:
$1,500
State:
$1,971
(% of AGI for various income ranges: 2.7% for AGIs below $25k, 0.4% for AGIs $25k-50k)
Percentage of individuals using paid preparers for their 2012 taxes: 62.2%
Here:
62%
State:
56%
(% for various income ranges: 50.7% for AGIs below $25k, 56.8% for AGIs $25k-50k, 57.6% for AGIs $50k-75k, 69.2% for AGIs $75k-100k, 72.9% for AGIs $100k-200k, 81.5% for AGIs over 200k)
Averages for the 2004 tax year for zip code 02738, filed in 2005:
Average Adjusted Gross Income (AGI) in 2004: $86,502 (Individual Income Tax Returns)
Here:
$86,502
State:
$62,877
Salary/wage: $64,673 (reported on 77.8% of returns)
Here:
$64,673
State:
$52,969
(% of AGI for various income ranges: 396.5% for AGIs below $10k, 59.3% for AGIs $10k-25k, 73.6% for AGIs $25k-50k, 72.8% for AGIs $50k-75k, 73.2% for AGIs $75k-100k, 50.8% for AGIs over 100k)
Taxable interest for individuals: $3,278 (reported on 66.6% of returns)
This zip code:
$3,278
Massachusetts:
$1,945
(% of AGI for various income ranges: 50.0% for AGIs below $10k, 4.5% for AGIs $10k-25k, 2.4% for AGIs $25k-50k, 1.7% for AGIs $50k-75k, 1.4% for AGIs $75k-100k, 2.6% for AGIs over 100k)
Taxable dividends: $10,447 (reported on 44.3% of returns)
Here:
$10,447
State:
$5,323
(% of AGI for various income ranges: 45.3% for AGIs below $10k, 7.1% for AGIs $10k-25k, 2.3% for AGIs $25k-50k, 3.0% for AGIs $50k-75k, 2.5% for AGIs $75k-100k, 6.3% for AGIs over 100k)
Net capital gain/loss: +$27,571 (reported on 38.5% of returns)
Here:
+$27,571
State:
+$20,377
(% of AGI for various income ranges: 15.9% for AGIs below $10k, 4.5% for AGIs $10k-25k, 1.9% for AGIs $25k-50k, 1.6% for AGIs $50k-75k, 3.1% for AGIs $75k-100k, 16.7% for AGIs over 100k)
Profit/loss from business: +$20,564 (reported on 21.5% of returns)
Here:
+$20,564
State:
+$17,837
(% of AGI for various income ranges: 34.3% for AGIs below $10k, 7.7% for AGIs $10k-25k, 7.0% for AGIs $25k-50k, 4.6% for AGIs $50k-75k, 4.1% for AGIs $75k-100k, 4.9% for AGIs over 100k)
IRA payment deduction: $3,564 (reported on 3.7% of returns)
02738:
$3,564
Massachusetts:
$3,100
(% of AGI for various income ranges: 0.5% for AGIs $25k-50k, 0.3% for AGIs $50k-75k, 0.2% for AGIs $75k-100k, 0.1% for AGIs over 100k)
Self-employed pension: $13,525 (reported on 2.4% of returns)
Here:
$13,525
Massachusetts:
$14,516
Total itemized deductions: $26,500 (19% of AGI, reported on 52.7% of returns)
Here:
$26,500
State:
$22,573
Here:
18.7% of AGI
State:
19.5% of AGI
(% of AGI for various income ranges: 88.2% for AGIs below $10k, 21.9% for AGIs $10k-25k, 17.4% for AGIs $25k-50k, 19.3% for AGIs $50k-75k, 21.1% for AGIs $75k-100k, 14.3% for AGIs over 100k)
Charity contributions deductions: $4,414 (3% of AGI, reported on 48.1% of returns)
Here:
$4,414
State:
$3,295
Here:
3.0% of AGI
State:
2.7% of AGI
(% of AGI for various income ranges: 4.1% for AGIs below $10k, 1.7% for AGIs $10k-25k, 1.5% for AGIs $25k-50k, 1.8% for AGIs $50k-75k, 2.1% for AGIs $75k-100k, 2.8% for AGIs over 100k)
Total tax: $17,227 (reported on 81.6% of returns)
02738:
$17,227
State:
$11,494
(% of AGI for various income ranges: 14.2% for AGIs below $10k, 4.9% for AGIs $10k-25k, 8.0% for AGIs $25k-50k, 8.8% for AGIs $50k-75k, 9.9% for AGIs $75k-100k, 19.8% for AGIs over 100k)
Earned income credit: $1,388 (reported on 5.5% of returns)
Here:
$1,388
State:
$1,518
Percentage of individuals using paid preparers for their 2004 taxes: 64.3%
Here:
64%
State:
58%
(% for various income ranges: 52.7% for AGIs below $10k, 57.1% for AGIs $10k-25k, 62.0% for AGIs $25k-50k, 67.7% for AGIs $50k-75k, 70.0% for AGIs $75k-100k, 76.4% for AGIs over 100k)
Household received Food Stamps/SNAP in the past 12 months: 173 Household did not receive Food Stamps/SNAP in the past 12 months: 1,888
Women who had a birth in the past 12 months: 47 (50 now married, 0 unmarried) Women who did not have a birth in the past 12 months: 857 (277 now married, 582 unmarried)
Housing units in zip code 02738 with a mortgage: 991 (116 second mortgage, 106 both second mortgage and home equity loan) Houses without a mortgage: 142
Median monthly owner costs for units with a mortgage: $2,540 Median monthly owner costs for units without a mortgage: $998
Residents with income below the poverty level in 2022:
This zip code:
5.8%
Whole state:
10.4%
Residents with income below 50% of the poverty level in 2022:
This zip code:
1.1%
Whole state:
5.1%
Median number of rooms in houses and condos:
Here:
6.6
State:
6.5
Median number of rooms in apartments:
Here:
5.0
State:
4.0
Notable locations in this zip code not listed on our city pages
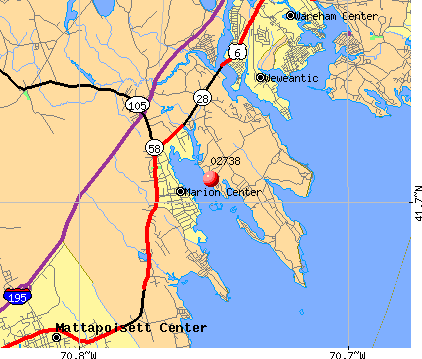
Notable locations in zip code 02738: Wareham Plaza (A), Gateway Shopping Plaza (B), Kittanset Golf Club (C), Bird Island Light (D), Marion Fire Department Headquarters (E), Sippican Historical Society Building (F), Marion Town Hall (G). Display/hide their locations on the map
Churches in zip code 02738 include: Saint Ritas Church (A), Saint Gabriels Church (B), Marion United Methodist Church (C), First Congregational Church (D). Display/hide their locations on the map
In group quarters: 295 (-1 institutionalized population)
Size of family households: 625 2-persons, 265 3-persons, 399 4-persons, 99 5-persons
Size of nonfamily households: 598 1-person, 72 2-persons, 17 3-persons
576 married couples with children.
221 single-parent households (143 men, 78 women).
93.3% of residents of 02738 zip code speak English at home.
1.2% of residents speak Spanish at home (100% very well).
4.4% of residents speak other Indo-European language at home (42% very well, 5% well, 54% not well).
1.1% of residents speak Asian or Pacific Island language at home (60% not well, 40% not at all).
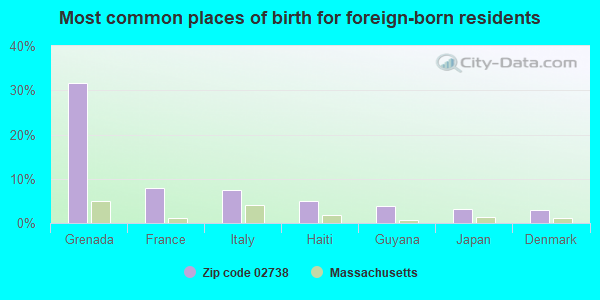
Foreign born population: 316 (6.0%) (53.2% of them are naturalized citizens)
This zip code:
6.0%
Whole state:
18.0%
32%Grenada
8%France
8%Italy
5%Haiti
4%Guyana
3%Japan
3%Denmark
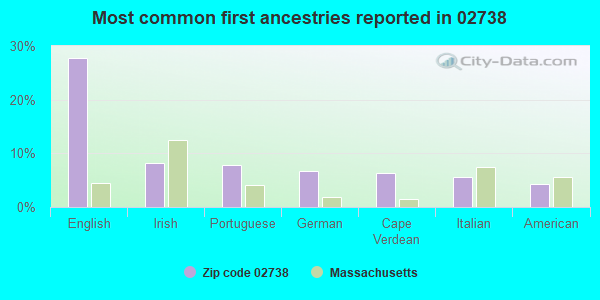
28%English
8%Irish
8%Portuguese
7%German
6%Cape Verdean
6%Italian
4%American
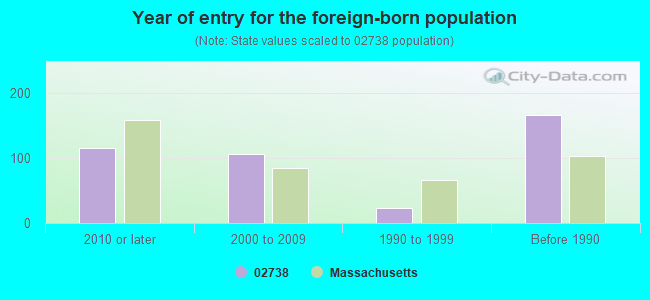
Year of entry for the foreign-born population
1162010 or later
1062000 to 2009
231990 to 1999
166Before 1990
Facilities with environmental interests located in this zip code:
MARION WASTE WATER TREATMENT FACILITY (BENSON BROOK ROAD in MARION, MA)
(Integrated Compliance Information System) - ICIS-01-1997-0051, FORMAL ENFORCEMENT ACTION National Pollutant Discharge Elimination System MAJOR (Tracking pollutant discharge elimination systems) - permit - ICIS-, ENFORCEMENT/COMPLIANCE ACTIVITY, ICIS-01-2004-2003, FORMAL ENFORCEMENT ACTION Business SIC classification: SEWERAGE SYSTEMS Organizations: MARION TOWN OF STP (CONTACT/OPERATOR)
, MARION, TOWN OF (CONTACT/OWNER)
Alternative names: MARION TOWN OF STP, MARION W W T F
LOCKHEED MARTIN SIPPICAN INC (7 BARNABAS ROAD in MARION, MA)
AIR MINOR (AIRS/AFS) CRITERIA AND HAZARDOUS AIR POLLUTANT INVENTORY (Inventory of air pollution sources) HAZARDOUS WASTE BIENNIAL REPORTER (Resource Conservation and Recovery Act (tracking hazardous waste)) Large Quantity Generators, more that 1000 kg of hazardous waste/month (Resource Conservation and Recovery Act (tracking hazardous waste)) - notification TRI REPORTER (Tracking of toxic chemicals releasing facilities) Business SIC classification: PRINTED CIRCUIT BOARDS; SEARCH, DETECTION, NAVIGATION, GUIDANCE, AERONAUTICAL, AND NAUTICAL SYSTEMS AND INSTRUMENTS
MARION GARAGE (622 MILL ST in MARION, MA)
(Resource Conservation and Recovery Act (tracking hazardous waste)) Organizations: ALLEN LADNER (CONTACT/OWNER)
BURR BROTHERS BOATS INC (309 FRONT ST in MARION, MA)
Small Quantity Generators, between 100 kg and 1000 kg of hazardous waste/month (Resource Conservation and Recovery Act (tracking hazardous waste)) - notification
MARION (TOWN OF in MARION, MA)
AIR MINOR (AIRS/AFS) Business SIC classification: GENERAL GOVERNMENT
MARION WASTEWATER TREAT PLANT (BENSON BROOK ROAD in MARION, MA)
National Pollutant Discharge Elimination System NON-MAJOR (Tracking pollutant discharge elimination systems) - permit Alternative names: MARION WASTEWATATER TREATMENT
NORMANS AUTO BODY SHOP INC (133 WAREHAM ST in MARION, MA)
Conditionally Exempt Small Quantity Generators, less than 100 kg/month of hazardous waste (Resource Conservation and Recovery Act (tracking hazardous waste)) - notification
MARION LANDFILL (BENSON BROOK STREET in MARION, MA)
CRITERIA AND HAZARDOUS AIR POLLUTANT INVENTORY (Inventory of air pollution sources) Business SIC classification: REFUSE SYSTEMS Business NAICS classification: SOLID WASTE LANDFILL.
Housing units lacking complete plumbing facilities: 0.3% Housing units lacking complete kitchen facilities: 0.3%
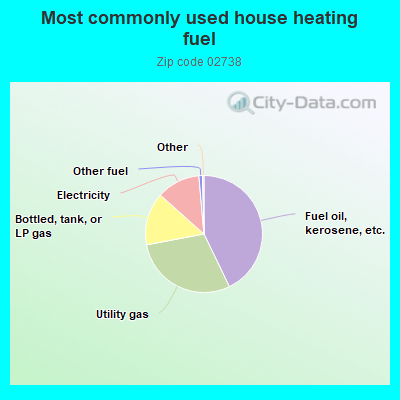
42.9%Fuel oil, kerosene, etc.
29.2%Utility gas
14.6%Bottled, tank, or LP gas
12.0%Electricity
1.0%Other fuel
Population in 1990: 4,496. Population change in the 1990s: +627 (+13.9%).
Place of birth for U.S.-born residents:
This state: 3,237
Northeast: 914
Midwest: 259
South: 294
West: 174
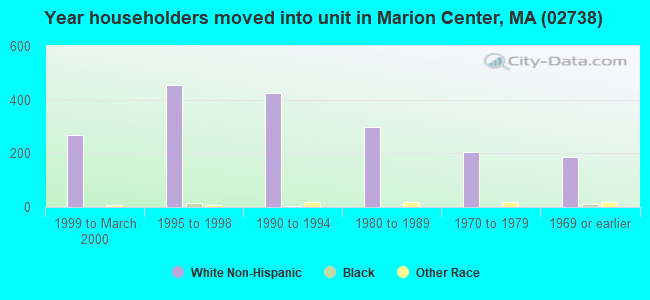
60% of the 02738 zip code residents lived in the same house 5 years ago. Out of people who lived in different houses, 45% lived in this county. Out of people who lived in different counties, 50% lived in Massachusetts.
91% of the 02738 zip code residents lived in the same house 1 year ago. Out of people who lived in different houses, 5% moved from this county. Out of people who lived in different houses, 56% moved from different county within same state. Out of people who lived in different houses, 23% moved from different state. Out of people who lived in different houses, 25% moved from abroad.
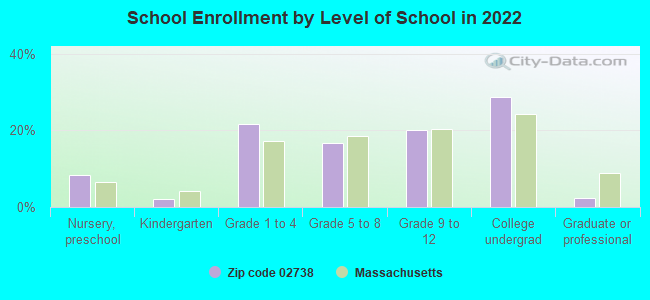
Private vs. public school enrollment:
Students in private schools in grades 1 to 8 (elementary and middle school):
Here:
0.0%
Massachusetts:
10.3%
Students in private schools in grades 9 to 12 (high school): 82
Here:
31.0%
Massachusetts:
12.3%
Students in private undergraduate colleges: 231
Here:
61.8%
Massachusetts:
51.2%
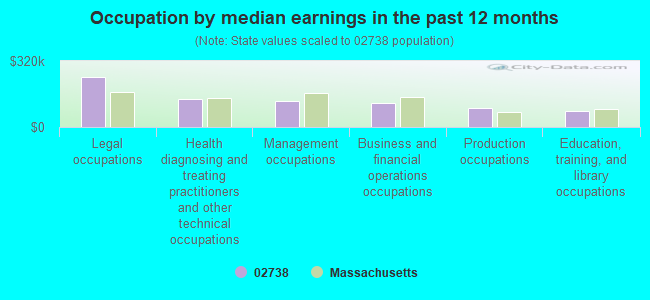
Occupation by median earnings in the past 12 months ($)
240,064Legal occupations
135,841Health diagnosing and treating practitioners and other technical occupations
124,002Management occupations
114,411Business and financial operations occupations
90,842Production occupations
79,352Education, training, and library occupations
Companies with federal contracts located in this zip code:
LOCKHEED MARTIN SIPPICAN (7 BARNABAS RD in MARION, MA; small business) : $147,396,800 in 551 contractsfrom 1999 to 2006
Contracts for Launchers, Torpedo and Depth Charge, Miscellaneous Communication Equipment, Weapons -- Engineering Development (R&D), Armament Training Devices, and moreby Navy, Army, National Oceanic and Atmospheric Administration/Under Secretary for Oceans and Atmosphere, Defense Logistics Agency, and others Signed by year:2000: $18,768,072; 2001: $21,088,190; 2002: $16,853,777; 2003: $17,467,046; 2004: $19,145,968; 2005: $30,401,223; 2006: $21,424,554.
Biggest contracts:
$14,885,924 with Navy for Launchers, Torpedo and Depth Charge. Signed on 2005-02-07. Completion date: 2012-02-07.
$13,627,911, same as above.Signed on 2006-04-04. Completion date: 2012-02-07.
$6,937,670 with Navy for Miscellaneous Communication Equipment. Signed on 2005-01-31. Completion date: 2006-04-30.
$4,461,649, same as above.Signed on 2005-12-09. Completion date: 2006-12-31.
QUADRANT CORP (340 FRONT ST in MARION, MA; small business) : $73,777 in 2 contractsin 2003
$73,777 with Navy for Installation of Equipment -- Automatic Data Processing Equipment (Including Firmware), Software, Supplies and Support Equipment. Taking place in MD. Signed on 2003-09-08. Completion date: 2003-09-28.
$0, same as above.Signed on 2003-09-08. Completion date: 2003-09-28.
CLEARWATER SERVICES, LLC (15 CREEK RD in MARION, MA; small business) : $14,065 in 3 contractsfrom 2000 to 2001
$14,660 with Navy for Maintenance, Repair or Alteration of Real Property -- Miscellaneous Buildings. Taking place in CT. Signed on 2000-09-22. Completion date: 2000-12-06.
$0 with U.S. Army Corps of Engineers - civil program financing only for Other Professional Services. Taking place in CT. Signed on 2001-10-31. Completion date: 2001-10-18.
-$595, same as above.Signed on 2001-10-31. Completion date: 2001-10-18.
Top industries in this zip code by the number of employees in 2005:
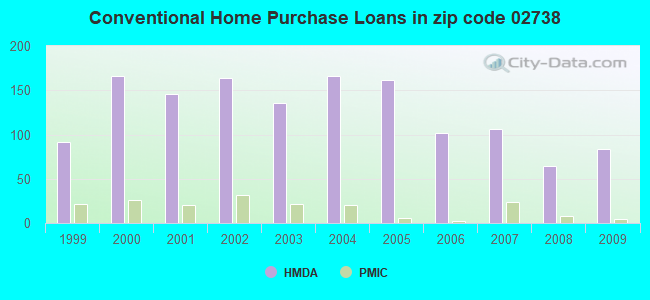
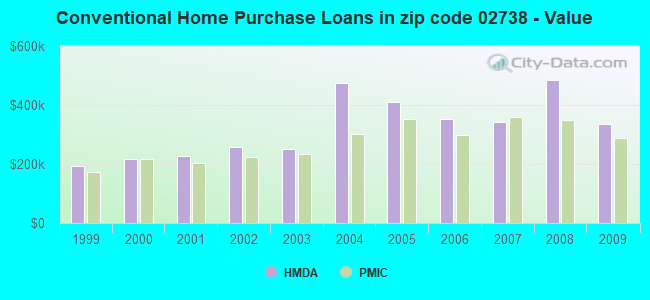
Detailed PMIC statistics for the following Tracts:5611.00
2002 - 2018 National Fire Incident Reporting System (NFIRS) incidents
According to the data from the years 2002 - 2018 the average number of fire incidents per year is 13. The highest number of reported fire incidents - 28 took place in 2017, and the least - 1 in 2008. The data has a growing trend.
When looking into fire subcategories, the most reports belonged to: Structure Fires (43.3%), and Outside Fires (30.4%).
Fire incident types reported to NFIRS in Zip Code 02738


 Nearest zip codes: 02576, 02739, 02571, 02770, 02558, 02553.


 According to the data from the years 2002 - 2018 the average number of fire incidents per year is 13. The highest number of reported fire incidents - 28 took place in 2017, and the least - 1 in 2008. The data has a growing trend.
 When looking into fire subcategories, the most reports belonged to: Structure Fires (43.3%), and Outside Fires (30.4%).