Estimated zip code population in 2022: 605 Zip code population in 2010: 341 Zip code population in 2000: 356
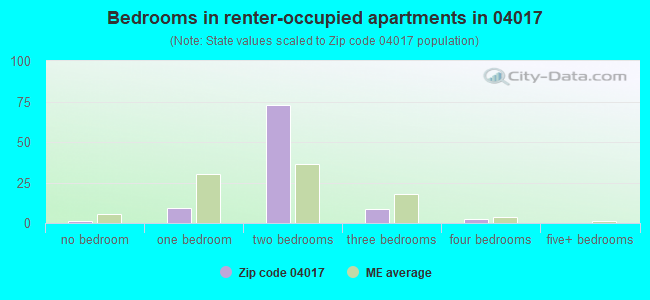
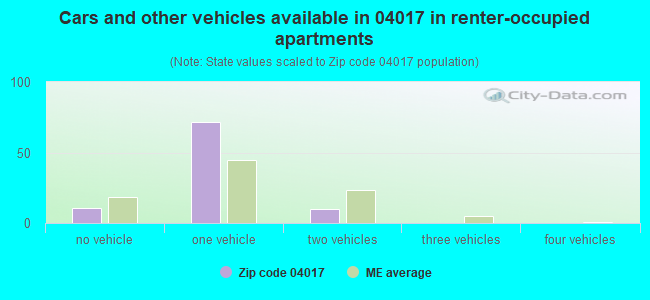
Houses and condos: 629 Renter-occupied apartments: 93
% of renters here:
29%
State:
26%
March 2022 cost of living index in zip code 04017: 98.3 (near average, U.S. average is 100)
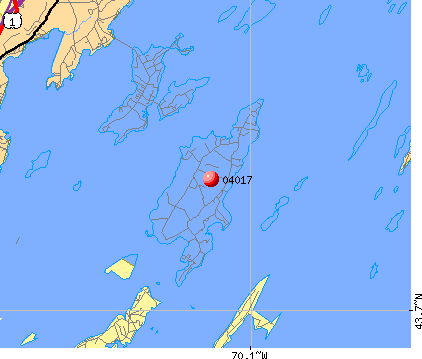
Land area: 3.6 sq. mi. Water area: 16.1 sq. mi.
Population density: 170 people per square mile
(very low).
OSM Map
Google Map
MSN Map
OSM Map
General Map
Google Map
MSN Map
OSM Map
Google Map
MSN Map
OSM Map
Google Map
MSN Map
Please wait while loading the map...
Real estate property taxes paid for housing units in 2022:
This zip code:
0.9% ($5,245)
Maine:
1.0% ($2,785)
Median real estate property taxes paid for housing units with mortgages in 2022: $5,429 (0.9%) Median real estate property taxes paid for housing units with no mortgage in 2022: $5,070 (0.9%)
Business Search- 14 Million verified businesses
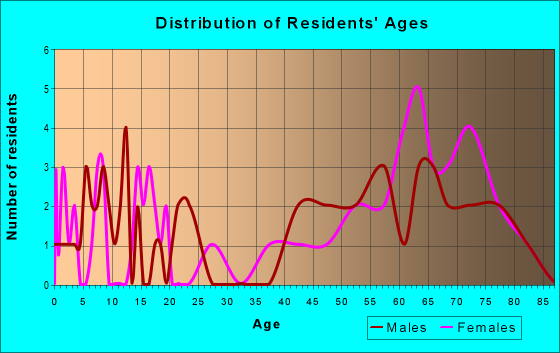
Males: 293
(48.5%)
Females: 311
(51.5%)
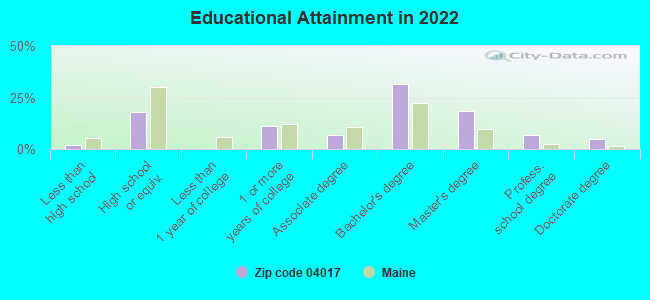
For population 25 years and over in 04017:
High school or higher: 100.3%
Bachelor's degree or higher: 63.3%
Graduate or professional degree: 31.4%
Unemployed: 1.3%
Mean travel time to work (commute): 27.5 minutes
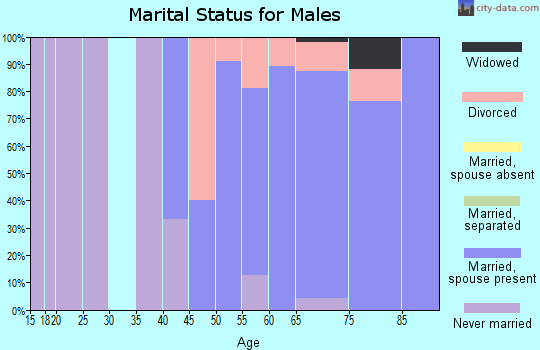
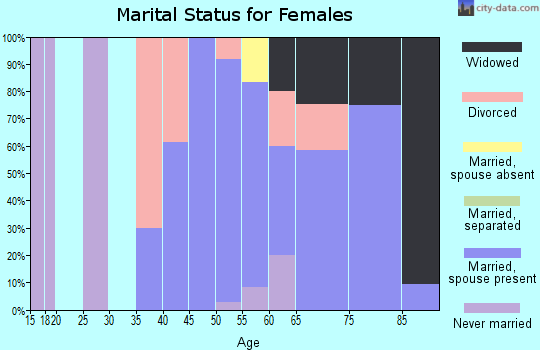
For population 15 years and over in 04017:
Never married: 21.4%
Now married: 53.8%
Separated: 0.0%
Widowed: 9.0%
Divorced: 15.8%
Zip code 04017 compared to state average:
Median house value above state average.
Unemployed percentage below state average.
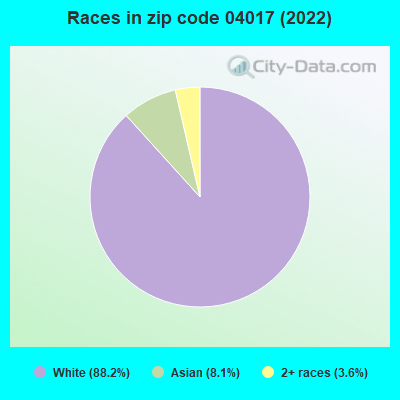
Black race population percentage significantly below state average.
Hispanic race population percentage significantly below state average.
Median age significantly above state average.
Foreign-born population percentage below state average.
Length of stay since moving in significantly above state average.
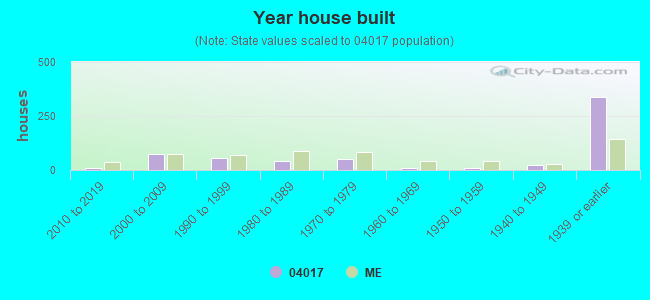
House age above state average.
Percentage of population with a bachelor's degree or higher above state average.
Estimated median house/condo value in 2022: $562,681
04017:
$562,681
Maine:
$290,600
Median resident age:
This zip code:
56.0 years
Maine median age:
45.1 years
Average household size:
This zip code:
1.9 people
Maine:
2.2 people
Averages for the 2020 tax year for zip code 04017, filed in 2021:
Average Adjusted Gross Income (AGI) in 2020: $92,586 (Individual Income Tax Returns)
Here:
$92,586
State:
$68,227
Salary/wage: $51,100 (reported on 72.7% of returns)
Here:
$51,100
State:
$55,127
(% of AGI for various income ranges: 1210.0% for AGIs below $25k, 2055.0% for AGIs $25k-50k)
Taxable interest for individuals: $546 (reported on 59.1% of returns)
This zip code:
$546
Maine:
$1,162
(% of AGI for various income ranges: 12.5% for AGIs $25k-50k)
Ordinary dividends: $8,970 (reported on 45.5% of returns)
Here:
$8,970
State:
$7,695
(% of AGI for various income ranges: 585.0% for AGIs below $25k)
Net capital gain/loss in AGI: +$30,762 (reported on 36.4% of returns)
Here:
+$30,762
State:
+$22,201
(% of AGI for various income ranges: 285.0% for AGIs below $25k)
Profit/loss from business: +$11,062 (reported on 36.4% of returns)
Here:
+$11,062
State:
+$15,095
(% of AGI for various income ranges: 1490.0% for AGIs below $25k, 625.0% for AGIs $25k-50k)
Taxable individual retirement arrangement distribution: $25,740 (reported on 22.7% of returns)
04017:
$25,740
Maine:
$18,314
(% of AGI for various income ranges: 1030.0% for AGIs $25k-50k, 2916.7% for AGIs $75k-100k)
Total itemized deductions: $30,667 (reported on 13.6% of returns)
Here:
$30,667
State:
$31,197
(% of AGI for various income ranges: 3066.7% for AGIs $75k-100k)
Charity contributions: $6,100 (reported on 9.1% of returns)
Here:
$6,100
State:
$9,863
(% of AGI for various income ranges: 610.0% for AGIs below $25k)
Taxes paid: $9,433 (reported on 13.6% of returns)
04017:
$9,433
State:
$8,241
(% of AGI for various income ranges: 943.3% for AGIs $75k-100k)
Earned income credit: $1,900 (reported on 9.1% of returns)
Here:
$1,900
State:
$1,960
(% of AGI for various income ranges: 190.0% for AGIs below $25k)
Percentage of individuals using paid preparers for their 2020 taxes: 86.4%
Here:
86%
State:
92%
(% for various income ranges: 80.0% for AGIs below $25k, 80.0% for AGIs $25k-50k, 100.0% for AGIs $50k-75k, 66.7% for AGIs $75k-100k, 100.0% for AGIs $100k-200k, 100.0% for AGIs over 200k)
Averages for the 2012 tax year for zip code 04017, filed in 2013:
Average Adjusted Gross Income (AGI) in 2012: $61,270 (Individual Income Tax Returns)
Here:
$61,270
State:
$52,375
Salary/wage: $30,107 (reported on 70.0% of returns)
Here:
$30,107
State:
$43,415
(% of AGI for various income ranges: 58.3% for AGIs below $25k, 34.8% for AGIs $25k-50k, 29.1% for AGIs $50k-75k, 57.3% for AGIs $75k-100k, 24.8% for AGIs $100k-200k)
Taxable interest for individuals: $1,108 (reported on 60.0% of returns)
This zip code:
$1,108
Maine:
$1,221
(% of AGI for various income ranges: 1.8% for AGIs below $25k, 1.4% for AGIs $25k-50k, 0.7% for AGIs $50k-75k, 1.4% for AGIs $100k-200k)
Ordinary dividends: $5,656 (reported on 45.0% of returns)
Here:
$5,656
State:
$5,812
(% of AGI for various income ranges: 13.0% for AGIs below $25k, 13.9% for AGIs $50k-75k, 2.4% for AGIs $100k-200k)
Net capital gain/loss in AGI: +$7,625 (reported on 40.0% of returns)
Here:
+$7,625
State:
+$11,897
Profit/loss from business: +$16,367 (reported on 30.0% of returns)
Here:
+$16,367
State:
+$12,144
Taxable individual retirement arrangement distribution: $20,540 (reported on 25.0% of returns)
04017:
$20,540
Maine:
$13,385
Total itemized deductions: $23,020 (25% of AGI, reported on 50.0% of returns)
Here:
$23,020
State:
$21,859
Here:
24.8% of AGI
State:
20.9% of AGI
Charity contributions: $2,262 (reported on 40.0% of returns)
Here:
$2,262
State:
$2,741
Taxes paid: $11,960 (reported on 50.0% of returns)
04017:
$11,960
State:
$9,996
Earned income credit: $800 (reported on 10.0% of returns)
Here:
$800
State:
$1,959
(% of AGI for various income ranges: 2.1% for AGIs below $25k)
Percentage of individuals using paid preparers for their 2012 taxes: 55.0%
Here:
55%
State:
48%
(% for various income ranges: 71.4% for AGIs below $25k, 133.3% for AGIs $50k-75k, 50.0% for AGIs $100k-200k)
Averages for the 2004 tax year for zip code 04017, filed in 2005:
Average Adjusted Gross Income (AGI) in 2004: $43,618 (Individual Income Tax Returns)
Here:
$43,618
State:
$42,606
Salary/wage: $29,315 (reported on 60.7% of returns)
Here:
$29,315
State:
$36,376
(% of AGI for various income ranges: 43.7% for AGIs below $10k, 36.4% for AGIs $10k-25k, 34.8% for AGIs $25k-50k, 59.4% for AGIs $50k-75k, 103.0% for AGIs $75k-100k)
Taxable interest for individuals: $1,078 (reported on 57.9% of returns)
This zip code:
$1,078
Maine:
$1,367
(% of AGI for various income ranges: 6.3% for AGIs below $10k, 4.5% for AGIs $10k-25k, 1.8% for AGIs $25k-50k, 0.5% for AGIs $50k-75k, 1.4% for AGIs over 100k)
Taxable dividends: $4,506 (reported on 47.8% of returns)
Here:
$4,506
State:
$3,533
(% of AGI for various income ranges: 4.0% for AGIs below $10k, 5.9% for AGIs $10k-25k, 4.7% for AGIs $25k-50k, 4.4% for AGIs $50k-75k, 7.7% for AGIs over 100k)
Net capital gain/loss: +$3,053 (reported on 32.0% of returns)
Here:
+$3,053
State:
+$11,433
(% of AGI for various income ranges: -1.5% for AGIs $10k-25k, -0.3% for AGIs $25k-50k, 1.4% for AGIs $50k-75k, 7.3% for AGIs over 100k)
Profit/loss from business: +$15,014 (reported on 41.0% of returns)
Here:
+$15,014
State:
+$10,755
(% of AGI for various income ranges: 24.6% for AGIs below $10k, 29.6% for AGIs $10k-25k, 33.4% for AGIs $25k-50k, 15.2% for AGIs $50k-75k)
Total itemized deductions: $18,667 (29% of AGI, reported on 45.5% of returns)
Here:
$18,667
State:
$18,231
Here:
28.9% of AGI
State:
21.7% of AGI
(% of AGI for various income ranges: 43.2% for AGIs $10k-25k, 16.1% for AGIs $25k-50k, 25.2% for AGIs $50k-75k, 19.7% for AGIs over 100k)
Charity contributions deductions: $2,309 (3% of AGI, reported on 38.2% of returns)
Here:
$2,309
State:
$2,466
Here:
3.3% of AGI
State:
2.8% of AGI
(% of AGI for various income ranges: 2.7% for AGIs $10k-25k, 0.8% for AGIs $25k-50k, 3.1% for AGIs $50k-75k, 2.8% for AGIs over 100k)
Total tax: $4,913 (reported on 83.7% of returns)
04017:
$4,913
State:
$6,047
(% of AGI for various income ranges: 4.8% for AGIs below $10k, 6.9% for AGIs $10k-25k, 10.6% for AGIs $25k-50k, 10.6% for AGIs $50k-75k, 14.4% for AGIs $75k-100k, 6.2% for AGIs over 100k)
Earned income credit: $909 (reported on 6.2% of returns)
Here:
$909
State:
$1,520
Percentage of individuals using paid preparers for their 2004 taxes: 64.0%
Here:
64%
State:
53%
(% for various income ranges: 54.8% for AGIs below $10k, 65.1% for AGIs $10k-25k, 76.1% for AGIs $25k-50k, 62.5% for AGIs $50k-75k, 116.7% for AGIs $75k-100k)
Household received Food Stamps/SNAP in the past 12 months: 2 Household did not receive Food Stamps/SNAP in the past 12 months: 318
Women who had a birth in the past 12 months: 4 (1 now married, 3 unmarried) Women who did not have a birth in the past 12 months: 104 (25 now married, 78 unmarried)
Housing units in zip code 04017 with a mortgage: 92 (3 second mortgage, 3 both second mortgage and home equity loan) Houses without a mortgage: 11
Median monthly owner costs for units with a mortgage: $2,091 Median monthly owner costs for units without a mortgage: $836
Residents with income below the poverty level in 2022:
This zip code:
20.3%
Whole state:
10.8%
Residents with income below 50% of the poverty level in 2022:
This zip code:
4.0%
Whole state:
5.8%
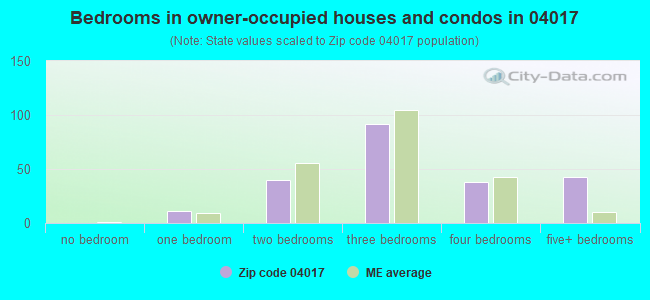
Median number of rooms in houses and condos:
Here:
6.8
State:
6.1
Median number of rooms in apartments:
Here:
4.1
State:
4.0
Notable locations in this zip code not listed on our city pages
Notable locations in zip code 04017: Great Chebeague Golf Club (A), Chebeague Island Rescue Station (B), Chebeague Island Fire Department (C), Chebeague Island Library (D). Display/hide their locations on the map
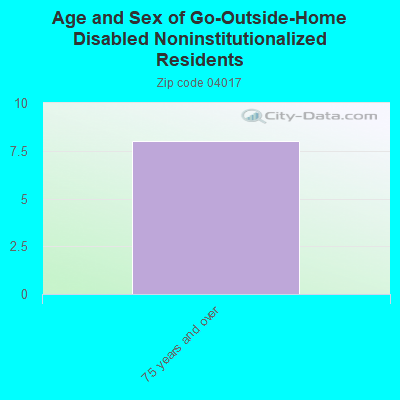
In group quarters: 11 (-1 institutionalized population)
Size of family households: 124 2-persons, 8 3-persons, 27 4-persons, 9 5-persons
Size of nonfamily households: 139 1-person, 9 2-persons
61 married couples with children.
37 single-parent households (14 men, 23 women).
100.2% of residents of 04017 zip code speak English at home.
1.2% of residents speak other Indo-European language at home (100% very well).
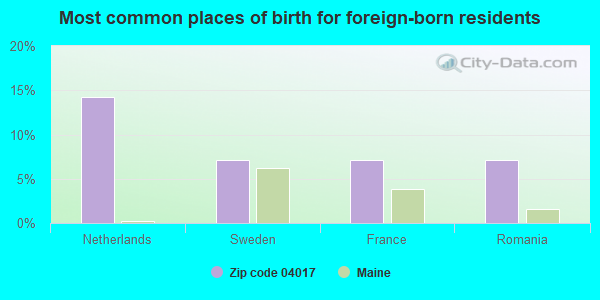
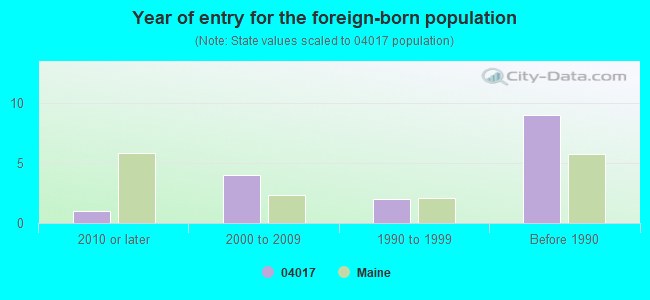
Foreign born population: 15 (2.5%) (79.5% of them are naturalized citizens)
This zip code:
2.5%
Whole state:
4.1%
14%Netherlands
7%Sweden
7%France
7%Romania
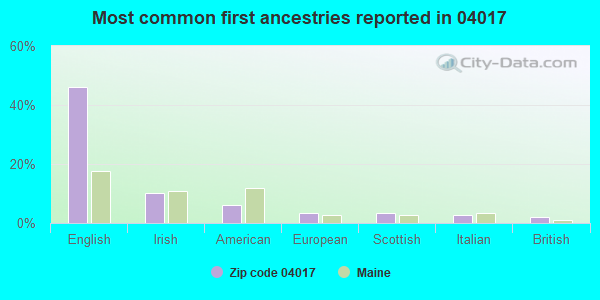
46%English
10%Irish
6%American
3%European
3%Scottish
3%Italian
2%British
Year of entry for the foreign-born population
12010 or later
42000 to 2009
21990 to 1999
9Before 1990
Housing units lacking complete plumbing facilities: 3.2% Housing units lacking complete kitchen facilities: 3.8%
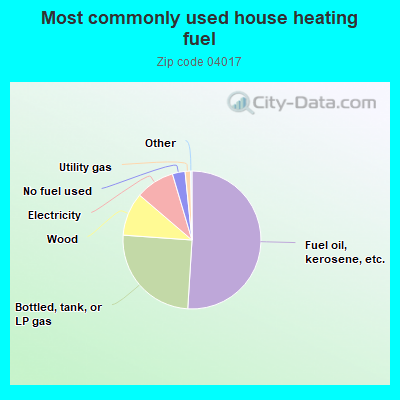
51.3%Fuel oil, kerosene, etc.
25.3%Bottled, tank, or LP gas
10.2%Wood
9.2%Electricity
3.0%No fuel used
1.3%Utility gas
Population in 1990: 337. Population change in the 1990s: +19 (+5.6%).
Place of birth for U.S.-born residents:
This state: 257
Northeast: 198
Midwest: 38
South: 41
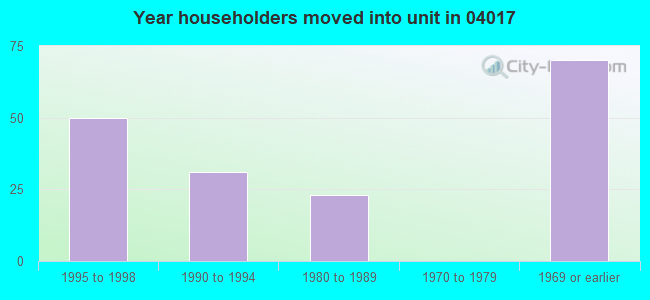
West: 59
74% of the 04017 zip code residents lived in the same house 5 years ago. Out of people who lived in different houses, 82% lived in this county. Out of people who lived in different counties, 50% lived in Maine.
97% of the 04017 zip code residents lived in the same house 1 year ago. Out of people who lived in different houses, 46% moved from this county. Out of people who lived in different houses, 15% moved from different county within same state. Out of people who lived in different houses, 54% moved from different state. Out of people who lived in different houses, 8% moved from abroad.
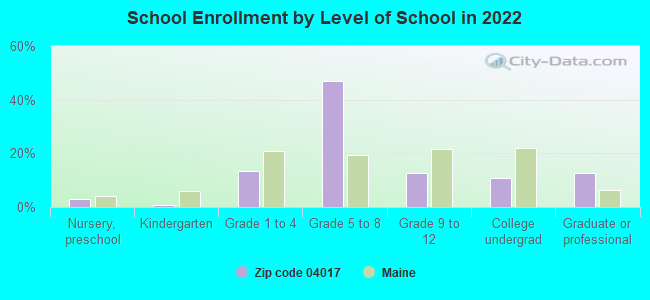
Private vs. public school enrollment:
Students in private schools in grades 1 to 8 (elementary and middle school): 16
Here:
21.1%
Maine:
12.7%
Students in private schools in grades 9 to 12 (high school): 4
Here:
26.0%
Maine:
12.6%
Students in private undergraduate colleges: 13
Here:
87.7%
Maine:
34.5%
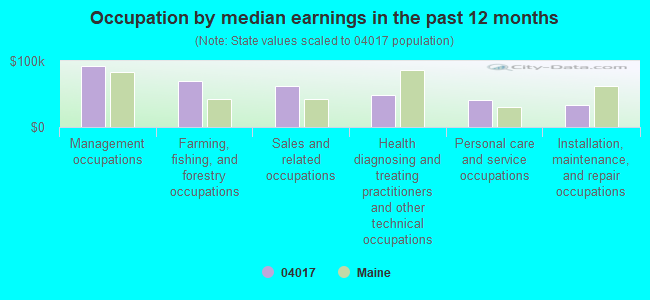
Occupation by median earnings in the past 12 months ($)
91,769Management occupations
70,450Farming, fishing, and forestry occupations
62,083Sales and related occupations
47,796Health diagnosing and treating practitioners and other technical occupations
40,818Personal care and service occupations
32,991Installation, maintenance, and repair occupations
Top industries in this zip code by the number of employees in 2005:
Health Care and Social Assistance: Homes for the Elderly (10-19 employees: 1 establishment)
Accommodation and Food Services: Hotels (except Casino Hotels) and Motels (5-9: 1)
Administrative and Support and Waste Management and Remediation Services: Janitorial Services (5-9: 1)
Arts, Entertainment, and Recreation: Marinas (1-4: 1)
Construction: Residential Remodelers (1-4: 1)
Other Services (except Public Administration): Religious Organizations (1-4: 1)
Arts, Entertainment, and Recreation: Golf Courses and Country Clubs (1-4: 1)
Fatal accident statistics in 2014:
Fatal accident count: 1
Vehicles involved in fatal accidents: 1
Fatal accidents caused by drunken drivers: 1
Fatalities: 1
Persons involved in fatal accidents: 1
Pedestrians involved in fatal accidents: 0
Home Mortgage Disclosure Act Aggregated Statistics For Year 2009 (Based on 2 full tracts)
A) FHA, FSA/RHS & VA Home Purchase Loans
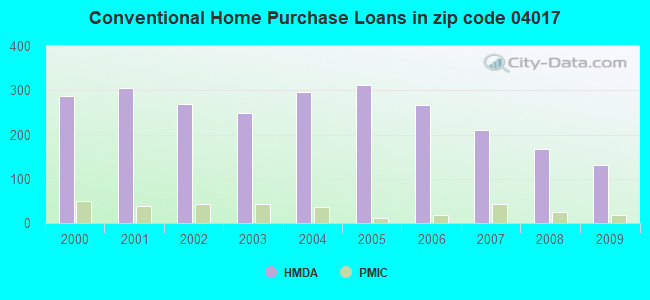
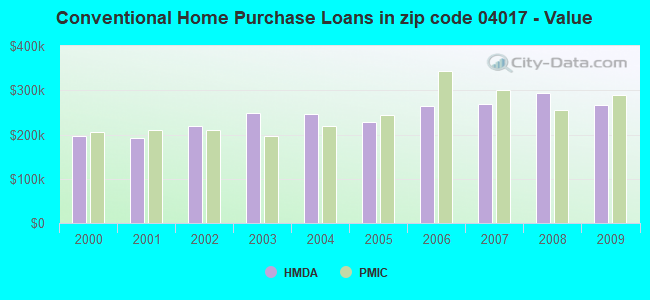
B) Conventional Home Purchase Loans
C) Refinancings
D) Home Improvement Loans
F) Non-occupant Loans on < 5 Family Dwellings (A B C & D)
Number
Average Value
Number
Average Value
Number
Average Value
Number
Average Value
Number
Average Value
LOANS ORIGINATED
34
$225,529
132
$267,500
754
$249,119
64
$150,375
46
$221,565
APPLICATIONS APPROVED, NOT ACCEPTED
0
$0
8
$218,750
74
$277,892
4
$122,000
2
$118,000
APPLICATIONS DENIED
8
$281,750
14
$250,571
162
$269,988
12
$132,500
18
$271,778
APPLICATIONS WITHDRAWN
2
$216,000
12
$258,500
76
$273,974
2
$30,000
4
$283,500
FILES CLOSED FOR INCOMPLETENESS
0
$0
0
$0
14
$265,571
0
$0
0
$0
Aggregated Statistics For Year 2008 (Based on 2 full tracts)
A) FHA, FSA/RHS & VA Home Purchase Loans
B) Conventional Home Purchase Loans
C) Refinancings
D) Home Improvement Loans
F) Non-occupant Loans on < 5 Family Dwellings (A B C & D)
Number
Average Value
Number
Average Value
Number
Average Value
Number
Average Value
Number
Average Value
LOANS ORIGINATED
22
$226,000
168
$293,833
290
$245,269
68
$115,029
42
$221,476
APPLICATIONS APPROVED, NOT ACCEPTED
4
$197,000
52
$287,769
56
$301,393
12
$163,000
18
$300,889
APPLICATIONS DENIED
6
$281,000
14
$249,143
60
$248,900
30
$63,267
8
$179,750
APPLICATIONS WITHDRAWN
2
$273,000
20
$350,900
52
$309,346
10
$187,400
0
$0
FILES CLOSED FOR INCOMPLETENESS
0
$0
0
$0
10
$240,200
4
$131,000
0
$0
Aggregated Statistics For Year 2007 (Based on 2 full tracts)
A) FHA, FSA/RHS & VA Home Purchase Loans
B) Conventional Home Purchase Loans
C) Refinancings
D) Home Improvement Loans
F) Non-occupant Loans on < 5 Family Dwellings (A B C & D)
Number
Average Value
Number
Average Value
Number
Average Value
Number
Average Value
Number
Average Value
LOANS ORIGINATED
6
$231,667
210
$269,019
278
$243,676
90
$83,067
36
$371,889
APPLICATIONS APPROVED, NOT ACCEPTED
0
$0
34
$374,529
40
$232,400
8
$23,000
10
$478,200
APPLICATIONS DENIED
2
$253,000
28
$277,000
102
$248,373
18
$95,000
8
$161,500
APPLICATIONS WITHDRAWN
0
$0
12
$233,000
54
$211,370
0
$0
2
$210,000
FILES CLOSED FOR INCOMPLETENESS
0
$0
2
$50,000
16
$309,250
2
$250,000
2
$710,000
Aggregated Statistics For Year 2006 (Based on 2 full tracts)
A) FHA, FSA/RHS & VA Home Purchase Loans
B) Conventional Home Purchase Loans
C) Refinancings
D) Home Improvement Loans
E) Loans on Dwellings For 5+ Families
F) Non-occupant Loans on < 5 Family Dwellings (A B C & D)
Number
Average Value
Number
Average Value
Number
Average Value
Number
Average Value
Number
Average Value
Number
Average Value
LOANS ORIGINATED
4
$202,000
266
$264,474
378
$192,762
112
$72,446
0
$0
68
$242,441
APPLICATIONS APPROVED, NOT ACCEPTED
0
$0
32
$365,750
42
$235,048
18
$76,444
0
$0
18
$346,111
APPLICATIONS DENIED
2
$248,000
26
$247,077
112
$215,393
30
$34,733
0
$0
10
$321,600
APPLICATIONS WITHDRAWN
0
$0
24
$218,833
92
$207,543
8
$163,000
0
$0
8
$288,750
FILES CLOSED FOR INCOMPLETENESS
0
$0
6
$239,333
10
$191,800
0
$0
2
$220,000
0
$0
Aggregated Statistics For Year 2005 (Based on 2 full tracts)
A) FHA, FSA/RHS & VA Home Purchase Loans
B) Conventional Home Purchase Loans
C) Refinancings
D) Home Improvement Loans
F) Non-occupant Loans on < 5 Family Dwellings (A B C & D)
G) Loans On Manufactured Home Dwelling (A B C & D)
Number
Average Value
Number
Average Value
Number
Average Value
Number
Average Value
Number
Average Value
Number
Average Value
LOANS ORIGINATED
2
$240,000
312
$227,410
460
$211,761
116
$132,569
50
$235,680
0
$0
APPLICATIONS APPROVED, NOT ACCEPTED
0
$0
30
$190,800
44
$236,000
4
$160,000
6
$206,667
0
$0
APPLICATIONS DENIED
0
$0
24
$238,417
126
$229,873
20
$86,000
6
$133,667
2
$40,000
APPLICATIONS WITHDRAWN
0
$0
36
$186,000
94
$229,660
10
$307,400
12
$178,000
0
$0
FILES CLOSED FOR INCOMPLETENESS
0
$0
12
$175,667
10
$279,400
0
$0
0
$0
0
$0
Aggregated Statistics For Year 2004 (Based on 2 full tracts)
A) FHA, FSA/RHS & VA Home Purchase Loans
B) Conventional Home Purchase Loans
C) Refinancings
D) Home Improvement Loans
F) Non-occupant Loans on < 5 Family Dwellings (A B C & D)
Number
Average Value
Number
Average Value
Number
Average Value
Number
Average Value
Number
Average Value
LOANS ORIGINATED
2
$191,000
296
$246,757
624
$204,910
72
$97,583
76
$274,605
APPLICATIONS APPROVED, NOT ACCEPTED
2
$215,000
36
$232,389
40
$206,550
8
$81,750
12
$206,833
APPLICATIONS DENIED
2
$133,000
24
$196,750
128
$201,078
22
$72,909
16
$161,625
APPLICATIONS WITHDRAWN
0
$0
24
$227,333
120
$189,850
6
$132,333
4
$160,500
FILES CLOSED FOR INCOMPLETENESS
2
$124,000
4
$160,000
20
$160,900
4
$243,500
2
$232,000
Aggregated Statistics For Year 2003 (Based on 2 full tracts)
A) FHA, FSA/RHS & VA Home Purchase Loans
B) Conventional Home Purchase Loans
C) Refinancings
D) Home Improvement Loans
F) Non-occupant Loans on < 5 Family Dwellings (A B C & D)
Number
Average Value
Number
Average Value
Number
Average Value
Number
Average Value
Number
Average Value
LOANS ORIGINATED
4
$136,000
248
$249,032
1,530
$180,744
32
$64,688
60
$230,367
APPLICATIONS APPROVED, NOT ACCEPTED
2
$119,000
22
$221,091
108
$176,074
8
$61,500
6
$181,333
APPLICATIONS DENIED
2
$80,000
12
$301,167
154
$229,714
4
$132,500
8
$145,250
APPLICATIONS WITHDRAWN
0
$0
30
$180,600
136
$197,235
2
$15,000
10
$245,000
FILES CLOSED FOR INCOMPLETENESS
0
$0
0
$0
22
$159,727
0
$0
2
$198,000
Aggregated Statistics For Year 2002 (Based on 2 full tracts)
A) FHA, FSA/RHS & VA Home Purchase Loans
B) Conventional Home Purchase Loans
C) Refinancings
D) Home Improvement Loans
E) Loans on Dwellings For 5+ Families
F) Non-occupant Loans on < 5 Family Dwellings (A B C & D)
Number
Average Value
Number
Average Value
Number
Average Value
Number
Average Value
Number
Average Value
Number
Average Value
LOANS ORIGINATED
6
$137,000
268
$218,709
1,108
$178,993
72
$82,111
2
$10,000
48
$180,750
APPLICATIONS APPROVED, NOT ACCEPTED
0
$0
26
$336,769
102
$197,902
14
$25,000
0
$0
8
$244,750
APPLICATIONS DENIED
2
$148,000
26
$203,154
92
$184,196
6
$63,333
0
$0
4
$152,500
APPLICATIONS WITHDRAWN
0
$0
32
$224,688
120
$171,850
6
$62,000
0
$0
20
$190,600
FILES CLOSED FOR INCOMPLETENESS
0
$0
0
$0
14
$160,857
0
$0
0
$0
0
$0
Aggregated Statistics For Year 2001 (Based on 2 full tracts)
A) FHA, FSA/RHS & VA Home Purchase Loans
B) Conventional Home Purchase Loans
C) Refinancings
D) Home Improvement Loans
F) Non-occupant Loans on < 5 Family Dwellings (A B C & D)
Number
Average Value
Number
Average Value
Number
Average Value
Number
Average Value
Number
Average Value
LOANS ORIGINATED
4
$124,000
306
$191,098
832
$169,933
38
$41,158
38
$152,895
APPLICATIONS APPROVED, NOT ACCEPTED
0
$0
18
$235,111
64
$164,938
18
$44,778
2
$129,000
APPLICATIONS DENIED
0
$0
12
$137,500
108
$156,574
10
$23,800
2
$400,000
APPLICATIONS WITHDRAWN
2
$94,000
12
$247,333
88
$184,000
6
$16,000
2
$600,000
FILES CLOSED FOR INCOMPLETENESS
0
$0
0
$0
26
$157,692
0
$0
0
$0
Aggregated Statistics For Year 2000 (Based on 2 full tracts)
A) FHA, FSA/RHS & VA Home Purchase Loans
B) Conventional Home Purchase Loans
C) Refinancings
D) Home Improvement Loans
F) Non-occupant Loans on < 5 Family Dwellings (A B C & D)


 Nearest zip codes: 04019, 04050, 04096, 04110, 04032, 04108.