Estimated zip code population in 2022: 1,844 Zip code population in 2010: 2,156 Zip code population in 2000: 1,952
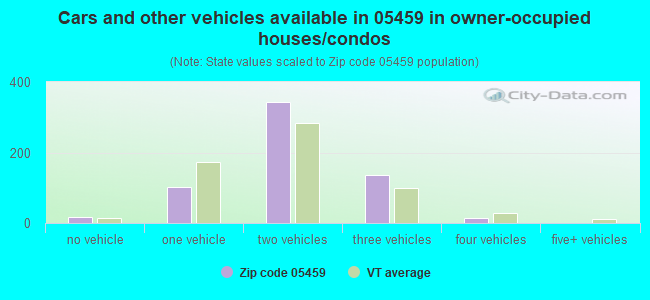
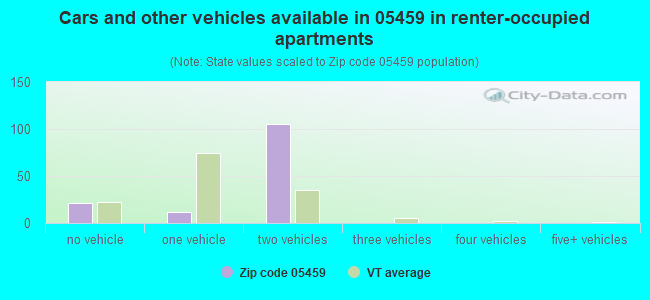
Houses and condos: 760 Renter-occupied apartments: 137
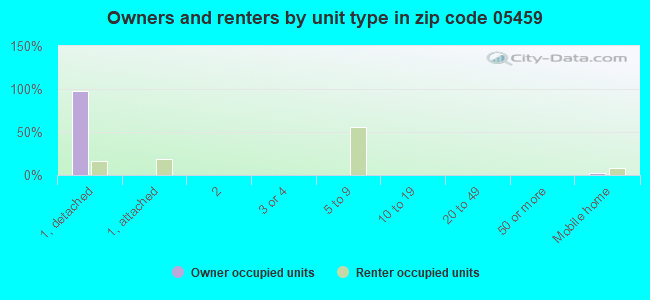
% of renters here:
18%
State:
26%
March 2022 cost of living index in zip code 05459: 89.9 (less than average, U.S. average is 100)
Land area: 25.6 sq. mi. Water area: 0.5 sq. mi.
Population density: 72 people per square mile
(very low).
OSM Map
Google Map
MSN Map
OSM Map
General Map
Google Map
MSN Map
OSM Map
Google Map
MSN Map
OSM Map
Google Map
MSN Map
Please wait while loading the map...
Real estate property taxes paid for housing units in 2022:
This zip code:
1.2% ($3,312)
Vermont:
1.6% ($4,787)
Median real estate property taxes paid for housing units with mortgages in 2022: $2,923 (1.2%) Median real estate property taxes paid for housing units with no mortgage in 2022: $3,709 (1.2%)
Business Search- 14 Million verified businesses
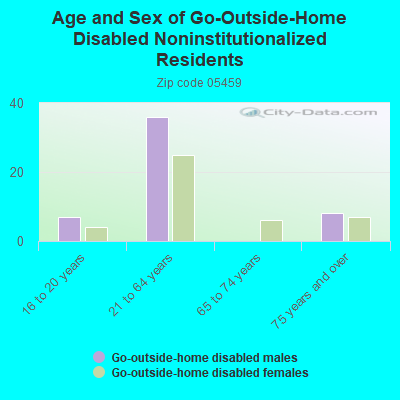
Males: 1,104
(59.9%)
Females: 738
(40.1%)
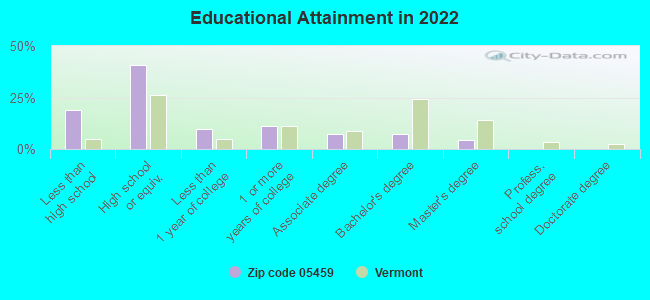
For population 25 years and over in 05459:
High school or higher: 75.6%
Bachelor's degree or higher: 10.9%
Graduate or professional degree: 4.1%
Unemployed: 3.5%
Mean travel time to work (commute): 28.8 minutes
For population 15 years and over in 05459:
Never married: 38.2%
Now married: 52.9%
Separated: 0.5%
Widowed: 4.5%
Divorced: 3.9%
Zip code 05459 compared to state average:
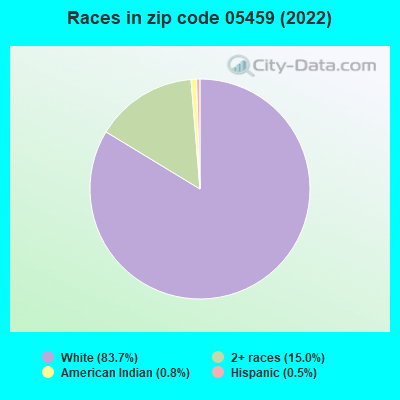
Black race population percentage significantly below state average.
Hispanic race population percentage significantly below state average.
Median age below state average.
Foreign-born population percentage below state average.
Number of college students below state average.
Percentage of population with a bachelor's degree or higher significantly below state average.
Averages for the 2020 tax year for zip code 05459, filed in 2021:
Average Adjusted Gross Income (AGI) in 2020: $52,649 (Individual Income Tax Returns)
Here:
$52,649
State:
$70,107
Salary/wage: $48,054 (reported on 87.1% of returns)
Here:
$48,054
State:
$56,381
(% of AGI for various income ranges: 1241.8% for AGIs below $25k, 3754.4% for AGIs $25k-50k, 7151.7% for AGIs $50k-75k, 9465.7% for AGIs $75k-100k, 17455.7% for AGIs $100k-200k)
Taxable interest for individuals: $692 (reported on 28.0% of returns)
This zip code:
$692
Vermont:
$1,276
(% of AGI for various income ranges: 8.8% for AGIs below $25k, 20.4% for AGIs $25k-50k, 10.8% for AGIs $50k-75k, 17.1% for AGIs $75k-100k, 127.1% for AGIs $100k-200k)
Ordinary dividends: $1,364 (reported on 11.8% of returns)
Here:
$1,364
State:
$8,930
(% of AGI for various income ranges: 22.9% for AGIs below $25k, 24.0% for AGIs $25k-50k, 22.5% for AGIs $50k-75k, 34.3% for AGIs $100k-200k)
Net capital gain/loss in AGI: +$6,962 (reported on 8.6% of returns)
Here:
+$6,962
State:
+$19,777
(% of AGI for various income ranges: 42.0% for AGIs $25k-50k, 50.0% for AGIs $50k-75k, 560.0% for AGIs $100k-200k)
Profit/loss from business: +$7,800 (reported on 11.8% of returns)
Here:
+$7,800
State:
+$15,467
(% of AGI for various income ranges: 183.2% for AGIs $25k-50k, 230.0% for AGIs $50k-75k, 177.1% for AGIs $75k-100k)
Taxable individual retirement arrangement distribution: $7,783 (reported on 6.5% of returns)
05459:
$7,783
Vermont:
$17,245
(% of AGI for various income ranges: 114.4% for AGIs $25k-50k, 150.8% for AGIs $50k-75k)
Earned income credit: $1,985 (reported on 14.0% of returns)
Here:
$1,985
State:
$1,839
(% of AGI for various income ranges: 82.9% for AGIs below $25k, 46.8% for AGIs $25k-50k)
Percentage of individuals using paid preparers for their 2020 taxes: 94.6%
Here:
95%
State:
93%
(% for various income ranges: 95.8% for AGIs below $25k, 93.8% for AGIs $25k-50k, 94.1% for AGIs $50k-75k, 88.9% for AGIs $75k-100k, 100.0% for AGIs $100k-200k)
Averages for the 2012 tax year for zip code 05459, filed in 2013:
Average Adjusted Gross Income (AGI) in 2012: $41,818 (Individual Income Tax Returns)
Here:
$41,818
State:
$55,225
Salary/wage: $40,165 (reported on 84.8% of returns)
Here:
$40,165
State:
$44,925
(% of AGI for various income ranges: 71.2% for AGIs below $25k, 85.4% for AGIs $25k-50k, 81.8% for AGIs $50k-75k, 90.1% for AGIs $75k-100k, 75.7% for AGIs $100k-200k)
Taxable interest for individuals: $646 (reported on 28.3% of returns)
This zip code:
$646
Vermont:
$1,237
(% of AGI for various income ranges: 0.7% for AGIs below $25k, 0.5% for AGIs $25k-50k, 0.4% for AGIs $50k-75k, 0.2% for AGIs $75k-100k, 0.4% for AGIs $100k-200k)
Ordinary dividends: $1,192 (reported on 13.0% of returns)
Here:
$1,192
State:
$7,010
(% of AGI for various income ranges: 1.4% for AGIs below $25k, 0.1% for AGIs $25k-50k, 0.5% for AGIs $50k-75k, 0.3% for AGIs $100k-200k)
Net capital gain/loss in AGI: +$4,357 (reported on 7.6% of returns)
Here:
+$4,357
State:
+$13,197
(% of AGI for various income ranges: 1.4% for AGIs below $25k, 1.7% for AGIs $50k-75k, 1.4% for AGIs $75k-100k)
Profit/loss from business: +$9,150 (reported on 13.0% of returns)
Here:
+$9,150
State:
+$12,941
(% of AGI for various income ranges: 6.8% for AGIs below $25k, 5.1% for AGIs $25k-50k, 3.5% for AGIs $50k-75k)
Taxable individual retirement arrangement distribution: $6,450 (reported on 6.5% of returns)
05459:
$6,450
Vermont:
$12,934
Total itemized deductions: $14,479 (20% of AGI, reported on 20.7% of returns)
Here:
$14,479
State:
$22,572
Here:
19.5% of AGI
State:
19.9% of AGI
(% of AGI for various income ranges: 6.3% for AGIs $25k-50k, 8.9% for AGIs $50k-75k, 7.0% for AGIs $75k-100k, 9.9% for AGIs $100k-200k)
Charity contributions: $975 (reported on 8.7% of returns)
Here:
$975
State:
$3,170
Taxes paid: $5,237 (reported on 20.7% of returns)
05459:
$5,237
State:
$10,425
(% of AGI for various income ranges: 1.5% for AGIs $25k-50k, 2.5% for AGIs $50k-75k, 2.8% for AGIs $75k-100k, 4.9% for AGIs $100k-200k)
Earned income credit: $1,800 (reported on 17.4% of returns)
Here:
$1,800
State:
$1,828
(% of AGI for various income ranges: 4.4% for AGIs below $25k, 1.0% for AGIs $25k-50k)
Percentage of individuals using paid preparers for their 2012 taxes: 52.2%
Here:
52%
State:
49%
(% for various income ranges: 50.0% for AGIs below $25k, 50.0% for AGIs $25k-50k, 53.3% for AGIs $50k-75k, 50.0% for AGIs $75k-100k, 71.4% for AGIs $100k-200k)
Averages for the 2004 tax year for zip code 05459, filed in 2005:
Average Adjusted Gross Income (AGI) in 2004: $33,673 (Individual Income Tax Returns)
Here:
$33,673
State:
$44,564
Salary/wage: $32,336 (reported on 89.2% of returns)
Here:
$32,336
State:
$37,522
(% of AGI for various income ranges: 82.3% for AGIs below $10k, 80.4% for AGIs $10k-25k, 87.1% for AGIs $25k-50k, 87.7% for AGIs $50k-75k, 91.7% for AGIs $75k-100k, 66.0% for AGIs over 100k)
Taxable interest for individuals: $803 (reported on 39.2% of returns)
This zip code:
$803
Vermont:
$1,373
(% of AGI for various income ranges: 2.3% for AGIs below $10k, 1.8% for AGIs $10k-25k, 1.2% for AGIs $25k-50k, 0.4% for AGIs $50k-75k, 0.5% for AGIs $75k-100k, 0.6% for AGIs over 100k)
Taxable dividends: $640 (reported on 16.3% of returns)
Here:
$640
State:
$4,037
(% of AGI for various income ranges: 0.1% for AGIs below $10k, 0.8% for AGIs $10k-25k, 0.4% for AGIs $25k-50k, 0.1% for AGIs $50k-75k, 0.2% for AGIs $75k-100k)
Net capital gain/loss: +$5,792 (reported on 13.1% of returns)
Here:
+$5,792
State:
+$11,311
(% of AGI for various income ranges: 1.6% for AGIs $10k-25k, 1.6% for AGIs $25k-50k, 2.6% for AGIs $50k-75k, 4.5% for AGIs $75k-100k)
Profit/loss from business: +$5,062 (reported on 13.9% of returns)
Here:
+$5,062
State:
+$11,197
(% of AGI for various income ranges: 4.6% for AGIs below $10k, 5.5% for AGIs $10k-25k, 3.8% for AGIs $25k-50k, 0.1% for AGIs $50k-75k, -0.4% for AGIs $75k-100k)
Profit/loss from farming: +$1,769 (reported on 2.8% of returns)
Here:
+$1,769
State:
-$1,958
IRA payment deduction: $2,435 (reported on 2.5% of returns)
05459:
$2,435
Vermont:
$3,004
Total itemized deductions: $12,349 (20% of AGI, reported on 18.7% of returns)
Here:
$12,349
State:
$17,791
Here:
19.7% of AGI
State:
20.0% of AGI
(% of AGI for various income ranges: 3.8% for AGIs $10k-25k, 5.4% for AGIs $25k-50k, 7.6% for AGIs $50k-75k, 11.1% for AGIs $75k-100k, 9.7% for AGIs over 100k)
Charity contributions deductions: $1,000 (2% of AGI, reported on 12.2% of returns)
Here:
$1,000
State:
$2,686
Here:
1.5% of AGI
State:
2.8% of AGI
(% of AGI for various income ranges: 0.1% for AGIs $10k-25k, 0.2% for AGIs $25k-50k, 0.5% for AGIs $50k-75k, 1.0% for AGIs $75k-100k)
Total tax: $3,422 (reported on 80.3% of returns)
05459:
$3,422
State:
$6,533
(% of AGI for various income ranges: 2.6% for AGIs below $10k, 5.1% for AGIs $10k-25k, 7.3% for AGIs $25k-50k, 8.6% for AGIs $50k-75k, 10.2% for AGIs $75k-100k, 14.4% for AGIs over 100k)
Earned income credit: $1,682 (reported on 16.1% of returns)
Here:
$1,682
State:
$1,432
Percentage of individuals using paid preparers for their 2004 taxes: 58.6%
Here:
59%
State:
54%
(% for various income ranges: 48.8% for AGIs below $10k, 57.6% for AGIs $10k-25k, 61.2% for AGIs $25k-50k, 61.6% for AGIs $50k-75k, 82.5% for AGIs $75k-100k)
Household received Food Stamps/SNAP in the past 12 months: 40 Household did not receive Food Stamps/SNAP in the past 12 months: 703
Women who did not have a birth in the past 12 months: 298 (89 now married, 207 unmarried)
Housing units in zip code 05459 with a mortgage: 406 Median monthly owner costs for units with a mortgage: $1,570 Median monthly owner costs for units without a mortgage: $488
Residents with income below the poverty level in 2022:
This zip code:
2.3%
Whole state:
10.4%
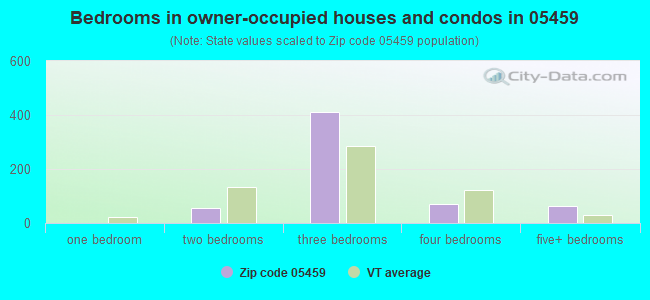
Median number of rooms in houses and condos:
Here:
6.0
State:
6.4
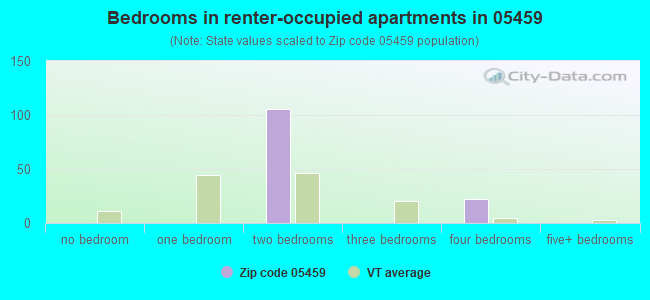
Median number of rooms in apartments:
Here:
4.4
State:
3.9
Notable locations in this zip code not listed on our city pages
Size of family households: 257 2-persons, 191 3-persons, 59 4-persons
Size of nonfamily households: 132 1-person, 54 2-persons, 34 3-persons
99 married couples with children.
186 single-parent households (130 men, 56 women).
97.8% of residents of 05459 zip code speak English at home.
2.0% of residents speak other Indo-European language at home (37% very well, 63% well).
Foreign born population: 40 (2.2%) (71.3% of them are naturalized citizens)
This zip code:
2.2%
Whole state:
4.2%
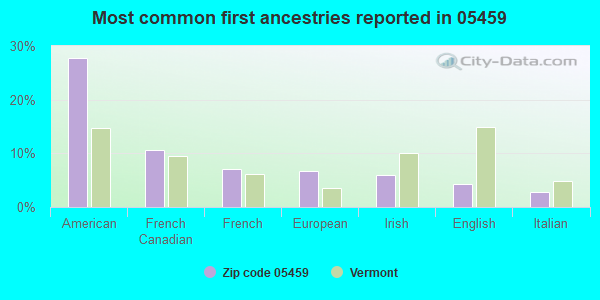
28%American
11%French Canadian
7%French
7%European
6%Irish
4%English
3%Italian
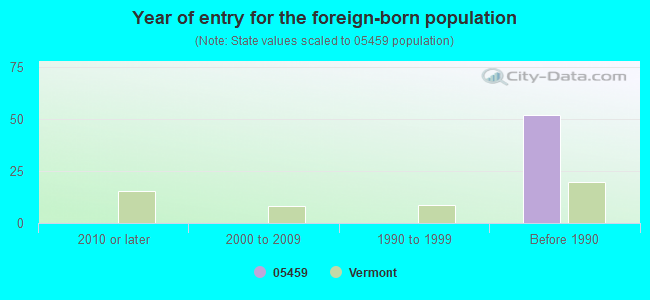
Year of entry for the foreign-born population
02010 or later
02000 to 2009
01990 to 1999
52Before 1990
Facilities with environmental interests located in this zip code:
VERMONT EGG FARMS INC (TARTE RD in HIGHGATE CENTER, VT)
National Pollutant Discharge Elimination System NON-MAJOR (Tracking pollutant discharge elimination systems) - permit National Pollutant Discharge Elimination System NON-MAJOR (Tracking pollutant discharge elimination systems) - permit
SAFETY KLEEN NE INC TOWN OF HIGHGATE (RTE 87 TRANSFER STA in HIGHGATE, VT)
(Resource Conservation and Recovery Act (tracking hazardous waste))
CARROLL CONCRETE (1745 FRONTAGE RD in HIGHGATE, VT)
Conditionally Exempt Small Quantity Generators, less than 100 kg/month of hazardous waste (Resource Conservation and Recovery Act (tracking hazardous waste)) - notification USED OIL PROGRAM (Resource Conservation and Recovery Act (tracking hazardous waste)) Organizations: NEWPORT SAND & GRAVEL CO INC (CONTACT/OWNER)
S B COLLINS INC M & R BEVERAGE (GORE RD in HIGHGATE, VT)
Conditionally Exempt Small Quantity Generators, less than 100 kg/month of hazardous waste (Resource Conservation and Recovery Act (tracking hazardous waste)) Organizations: M & R BEVERAGE CORP (CONTACT/OPERATOR)
, MICHAEL FONTAINE (CONTACT/OWNER)
VERMONT BRICK MANUFACTURING (ROUTE 78 in HIGHGATE CENTER, VT)
AIR MINOR (AIRS/AFS) Business SIC classification: BRICK AND STRUCTURAL CLAY TILE
BOUCHER EQUIPMENT CO (482 VT RTE 78 in HIGHGATE, VT)
Conditionally Exempt Small Quantity Generators, less than 100 kg/month of hazardous waste (Resource Conservation and Recovery Act (tracking hazardous waste)) - notification Organizations: JAMES & SHEILA BOUCHER (CONTACT/OWNER)
CASELLA WASTE MANAGEMENT INC (TRANSFER STATION RD in HIGHGATE, VT)
Conditionally Exempt Small Quantity Generators, less than 100 kg/month of hazardous waste (Resource Conservation and Recovery Act (tracking hazardous waste)) - notification
LAPOINTE AUTO BODY (416 BROSSEAU RD in HIGHGATE CTR, VT)
Conditionally Exempt Small Quantity Generators, less than 100 kg/month of hazardous waste (Resource Conservation and Recovery Act (tracking hazardous waste)) - notification Organizations: GERAYD LAPOINTE (CONTACT/OWNER)
RAYS EXTRUSION DIES & TUBING CO (718 RTE 78 EAST in HIGHGATE CENTER, VT)
Small Quantity Generators, between 100 kg and 1000 kg of hazardous waste/month (Resource Conservation and Recovery Act (tracking hazardous waste)) Organizations: PR: RAYMOND EILEEN & KEVIN GADUE (CONTACT/OWNER)
Housing units lacking complete kitchen facilities: 1.4%
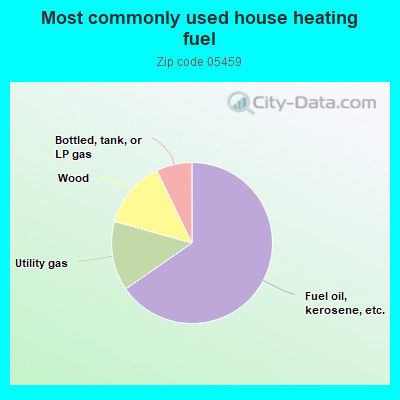
65.5%Fuel oil, kerosene, etc.
14.0%Utility gas
13.5%Wood
7.2%Bottled, tank, or LP gas
Population in 1990: 1,567. Population change in the 1990s: +385 (+24.6%).
Place of birth for U.S.-born residents:
This state: 1,672
Northeast: 59
South: 12
70% of the 05459 zip code residents lived in the same house 5 years ago. Out of people who lived in different houses, 79% lived in this county. Out of people who lived in different counties, 50% lived in Vermont.
85% of the 05459 zip code residents lived in the same house 1 year ago. Out of people who lived in different houses, 96% moved from this county.
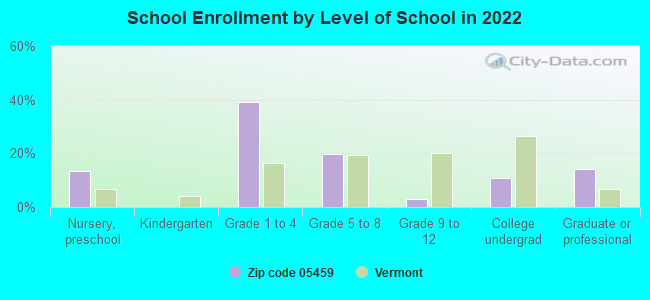
Private vs. public school enrollment:
Students in private schools in grades 1 to 8 (elementary and middle school):
Here:
0.0%
Vermont:
10.3%
Students in private schools in grades 9 to 12 (high school): 3
Here:
49.6%
Vermont:
11.6%
Students in private undergraduate colleges:
Here:
0.0%
Vermont:
29.2%
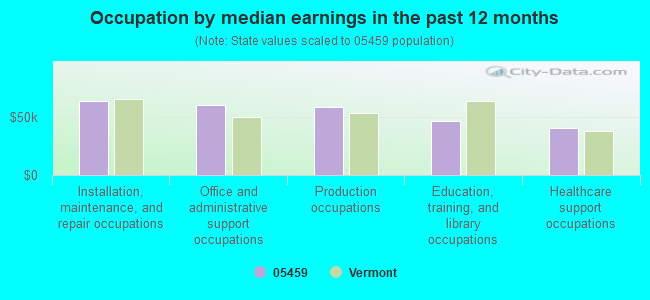
Occupation by median earnings in the past 12 months ($)
64,270Installation, maintenance, and repair occupations
60,196Office and administrative support occupations
59,001Production occupations
46,984Education, training, and library occupations
40,618Healthcare support occupations
Top industries in this zip code by the number of employees in 2005:
Construction: Poured Concrete Foundation and Structure Contractors (5-9 employees: 2 establishments, 1-4 employees: 1 establishment)
Administrative and Support and Waste Management and Remediation Services: Septic Tank and Related Services (10-19: 1)
Professional, Scientific, and Technical Services: Veterinary Services (5-9: 1)
Construction: Site Preparation Contractors (1-4: 2)
Home Mortgage Disclosure Act Aggregated Statistics For Year 2009 (Based on 4 partial tracts)
A) FHA, FSA/RHS & VA Home Purchase Loans
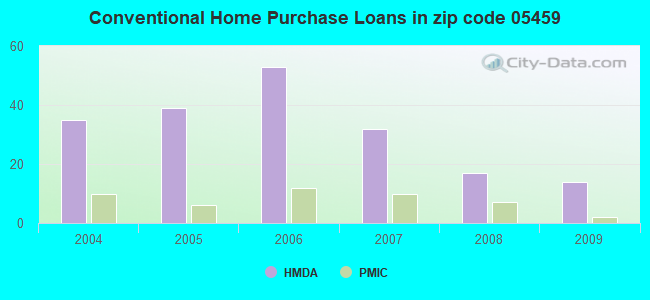
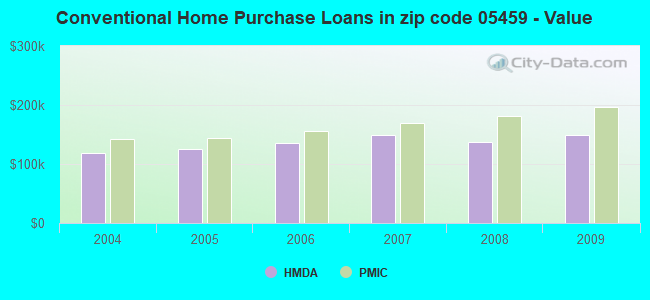
B) Conventional Home Purchase Loans
C) Refinancings
D) Home Improvement Loans
F) Non-occupant Loans on < 5 Family Dwellings (A B C & D)
G) Loans On Manufactured Home Dwelling (A B C & D)
Number
Average Value
Number
Average Value
Number
Average Value
Number
Average Value
Number
Average Value
Number
Average Value
LOANS ORIGINATED
5
$175,622
14
$148,945
78
$146,318
13
$86,492
3
$135,063
9
$99,022
APPLICATIONS APPROVED, NOT ACCEPTED
0
$0
0
$0
11
$102,077
1
$51,560
0
$0
2
$65,415
APPLICATIONS DENIED
2
$137,180
3
$144,427
34
$158,175
3
$41,687
2
$132,180
5
$93,506
APPLICATIONS WITHDRAWN
1
$168,160
1
$96,200
17
$156,365
0
$0
1
$111,590
0
$0
FILES CLOSED FOR INCOMPLETENESS
0
$0
0
$0
3
$157,767
0
$0
0
$0
0
$0
Aggregated Statistics For Year 2008 (Based on 4 partial tracts)
A) FHA, FSA/RHS & VA Home Purchase Loans
B) Conventional Home Purchase Loans
C) Refinancings
D) Home Improvement Loans
F) Non-occupant Loans on < 5 Family Dwellings (A B C & D)
G) Loans On Manufactured Home Dwelling (A B C & D)
Number
Average Value
Number
Average Value
Number
Average Value
Number
Average Value
Number
Average Value
Number
Average Value
LOANS ORIGINATED
5
$176,778
17
$137,170
63
$132,127
20
$42,328
6
$110,502
13
$89,599
APPLICATIONS APPROVED, NOT ACCEPTED
0
$0
3
$172,263
12
$111,688
2
$61,375
0
$0
3
$97,867
APPLICATIONS DENIED
2
$135,640
9
$125,958
41
$151,827
5
$25,320
2
$90,430
10
$117,710
APPLICATIONS WITHDRAWN
1
$125,830
3
$127,627
18
$186,350
0
$0
2
$214,140
2
$83,885
FILES CLOSED FOR INCOMPLETENESS
0
$0
1
$154,690
4
$152,092
1
$73,880
1
$140,450
0
$0
Aggregated Statistics For Year 2007 (Based on 4 partial tracts)
A) FHA, FSA/RHS & VA Home Purchase Loans
B) Conventional Home Purchase Loans
C) Refinancings
D) Home Improvement Loans
F) Non-occupant Loans on < 5 Family Dwellings (A B C & D)
G) Loans On Manufactured Home Dwelling (A B C & D)
Number
Average Value
Number
Average Value
Number
Average Value
Number
Average Value
Number
Average Value
Number
Average Value
LOANS ORIGINATED
2
$218,565
32
$149,507
55
$127,754
17
$50,545
5
$96,508
14
$97,547
APPLICATIONS APPROVED, NOT ACCEPTED
1
$122,370
5
$126,522
12
$118,422
2
$125,060
0
$0
2
$119,290
APPLICATIONS DENIED
1
$75,810
9
$122,880
44
$145,559
7
$44,747
2
$119,480
7
$103,236
APPLICATIONS WITHDRAWN
0
$0
4
$161,422
21
$157,163
1
$20,780
2
$122,365
1
$113,130
FILES CLOSED FOR INCOMPLETENESS
0
$0
0
$0
7
$212,080
0
$0
0
$0
0
$0
Aggregated Statistics For Year 2006 (Based on 4 partial tracts)
A) FHA, FSA/RHS & VA Home Purchase Loans
B) Conventional Home Purchase Loans
C) Refinancings
D) Home Improvement Loans
F) Non-occupant Loans on < 5 Family Dwellings (A B C & D)
G) Loans On Manufactured Home Dwelling (A B C & D)
Number
Average Value
Number
Average Value
Number
Average Value
Number
Average Value
Number
Average Value
Number
Average Value
LOANS ORIGINATED
1
$263,970
53
$135,326
67
$117,864
27
$59,202
9
$118,903
21
$87,185
APPLICATIONS APPROVED, NOT ACCEPTED
0
$0
5
$140,222
10
$116,171
8
$95,911
0
$0
2
$73,495
APPLICATIONS DENIED
0
$0
9
$173,801
46
$130,071
13
$77,256
1
$190,090
7
$94,056
APPLICATIONS WITHDRAWN
0
$0
3
$116,593
27
$137,231
1
$95,430
2
$75,805
2
$61,760
FILES CLOSED FOR INCOMPLETENESS
0
$0
1
$100,050
7
$113,901
0
$0
0
$0
0
$0
Aggregated Statistics For Year 2005 (Based on 4 partial tracts)
A) FHA, FSA/RHS & VA Home Purchase Loans
B) Conventional Home Purchase Loans
C) Refinancings
D) Home Improvement Loans
F) Non-occupant Loans on < 5 Family Dwellings (A B C & D)
G) Loans On Manufactured Home Dwelling (A B C & D)
Number
Average Value
Number
Average Value
Number
Average Value
Number
Average Value
Number
Average Value
Number
Average Value
LOANS ORIGINATED
2
$187,780
39
$125,662
78
$126,007
19
$61,608
6
$119,802
12
$89,722
APPLICATIONS APPROVED, NOT ACCEPTED
0
$0
3
$134,937
9
$106,718
2
$40,980
1
$118,520
0
$0
APPLICATIONS DENIED
0
$0
10
$118,788
43
$116,720
12
$52,172
1
$61,950
10
$83,886
APPLICATIONS WITHDRAWN
0
$0
9
$101,544
30
$121,699
2
$26,165
1
$107,360
6
$91,133
FILES CLOSED FOR INCOMPLETENESS
0
$0
1
$101,200
11
$125,270
0
$0
0
$0
0
$0
Aggregated Statistics For Year 2004 (Based on 4 partial tracts)
A) FHA, FSA/RHS & VA Home Purchase Loans
B) Conventional Home Purchase Loans
C) Refinancings
D) Home Improvement Loans
F) Non-occupant Loans on < 5 Family Dwellings (A B C & D)
G) Loans On Manufactured Home Dwelling (A B C & D)
Detailed PMIC statistics for the following Tracts:0101.00
2003 - 2018 National Fire Incident Reporting System (NFIRS) incidents
According to the data from the years 2003 - 2018 the average number of fires per year is 11. The highest number of fire incidents - 29 took place in 2011, and the least - 3 in 2003. The data has a rising trend.
When looking into fire subcategories, the most incidents belonged to: Structure Fires (52.5%), and Outside Fires (33.1%).
Fire incident types reported to NFIRS in Zip Code 05459


+$1,769
-$1,958
 Nearest zip codes: 05485, 05483, 05457, 05488, 05455, 05478.


 According to the data from the years 2003 - 2018 the average number of fires per year is 11. The highest number of fire incidents - 29 took place in 2011, and the least - 3 in 2003. The data has a rising trend.
 When looking into fire subcategories, the most incidents belonged to: Structure Fires (52.5%), and Outside Fires (33.1%).