Estimated zip code population in 2022: 3,273
Zip code population in 2010: 3,654
Zip code population in 2000: 3,676
Houses and condos: 2,126
Renter-occupied apartments: 1,808
% of renters here:
95%State:
34%
March 2022 cost of living index in zip code 06702: 147.7
(very high, U.S. average is 100)
Land area: 0.6
sq. mi.
Water area: 0.0
sq. mi.
Population density: 5,119 people per square mile (average).
OSM Map
Google Map
MSN Map
OSM Map
General Map
Google Map
MSN Map
OSM Map
Google Map
MSN Map
OSM Map
Google Map
MSN Map
Please wait while loading the map...
Real estate property taxes paid for housing units in 2022:
This zip code:
1.7% ($4,862)Connecticut:
1.8% ($6,189)
Profiles of local businesses
Business Search - 14 Million verified businesses
Males: 1,706 Females: 1,567
For population 25 years and over in 06702:
High school or higher: 72.3%Bachelor's degree or higher: 9.0%Graduate or professional degree: 2.9%Unemployed: 19.2%Mean travel time to work (commute): 40.4 minutes
For population 15 years and over in 06702:
Never married: 42.9%Now married: 16.6%Separated: 3.9%Widowed: 9.3%Divorced: 27.3%
Zip code 06702 compared to state average:
Median household income significantly below state average. Unemployed percentage significantly above state average. Black race population percentage significantly above state average. Hispanic race population percentage above state average. Median age significantly above state average. Renting percentage significantly above state average. Length of stay since moving in significantly below state average. Number of rooms per house significantly below state average. Number of college students significantly below state average. Percentage of population with a bachelor's degree or higher significantly below state average. 1,447 44.2% Hispanic or Latino 1,043 31.9% Black 720 22.0% White 38 1.2% Some other race 19 0.6% Two or more races 4 0.1% Asian
Data:
Median household income ($)
Median household income (% change since 2000)
Household income diversity
Ratio of average income to average house value (%)
Ratio of average income to average rent
Median household income ($) - White
Median household income ($) - Black or African American
Median household income ($) - Asian
Median household income ($) - Hispanic or Latino
Median household income ($) - American Indian and Alaska Native
Median household income ($) - Multirace
Median household income ($) - Other Race
Median household income for houses/condos with a mortgage ($)
Median household income for apartments without a mortgage ($)
Races - White alone (%)
Races - White alone (% change since 2000)
Races - Black alone (%)
Races - Black alone (% change since 2000)
Races - American Indian alone (%)
Races - American Indian alone (% change since 2000)
Races - Asian alone (%)
Races - Asian alone (% change since 2000)
Races - Hispanic (%)
Races - Hispanic (% change since 2000)
Races - Native Hawaiian and Other Pacific Islander alone (%)
Races - Native Hawaiian and Other Pacific Islander alone (% change since 2000)
Races - Two or more races (%)
Races - Two or more races (% change since 2000)
Races - Other race alone (%)
Races - Other race alone (% change since 2000)
Racial diversity
Unemployment (%)
Unemployment (% change since 2000)
Unemployment (%) - White
Unemployment (%) - Black or African American
Unemployment (%) - Asian
Unemployment (%) - Hispanic or Latino
Unemployment (%) - American Indian and Alaska Native
Unemployment (%) - Multirace
Unemployment (%) - Other Race
Population density (people per square mile)
Population - Males (%)
Population - Females (%)
Population - Males (%) - White
Population - Males (%) - Black or African American
Population - Males (%) - Asian
Population - Males (%) - Hispanic or Latino
Population - Males (%) - American Indian and Alaska Native
Population - Males (%) - Multirace
Population - Males (%) - Other Race
Population - Females (%) - White
Population - Females (%) - Black or African American
Population - Females (%) - Asian
Population - Females (%) - Hispanic or Latino
Population - Females (%) - American Indian and Alaska Native
Population - Females (%) - Multirace
Population - Females (%) - Other Race
Coronavirus confirmed cases (Apr 16, 2024)
Deaths caused by coronavirus (Apr 16, 2024)
Coronavirus confirmed cases (per 100k population) (Apr 16, 2024)
Deaths caused by coronavirus (per 100k population) (Apr 16, 2024)
Daily increase in number of cases (Apr 16, 2024)
Weekly increase in number of cases (Apr 16, 2024)
Cases doubled (in days) (Apr 16, 2024)
Hospitalized patients (Apr 18, 2022)
Negative test results (Apr 18, 2022)
Total test results (Apr 18, 2022)
COVID Vaccine doses distributed (per 100k population) (Sep 19, 2023)
COVID Vaccine doses administered (per 100k population) (Sep 19, 2023)
COVID Vaccine doses distributed (Sep 19, 2023)
COVID Vaccine doses administered (Sep 19, 2023)
Likely homosexual households (%)
Likely homosexual households (% change since 2000)
Likely homosexual households - Lesbian couples (%)
Likely homosexual households - Lesbian couples (% change since 2000)
Likely homosexual households - Gay men (%)
Likely homosexual households - Gay men (% change since 2000)
Cost of living index
Median gross rent ($)
Median contract rent ($)
Median monthly housing costs ($)
Median house or condo value ($)
Median house or condo value ($ change since 2000)
Mean house or condo value by units in structure - 1, detached ($)
Mean house or condo value by units in structure - 1, attached ($)
Mean house or condo value by units in structure - 2 ($)
Mean house or condo value by units in structure by units in structure - 3 or 4 ($)
Mean house or condo value by units in structure - 5 or more ($)
Mean house or condo value by units in structure - Boat, RV, van, etc. ($)
Mean house or condo value by units in structure - Mobile home ($)
Median house or condo value ($) - White
Median house or condo value ($) - Black or African American
Median house or condo value ($) - Asian
Median house or condo value ($) - Hispanic or Latino
Median house or condo value ($) - American Indian and Alaska Native
Median house or condo value ($) - Multirace
Median house or condo value ($) - Other Race
Median resident age
Resident age diversity
Median resident age - Males
Median resident age - Females
Median resident age - White
Median resident age - Black or African American
Median resident age - Asian
Median resident age - Hispanic or Latino
Median resident age - American Indian and Alaska Native
Median resident age - Multirace
Median resident age - Other Race
Median resident age - Males - White
Median resident age - Males - Black or African American
Median resident age - Males - Asian
Median resident age - Males - Hispanic or Latino
Median resident age - Males - American Indian and Alaska Native
Median resident age - Males - Multirace
Median resident age - Males - Other Race
Median resident age - Females - White
Median resident age - Females - Black or African American
Median resident age - Females - Asian
Median resident age - Females - Hispanic or Latino
Median resident age - Females - American Indian and Alaska Native
Median resident age - Females - Multirace
Median resident age - Females - Other Race
Commute - mean travel time to work (minutes)
Travel time to work - Less than 5 minutes (%)
Travel time to work - Less than 5 minutes (% change since 2000)
Travel time to work - 5 to 9 minutes (%)
Travel time to work - 5 to 9 minutes (% change since 2000)
Travel time to work - 10 to 19 minutes (%)
Travel time to work - 10 to 19 minutes (% change since 2000)
Travel time to work - 20 to 29 minutes (%)
Travel time to work - 20 to 29 minutes (% change since 2000)
Travel time to work - 30 to 39 minutes (%)
Travel time to work - 30 to 39 minutes (% change since 2000)
Travel time to work - 40 to 59 minutes (%)
Travel time to work - 40 to 59 minutes (% change since 2000)
Travel time to work - 60 to 89 minutes (%)
Travel time to work - 60 to 89 minutes (% change since 2000)
Travel time to work - 90 or more minutes (%)
Travel time to work - 90 or more minutes (% change since 2000)
Marital status - Never married (%)
Marital status - Now married (%)
Marital status - Separated (%)
Marital status - Widowed (%)
Marital status - Divorced (%)
Median family income ($)
Median family income (% change since 2000)
Median non-family income ($)
Median non-family income (% change since 2000)
Median per capita income ($)
Median per capita income (% change since 2000)
Median family income ($) - White
Median family income ($) - Black or African American
Median family income ($) - Asian
Median family income ($) - Hispanic or Latino
Median family income ($) - American Indian and Alaska Native
Median family income ($) - Multirace
Median family income ($) - Other Race
Median year house/condo built
Median year apartment built
Year house built - Built 2005 or later (%)
Year house built - Built 2000 to 2004 (%)
Year house built - Built 1990 to 1999 (%)
Year house built - Built 1980 to 1989 (%)
Year house built - Built 1970 to 1979 (%)
Year house built - Built 1960 to 1969 (%)
Year house built - Built 1950 to 1959 (%)
Year house built - Built 1940 to 1949 (%)
Year house built - Built 1939 or earlier (%)
Average household size
Household density (households per square mile)
Average household size - White
Average household size - Black or African American
Average household size - Asian
Average household size - Hispanic or Latino
Average household size - American Indian and Alaska Native
Average household size - Multirace
Average household size - Other Race
Occupied housing units (%)
Vacant housing units (%)
Owner occupied housing units (%)
Renter occupied housing units (%)
Vacancy status - For rent (%)
Vacancy status - For sale only (%)
Vacancy status - Rented or sold, not occupied (%)
Vacancy status - For seasonal, recreational, or occasional use (%)
Vacancy status - For migrant workers (%)
Vacancy status - Other vacant (%)
Residents with income below the poverty level (%)
Residents with income below 50% of the poverty level (%)
Children below poverty level (%)
Poor families by family type - Married-couple family (%)
Poor families by family type - Male, no wife present (%)
Poor families by family type - Female, no husband present (%)
Poverty status for native-born residents (%)
Poverty status for foreign-born residents (%)
Poverty among high school graduates not in families (%)
Poverty among people who did not graduate high school not in families (%)
Residents with income below the poverty level (%) - White
Residents with income below the poverty level (%) - Black or African American
Residents with income below the poverty level (%) - Asian
Residents with income below the poverty level (%) - Hispanic or Latino
Residents with income below the poverty level (%) - American Indian and Alaska Native
Residents with income below the poverty level (%) - Multirace
Residents with income below the poverty level (%) - Other Race
Air pollution - Air Quality Index (AQI)
Air pollution - CO
Air pollution - NO2
Air pollution - SO2
Air pollution - Ozone
Air pollution - PM10
Air pollution - PM25
Air pollution - Pb
Crime - Murders per 100,000 population
Crime - Rapes per 100,000 population
Crime - Robberies per 100,000 population
Crime - Assaults per 100,000 population
Crime - Burglaries per 100,000 population
Crime - Thefts per 100,000 population
Crime - Auto thefts per 100,000 population
Crime - Arson per 100,000 population
Crime - City-data.com crime index
Crime - Violent crime index
Crime - Property crime index
Crime - Murders per 100,000 population (5 year average)
Crime - Rapes per 100,000 population (5 year average)
Crime - Robberies per 100,000 population (5 year average)
Crime - Assaults per 100,000 population (5 year average)
Crime - Burglaries per 100,000 population (5 year average)
Crime - Thefts per 100,000 population (5 year average)
Crime - Auto thefts per 100,000 population (5 year average)
Crime - Arson per 100,000 population (5 year average)
Crime - City-data.com crime index (5 year average)
Crime - Violent crime index (5 year average)
Crime - Property crime index (5 year average)
1996 Presidential Elections Results (%) - Democratic Party (Clinton)
1996 Presidential Elections Results (%) - Republican Party (Dole)
1996 Presidential Elections Results (%) - Other
2000 Presidential Elections Results (%) - Democratic Party (Gore)
2000 Presidential Elections Results (%) - Republican Party (Bush)
2000 Presidential Elections Results (%) - Other
2004 Presidential Elections Results (%) - Democratic Party (Kerry)
2004 Presidential Elections Results (%) - Republican Party (Bush)
2004 Presidential Elections Results (%) - Other
2008 Presidential Elections Results (%) - Democratic Party (Obama)
2008 Presidential Elections Results (%) - Republican Party (McCain)
2008 Presidential Elections Results (%) - Other
2012 Presidential Elections Results (%) - Democratic Party (Obama)
2012 Presidential Elections Results (%) - Republican Party (Romney)
2012 Presidential Elections Results (%) - Other
2016 Presidential Elections Results (%) - Democratic Party (Clinton)
2016 Presidential Elections Results (%) - Republican Party (Trump)
2016 Presidential Elections Results (%) - Other
2020 Presidential Elections Results (%) - Democratic Party (Biden)
2020 Presidential Elections Results (%) - Republican Party (Trump)
2020 Presidential Elections Results (%) - Other
Ancestries Reported - Arab (%)
Ancestries Reported - Czech (%)
Ancestries Reported - Danish (%)
Ancestries Reported - Dutch (%)
Ancestries Reported - English (%)
Ancestries Reported - French (%)
Ancestries Reported - French Canadian (%)
Ancestries Reported - German (%)
Ancestries Reported - Greek (%)
Ancestries Reported - Hungarian (%)
Ancestries Reported - Irish (%)
Ancestries Reported - Italian (%)
Ancestries Reported - Lithuanian (%)
Ancestries Reported - Norwegian (%)
Ancestries Reported - Polish (%)
Ancestries Reported - Portuguese (%)
Ancestries Reported - Russian (%)
Ancestries Reported - Scotch-Irish (%)
Ancestries Reported - Scottish (%)
Ancestries Reported - Slovak (%)
Ancestries Reported - Subsaharan African (%)
Ancestries Reported - Swedish (%)
Ancestries Reported - Swiss (%)
Ancestries Reported - Ukrainian (%)
Ancestries Reported - United States (%)
Ancestries Reported - Welsh (%)
Ancestries Reported - West Indian (%)
Ancestries Reported - Other (%)
Educational Attainment - No schooling completed (%)
Educational Attainment - Less than high school (%)
Educational Attainment - High school or equivalent (%)
Educational Attainment - Less than 1 year of college (%)
Educational Attainment - 1 or more years of college (%)
Educational Attainment - Associate degree (%)
Educational Attainment - Bachelor's degree (%)
Educational Attainment - Master's degree (%)
Educational Attainment - Professional school degree (%)
Educational Attainment - Doctorate degree (%)
School Enrollment - Nursery, preschool (%)
School Enrollment - Kindergarten (%)
School Enrollment - Grade 1 to 4 (%)
School Enrollment - Grade 5 to 8 (%)
School Enrollment - Grade 9 to 12 (%)
School Enrollment - College undergrad (%)
School Enrollment - Graduate or professional (%)
School Enrollment - Not enrolled in school (%)
School enrollment - Public schools (%)
School enrollment - Private schools (%)
School enrollment - Not enrolled (%)
Median number of rooms in houses and condos
Median number of rooms in apartments
Housing units lacking complete plumbing facilities (%)
Housing units lacking complete kitchen facilities (%)
Density of houses
Urban houses (%)
Rural houses (%)
Households with people 60 years and over (%)
Households with people 65 years and over (%)
Households with people 75 years and over (%)
Households with one or more nonrelatives (%)
Households with no nonrelatives (%)
Population in households (%)
Family households (%)
Nonfamily households (%)
Population in families (%)
Family households with own children (%)
Median number of bedrooms in owner occupied houses
Mean number of bedrooms in owner occupied houses
Median number of bedrooms in renter occupied houses
Mean number of bedrooms in renter occupied houses
Median number of vehichles in owner occupied houses
Mean number of vehichles in owner occupied houses
Median number of vehichles in renter occupied houses
Mean number of vehichles in renter occupied houses
Mortgage status - with mortgage (%)
Mortgage status - with second mortgage (%)
Mortgage status - with home equity loan (%)
Mortgage status - with both second mortgage and home equity loan (%)
Mortgage status - without a mortgage (%)
Average family size
Average family size - White
Average family size - Black or African American
Average family size - Asian
Average family size - Hispanic or Latino
Average family size - American Indian and Alaska Native
Average family size - Multirace
Average family size - Other Race
Geographical mobility - Same house 1 year ago (%)
Geographical mobility - Moved within same county (%)
Geographical mobility - Moved from different county within same state (%)
Geographical mobility - Moved from different state (%)
Geographical mobility - Moved from abroad (%)
Place of birth - Born in state of residence (%)
Place of birth - Born in other state (%)
Place of birth - Native, outside of US (%)
Place of birth - Foreign born (%)
Housing units in structures - 1, detached (%)
Housing units in structures - 1, attached (%)
Housing units in structures - 2 (%)
Housing units in structures - 3 or 4 (%)
Housing units in structures - 5 to 9 (%)
Housing units in structures - 10 to 19 (%)
Housing units in structures - 20 to 49 (%)
Housing units in structures - 50 or more (%)
Housing units in structures - Mobile home (%)
Housing units in structures - Boat, RV, van, etc. (%)
House/condo owner moved in on average (years ago)
Renter moved in on average (years ago)
Year householder moved into unit - Moved in 1999 to March 2000 (%)
Year householder moved into unit - Moved in 1995 to 1998 (%)
Year householder moved into unit - Moved in 1990 to 1994 (%)
Year householder moved into unit - Moved in 1980 to 1989 (%)
Year householder moved into unit - Moved in 1970 to 1979 (%)
Year householder moved into unit - Moved in 1969 or earlier (%)
Means of transportation to work - Drove car alone (%)
Means of transportation to work - Carpooled (%)
Means of transportation to work - Public transportation (%)
Means of transportation to work - Bus or trolley bus (%)
Means of transportation to work - Streetcar or trolley car (%)
Means of transportation to work - Subway or elevated (%)
Means of transportation to work - Railroad (%)
Means of transportation to work - Ferryboat (%)
Means of transportation to work - Taxicab (%)
Means of transportation to work - Motorcycle (%)
Means of transportation to work - Bicycle (%)
Means of transportation to work - Walked (%)
Means of transportation to work - Other means (%)
Working at home (%)
Industry diversity
Most Common Industries - Agriculture, forestry, fishing and hunting, and mining (%)
Most Common Industries - Agriculture, forestry, fishing and hunting (%)
Most Common Industries - Mining, quarrying, and oil and gas extraction (%)
Most Common Industries - Construction (%)
Most Common Industries - Manufacturing (%)
Most Common Industries - Wholesale trade (%)
Most Common Industries - Retail trade (%)
Most Common Industries - Transportation and warehousing, and utilities (%)
Most Common Industries - Transportation and warehousing (%)
Most Common Industries - Utilities (%)
Most Common Industries - Information (%)
Most Common Industries - Finance and insurance, and real estate and rental and leasing (%)
Most Common Industries - Finance and insurance (%)
Most Common Industries - Real estate and rental and leasing (%)
Most Common Industries - Professional, scientific, and management, and administrative and waste management services (%)
Most Common Industries - Professional, scientific, and technical services (%)
Most Common Industries - Management of companies and enterprises (%)
Most Common Industries - Administrative and support and waste management services (%)
Most Common Industries - Educational services, and health care and social assistance (%)
Most Common Industries - Educational services (%)
Most Common Industries - Health care and social assistance (%)
Most Common Industries - Arts, entertainment, and recreation, and accommodation and food services (%)
Most Common Industries - Arts, entertainment, and recreation (%)
Most Common Industries - Accommodation and food services (%)
Most Common Industries - Other services, except public administration (%)
Most Common Industries - Public administration (%)
Occupation diversity
Most Common Occupations - Management, business, science, and arts occupations (%)
Most Common Occupations - Management, business, and financial occupations (%)
Most Common Occupations - Management occupations (%)
Most Common Occupations - Business and financial operations occupations (%)
Most Common Occupations - Computer, engineering, and science occupations (%)
Most Common Occupations - Computer and mathematical occupations (%)
Most Common Occupations - Architecture and engineering occupations (%)
Most Common Occupations - Life, physical, and social science occupations (%)
Most Common Occupations - Education, legal, community service, arts, and media occupations (%)
Most Common Occupations - Community and social service occupations (%)
Most Common Occupations - Legal occupations (%)
Most Common Occupations - Education, training, and library occupations (%)
Most Common Occupations - Arts, design, entertainment, sports, and media occupations (%)
Most Common Occupations - Healthcare practitioners and technical occupations (%)
Most Common Occupations - Health diagnosing and treating practitioners and other technical occupations (%)
Most Common Occupations - Health technologists and technicians (%)
Most Common Occupations - Service occupations (%)
Most Common Occupations - Healthcare support occupations (%)
Most Common Occupations - Protective service occupations (%)
Most Common Occupations - Fire fighting and prevention, and other protective service workers including supervisors (%)
Most Common Occupations - Law enforcement workers including supervisors (%)
Most Common Occupations - Food preparation and serving related occupations (%)
Most Common Occupations - Building and grounds cleaning and maintenance occupations (%)
Most Common Occupations - Personal care and service occupations (%)
Most Common Occupations - Sales and office occupations (%)
Most Common Occupations - Sales and related occupations (%)
Most Common Occupations - Office and administrative support occupations (%)
Most Common Occupations - Natural resources, construction, and maintenance occupations (%)
Most Common Occupations - Farming, fishing, and forestry occupations (%)
Most Common Occupations - Construction and extraction occupations (%)
Most Common Occupations - Installation, maintenance, and repair occupations (%)
Most Common Occupations - Production, transportation, and material moving occupations (%)
Most Common Occupations - Production occupations (%)
Most Common Occupations - Transportation occupations (%)
Most Common Occupations - Material moving occupations (%)
People in Group quarters - Institutionalized population (%)
People in Group quarters - Correctional institutions (%)
People in Group quarters - Federal prisons and detention centers (%)
People in Group quarters - Halfway houses (%)
People in Group quarters - Local jails and other confinement facilities (including police lockups) (%)
People in Group quarters - Military disciplinary barracks (%)
People in Group quarters - State prisons (%)
People in Group quarters - Other types of correctional institutions (%)
People in Group quarters - Nursing homes (%)
People in Group quarters - Hospitals/wards, hospices, and schools for the handicapped (%)
People in Group quarters - Hospitals/wards and hospices for chronically ill (%)
People in Group quarters - Hospices or homes for chronically ill (%)
People in Group quarters - Military hospitals or wards for chronically ill (%)
People in Group quarters - Other hospitals or wards for chronically ill (%)
People in Group quarters - Hospitals or wards for drug/alcohol abuse (%)
People in Group quarters - Mental (Psychiatric) hospitals or wards (%)
People in Group quarters - Schools, hospitals, or wards for the mentally retarded (%)
People in Group quarters - Schools, hospitals, or wards for the physically handicapped (%)
People in Group quarters - Institutions for the deaf (%)
People in Group quarters - Institutions for the blind (%)
People in Group quarters - Orthopedic wards and institutions for the physically handicapped (%)
People in Group quarters - Wards in general hospitals for patients who have no usual home elsewhere (%)
People in Group quarters - Wards in military hospitals for patients who have no usual home elsewhere (%)
People in Group quarters - Juvenile institutions (%)
People in Group quarters - Long-term care (%)
People in Group quarters - Homes for abused, dependent, and neglected children (%)
People in Group quarters - Residential treatment centers for emotionally disturbed children (%)
People in Group quarters - Training schools for juvenile delinquents (%)
People in Group quarters - Short-term care, detention or diagnostic centers for delinquent children (%)
People in Group quarters - Type of juvenile institution unknown (%)
People in Group quarters - Noninstitutionalized population (%)
People in Group quarters - College dormitories (includes college quarters off campus) (%)
People in Group quarters - Military quarters (%)
People in Group quarters - On base (%)
People in Group quarters - Barracks, unaccompanied personnel housing (UPH), (Enlisted/Officer), ;and similar group living quarters for military personnel (%)
People in Group quarters - Transient quarters for temporary residents (%)
People in Group quarters - Military ships (%)
People in Group quarters - Group homes (%)
People in Group quarters - Homes or halfway houses for drug/alcohol abuse (%)
People in Group quarters - Homes for the mentally ill (%)
People in Group quarters - Homes for the mentally retarded (%)
People in Group quarters - Homes for the physically handicapped (%)
People in Group quarters - Other group homes (%)
People in Group quarters - Religious group quarters (%)
People in Group quarters - Dormitories (%)
People in Group quarters - Agriculture workers' dormitories on farms (%)
People in Group quarters - Job Corps and vocational training facilities (%)
People in Group quarters - Other workers' dormitories (%)
People in Group quarters - Crews of maritime vessels (%)
People in Group quarters - Other nonhousehold living situations (%)
People in Group quarters - Other noninstitutional group quarters (%)
Residents speaking English at home (%)
Residents speaking English at home - Born in the United States (%)
Residents speaking English at home - Native, born elsewhere (%)
Residents speaking English at home - Foreign born (%)
Residents speaking Spanish at home (%)
Residents speaking Spanish at home - Born in the United States (%)
Residents speaking Spanish at home - Native, born elsewhere (%)
Residents speaking Spanish at home - Foreign born (%)
Residents speaking other language at home (%)
Residents speaking other language at home - Born in the United States (%)
Residents speaking other language at home - Native, born elsewhere (%)
Residents speaking other language at home - Foreign born (%)
Class of Workers - Employee of private company (%)
Class of Workers - Self-employed in own incorporated business (%)
Class of Workers - Private not-for-profit wage and salary workers (%)
Class of Workers - Local government workers (%)
Class of Workers - State government workers (%)
Class of Workers - Federal government workers (%)
Class of Workers - Self-employed workers in own not incorporated business and Unpaid family workers (%)
House heating fuel used in houses and condos - Utility gas (%)
House heating fuel used in houses and condos - Bottled, tank, or LP gas (%)
House heating fuel used in houses and condos - Electricity (%)
House heating fuel used in houses and condos - Fuel oil, kerosene, etc. (%)
House heating fuel used in houses and condos - Coal or coke (%)
House heating fuel used in houses and condos - Wood (%)
House heating fuel used in houses and condos - Solar energy (%)
House heating fuel used in houses and condos - Other fuel (%)
House heating fuel used in houses and condos - No fuel used (%)
House heating fuel used in apartments - Utility gas (%)
House heating fuel used in apartments - Bottled, tank, or LP gas (%)
House heating fuel used in apartments - Electricity (%)
House heating fuel used in apartments - Fuel oil, kerosene, etc. (%)
House heating fuel used in apartments - Coal or coke (%)
House heating fuel used in apartments - Wood (%)
House heating fuel used in apartments - Solar energy (%)
House heating fuel used in apartments - Other fuel (%)
House heating fuel used in apartments - No fuel used (%)
Armed forces status - In Armed Forces (%)
Armed forces status - Civilian (%)
Armed forces status - Civilian - Veteran (%)
Armed forces status - Civilian - Nonveteran (%)
Fatal accidents locations in years 2005-2021
Fatal accidents locations in 2005
Fatal accidents locations in 2006
Fatal accidents locations in 2007
Fatal accidents locations in 2008
Fatal accidents locations in 2009
Fatal accidents locations in 2010
Fatal accidents locations in 2011
Fatal accidents locations in 2012
Fatal accidents locations in 2013
Fatal accidents locations in 2014
Fatal accidents locations in 2015
Fatal accidents locations in 2016
Fatal accidents locations in 2017
Fatal accidents locations in 2018
Fatal accidents locations in 2019
Fatal accidents locations in 2020
Fatal accidents locations in 2021
Alcohol use - People drinking some alcohol every month (%)
Alcohol use - People not drinking at all (%)
Alcohol use - Average days/month drinking alcohol
Alcohol use - Average drinks/week
Alcohol use - Average days/year people drink much
Audiometry - Average condition of hearing (%)
Audiometry - People that can hear a whisper from across a quiet room (%)
Audiometry - People that can hear normal voice from across a quiet room (%)
Audiometry - Ears ringing, roaring, buzzing (%)
Audiometry - Had a job exposure to loud noise (%)
Audiometry - Had off-work exposure to loud noise (%)
Blood Pressure & Cholesterol - Has high blood pressure (%)
Blood Pressure & Cholesterol - Checking blood pressure at home (%)
Blood Pressure & Cholesterol - Frequently checking blood cholesterol (%)
Blood Pressure & Cholesterol - Has high cholesterol level (%)
Consumer Behavior - Money monthly spent on food at supermarket/grocery store
Consumer Behavior - Money monthly spent on food at other stores
Consumer Behavior - Money monthly spent on eating out
Consumer Behavior - Money monthly spent on carryout/delivered foods
Consumer Behavior - Income spent on food at supermarket/grocery store (%)
Consumer Behavior - Income spent on food at other stores (%)
Consumer Behavior - Income spent on eating out (%)
Consumer Behavior - Income spent on carryout/delivered foods (%)
Current Health Status - General health condition (%)
Current Health Status - Blood donors (%)
Current Health Status - Has blood ever tested for HIV virus (%)
Current Health Status - Left-handed people (%)
Dermatology - People using sunscreen (%)
Diabetes - Diabetics (%)
Diabetes - Had a blood test for high blood sugar (%)
Diabetes - People taking insulin (%)
Diet Behavior & Nutrition - Diet health (%)
Diet Behavior & Nutrition - Milk product consumption (# of products/month)
Diet Behavior & Nutrition - Meals not home prepared (#/week)
Diet Behavior & Nutrition - Meals from fast food or pizza place (#/week)
Diet Behavior & Nutrition - Ready-to-eat foods (#/month)
Diet Behavior & Nutrition - Frozen meals/pizza (#/month)
Drug Use - People that ever used marijuana or hashish (%)
Drug Use - Ever used hard drugs (%)
Drug Use - Ever used any form of cocaine (%)
Drug Use - Ever used heroin (%)
Drug Use - Ever used methamphetamine (%)
Health Insurance - People covered by health insurance (%)
Kidney Conditions-Urology - Avg. # of times urinating at night
Medical Conditions - People with asthma (%)
Medical Conditions - People with anemia (%)
Medical Conditions - People with psoriasis (%)
Medical Conditions - People with overweight (%)
Medical Conditions - Elderly people having difficulties in thinking or remembering (%)
Medical Conditions - People who ever received blood transfusion (%)
Medical Conditions - People having trouble seeing even with glass/contacts (%)
Medical Conditions - People with arthritis (%)
Medical Conditions - People with gout (%)
Medical Conditions - People with congestive heart failure (%)
Medical Conditions - People with coronary heart disease (%)
Medical Conditions - People with angina pectoris (%)
Medical Conditions - People who ever had heart attack (%)
Medical Conditions - People who ever had stroke (%)
Medical Conditions - People with emphysema (%)
Medical Conditions - People with thyroid problem (%)
Medical Conditions - People with chronic bronchitis (%)
Medical Conditions - People with any liver condition (%)
Medical Conditions - People who ever had cancer or malignancy (%)
Mental Health - People who have little interest in doing things (%)
Mental Health - People feeling down, depressed, or hopeless (%)
Mental Health - People who have trouble sleeping or sleeping too much (%)
Mental Health - People feeling tired or having little energy (%)
Mental Health - People with poor appetite or overeating (%)
Mental Health - People feeling bad about themself (%)
Mental Health - People who have trouble concentrating on things (%)
Mental Health - People moving or speaking slowly or too fast (%)
Mental Health - People having thoughts they would be better off dead (%)
Oral Health - Average years since last visit a dentist
Oral Health - People embarrassed because of mouth (%)
Oral Health - People with gum disease (%)
Oral Health - General health of teeth and gums (%)
Oral Health - Average days a week using dental floss/device
Oral Health - Average days a week using mouthwash for dental problem
Oral Health - Average number of teeth
Pesticide Use - Households using pesticides to control insects (%)
Pesticide Use - Households using pesticides to kill weeds (%)
Physical Activity - People doing vigorous-intensity work activities (%)
Physical Activity - People doing moderate-intensity work activities (%)
Physical Activity - People walking or bicycling (%)
Physical Activity - People doing vigorous-intensity recreational activities (%)
Physical Activity - People doing moderate-intensity recreational activities (%)
Physical Activity - Average hours a day doing sedentary activities
Physical Activity - Average hours a day watching TV or videos
Physical Activity - Average hours a day using computer
Physical Functioning - People having limitations keeping them from working (%)
Physical Functioning - People limited in amount of work they can do (%)
Physical Functioning - People that need special equipment to walk (%)
Physical Functioning - People experiencing confusion/memory problems (%)
Physical Functioning - People requiring special healthcare equipment (%)
Prescription Medications - Average number of prescription medicines taking
Preventive Aspirin Use - Adults 40+ taking low-dose aspirin (%)
Reproductive Health - Vaginal deliveries (%)
Reproductive Health - Cesarean deliveries (%)
Reproductive Health - Deliveries resulted in a live birth (%)
Reproductive Health - Pregnancies resulted in a delivery (%)
Reproductive Health - Women breastfeeding newborns (%)
Reproductive Health - Women that had a hysterectomy (%)
Reproductive Health - Women that had both ovaries removed (%)
Reproductive Health - Women that have ever taken birth control pills (%)
Reproductive Health - Women taking birth control pills (%)
Reproductive Health - Women that have ever used Depo-Provera or injectables (%)
Reproductive Health - Women that have ever used female hormones (%)
Sexual Behavior - People 18+ that ever had sex (vaginal, anal, or oral) (%)
Sexual Behavior - Males 18+ that ever had vaginal sex with a woman (%)
Sexual Behavior - Males 18+ that ever performed oral sex on a woman (%)
Sexual Behavior - Males 18+ that ever had anal sex with a woman (%)
Sexual Behavior - Males 18+ that ever had any sex with a man (%)
Sexual Behavior - Females 18+ that ever had vaginal sex with a man (%)
Sexual Behavior - Females 18+ that ever performed oral sex on a man (%)
Sexual Behavior - Females 18+ that ever had anal sex with a man (%)
Sexual Behavior - Females 18+ that ever had any kind of sex with a woman (%)
Sexual Behavior - Average age people first had sex
Sexual Behavior - Average number of female sex partners in lifetime (males 18+)
Sexual Behavior - Average number of female vaginal sex partners in lifetime (males 18+)
Sexual Behavior - Average age people first performed oral sex on a woman (18+)
Sexual Behavior - Average number of woman performed oral sex on in lifetime (18+)
Sexual Behavior - Average number of male sex partners in lifetime (males 18+)
Sexual Behavior - Average number of male anal sex partners in lifetime (males 18+)
Sexual Behavior - Average age people first performed oral sex on a man (18+)
Sexual Behavior - Average number of male oral sex partners in lifetime (18+)
Sexual Behavior - People using protection when performing oral sex (%)
Sexual Behavior - Average number of times people have vaginal or anal sex a year
Sexual Behavior - People having sex without condom (%)
Sexual Behavior - Average number of male sex partners in lifetime (females 18+)
Sexual Behavior - Average number of male vaginal sex partners in lifetime (females 18+)
Sexual Behavior - Average number of female sex partners in lifetime (females 18+)
Sexual Behavior - Circumcised males 18+ (%)
Sleep Disorders - Average hours sleeping at night
Sleep Disorders - People that has trouble sleeping (%)
Smoking-Cigarette Use - People smoking cigarettes (%)
Taste & Smell - People 40+ having problems with smell (%)
Taste & Smell - People 40+ having problems with taste (%)
Taste & Smell - People 40+ that ever had wisdom teeth removed (%)
Taste & Smell - People 40+ that ever had tonsils teeth removed (%)
Taste & Smell - People 40+ that ever had a loss of consciousness because of a head injury (%)
Taste & Smell - People 40+ that ever had a broken nose or other serious injury to face or skull (%)
Taste & Smell - People 40+ that ever had two or more sinus infections (%)
Weight - Average height (inches)
Weight - Average weight (pounds)
Weight - Average BMI
Weight - People that are obese (%)
Weight - People that ever were obese (%)
Weight - People trying to lose weight (%)
100%
urban population.
Estimated median house/condo value in 2022: $283,166
06702:
$283,166Connecticut:
$347,200
Median resident age: This zip code:
54.8 yearsConnecticut median age:
40.9 years
Average household size: This zip code:
1.5 peopleConnecticut:
2.5 people
Averages for the 2020 tax year for zip code 06702, filed in 2021:
Average Adjusted Gross Income (AGI) in 2020: $23,073 (Individual Income Tax Returns) Here:
$23,073State:
$105,931
Salary/wage: $20,340 (reported on 87.0% of returns )Here:
$20,340State:
$83,540
(% of AGI for various income ranges: 1084.7% for AGIs below $25k , 3100.3% for AGIs $25k-50k , 4018.3% for AGIs $50k-75k ) Taxable interest for individuals: $71 (reported on 6.1% of returns )This zip code:
$71Connecticut:
$3,402
(% of AGI for various income ranges: 0.3% for AGIs below $25k , 1.0% for AGIs $25k-50k ) Profit/loss from business: +$8,136 (reported on 12.2% of returns )Here:
+$8,136State:
+$22,988
(% of AGI for various income ranges: 92.4% for AGIs below $25k , 188.7% for AGIs $25k-50k ) Earned income credit: $2,304 (reported on 43.5% of returns )(% of AGI for various income ranges: 141.6% for AGIs below $25k , 91.3% for AGIs $25k-50k ) Percentage of individuals using paid preparers for their 2020 taxes: 93.9%(% for various income ranges: 93.2% for AGIs below $25k , 94.1% for AGIs $25k-50k , 100.0% for AGIs $50k-75k , 100.0% for AGIs $75k-100k )
Averages for the 2012 tax year for zip code 06702, filed in 2013:
Average Adjusted Gross Income (AGI) in 2012: $18,780 (Individual Income Tax Returns) Here:
$18,780State:
$93,290
Salary/wage: $17,482 (reported on 87.2% of returns )Here:
$17,482State:
$73,117
(% of AGI for various income ranges: 81.1% for AGIs below $25k , 91.1% for AGIs $25k-50k , 64.5% for AGIs $50k-75k ) Taxable interest for individuals: $380 (reported on 5.3% of returns )This zip code:
$380Connecticut:
$2,530
Ordinary dividends: $1,950 (reported on 2.1% of returns )Profit/loss from business: +$5,900 (reported on 11.7% of returns )Here:
+$5,900State:
+$22,741
Total itemized deductions: $15,983 (35% of AGI, reported on 6.4% of returns )Here:
$15,983State:
$33,239
Here:
35.2% of AGIState:
18.9% of AGI
Charity contributions: $1,700 (reported on 3.2% of returns )Taxes paid: $4,720 (reported on 5.3% of returns )06702:
$4,720State:
$17,397
Earned income credit: $2,498 (reported on 50.0% of returns )(% of AGI for various income ranges: 12.2% for AGIs below $25k , 2.5% for AGIs $25k-50k ) Percentage of individuals using paid preparers for their 2012 taxes: 57.4%(% for various income ranges: 56.9% for AGIs below $25k , 58.8% for AGIs $25k-50k , 60.0% for AGIs $50k-75k )
Averages for the 2004 tax year for zip code 06702, filed in 2005:
Average Adjusted Gross Income (AGI) in 2004: $18,029 (Individual Income Tax Returns) Here:
$18,029State:
$73,265
Salary/wage: $16,760 (reported on 88.0% of returns )Here:
$16,760State:
$62,030
(% of AGI for various income ranges: 87.2% for AGIs below $10k , 88.5% for AGIs $10k-25k , 88.5% for AGIs $25k-50k , 94.5% for AGIs $50k-75k , 39.8% for AGIs $75k-100k ) Taxable interest for individuals: $761 (reported on 15.7% of returns )This zip code:
$761Connecticut:
$2,287
(% of AGI for various income ranges: 0.9% for AGIs below $10k , 1.1% for AGIs $10k-25k , 0.3% for AGIs $25k-50k , 0.6% for AGIs $75k-100k ) Taxable dividends: $5,431 (reported on 5.6% of returns )(% of AGI for various income ranges: 0.7% for AGIs below $10k , 0.8% for AGIs $10k-25k , 1.2% for AGIs $25k-50k , 12.2% for AGIs $50k-75k ) Net capital gain/loss: +$15,862 (reported on 3.2% of returns )Here:
+$15,862State:
+$23,694
Profit/loss from business: +$6,140 (reported on 6.3% of returns )Here:
+$6,140State:
+$20,783
Total itemized deductions: $20,952 (44% of AGI, reported on 6.9% of returns )Here:
$20,952State:
$24,919
Here:
43.9% of AGIState:
18.6% of AGI
Charity contributions deductions: $1,761 (4% of AGI, reported on 5.1% of returns )Here:
3.8% of AGIState:
2.7% of AGI
Total tax: $2,350 (reported on 45.3% of returns )06702:
$2,350State:
$15,148
(% of AGI for various income ranges: 1.7% for AGIs below $10k , 2.7% for AGIs $10k-25k , 5.8% for AGIs $25k-50k , 9.6% for AGIs $50k-75k , 15.0% for AGIs $75k-100k ) Earned income credit: $1,753 (reported on 46.2% of returns )Percentage of individuals using paid preparers for their 2004 taxes: 70.4%(% for various income ranges: 71.0% for AGIs below $10k , 70.2% for AGIs $10k-25k , 66.2% for AGIs $25k-50k , 86.4% for AGIs $50k-75k , 85.7% for AGIs $75k-100k )
Estimated median household income in 2022: This zip code:
$14,558Connecticut:
$88,429
Nearest zip codes: 06710 ,
06708 ,
06706 ,
06704 ,
06779 ,
06705 .
Waterbury Zip Code Map
Percentage of family households: This zip code:
22.4%Connecticut:
43.6%
Percentage of households with unmarried partners: This zip code:
1.8%Connecticut:
46.0%
No gay or lesbian households reported
Household received Food Stamps/SNAP in the past 12 months: 1,507Household did not receive Food Stamps/SNAP in the past 12 months: 468
Women who had a birth in the past 12 months: 34 (16 now married , 18 unmarried) Women who did not have a birth in the past 12 months: 567 (113 now married , 461 unmarried)
Housing units in zip code 06702 with a mortgage: 80 (11
second mortgage )
Residents with income below the poverty level in 2022:
This zip code:
50.6%Whole state:
9.8%
Residents with income below 50% of the poverty level in 2022:
This zip code:
31.2%Whole state:
4.8%
Median number of rooms in houses and condos: Median number of rooms in apartments: Notable locations in this zip code not listed on our city pages
Click to draw/clear zip code borders Notable locations in zip code 06702: (A) , Connecticut State Judicial Department Law Library (B) , Waterbury Republican and American Library (C) , Waterbury Municipal Center Complex (D) , Waterbury Chamber of Commerce (E) , Silas Bronson Library (F) , Palace Theater (G) , Mattatuck Museum (H) , Mattatuck Historical Society Library (I) , Mattatuck Historical Society Building (J) , Waterbury Fire Chief's Office (K) , Waterbury Fire Department Station 10 Headquarters (L) . Display/hide their locations on the map
Shopping Center: (1) . Display/hide its location on the map
Churches in zip code 06702 include: (A) , Saint Johns Episcopal Church (B) , Sisters of Notre Dame Church (C) , Waterbury Baptist Ministries (D) , Christ Christian Methodist Episcopal Church (E) , Faith Temple Church of God (F) , Saint Marys Convent (G) . Display/hide their locations on the map
Streams, rivers, and creeks: (A) . Display/hide its location on the map
Parks in zip code 06702 include: (1) , Stanley Park (2) , Bank Street Historic District (3) , Library Park (4) . Display/hide their locations on the map
Year house built (houses)
27 2020 or later35 2010 to 201936 2000 to 200937 1990 to 1999185 1980 to 1989584 1970 to 1979107 1960 to 1969134 1950 to 195941 1940 to 1949901 1939 or earlier
Zip code 06702 household income distribution in 2022 359 Less than $10,000618 $10,000 to $14,999207 $15,000 to $19,999253 $20,000 to $24,999240 $25,000 to $29,99923 $30,000 to $34,99963 $40,000 to $44,99922 $50,000 to $59,99943 $60,000 to $74,99919 $75,000 to $99,99947 $100,000 to $124,99927 $200,000 or moreEstimate of home value of owner-occupied houses/condos in 2022 in zip code 06702 14 $100,000 to $124,99911 $150,000 to $174,99966 $250,000 to $299,999Rent paid by renters in 2022 in zip code 06702 16 Less than $100155 $100 to $14975 $150 to $199147 $200 to $249106 $250 to $29983 $300 to $34985 $350 to $39935 $400 to $449153 $550 to $599124 $600 to $64958 $650 to $699148 $700 to $749150 $750 to $799121 $800 to $899201 $900 to $999115 $1,000 to $1,24924 No cash rent
Median gross rent in 2022: $638.
Median price asked for vacant for-sale houses and condos in 2022: $243,023.
Estimated median house (or condo) value in 2022 for: Black or African American householders: $285,517Estimated median house or condo value in 2022: $283,166
06702:
$283,166Connecticut:
$347,200
Mean price in 2022: Detached houses: $208,301Here:
$208,301State:
$503,946
Townhouses or other attached units: $131,400Here:
$131,400State:
$304,959
In 2-unit structures: $174,723Here:
$174,723State:
$304,133
In 3-to-4-unit structures: $184,037Here:
$184,037State:
$272,970
In 5-or-more-unit structures: $94,759Here:
$94,759State:
$249,308
Housing units in structures:
One, attached: 16Two: 1363 or 4: 1925 to 9: 25810 to 19: 25920 to 49: 24150 or more: 1,121Unemployment : 19.2%
Means of transportation to work in zip code 06702 27.6% 184 Drove a car alone9.7% 65 Carpooled18.9% 126 Bus or trolley bus5.2% 35 Taxi30.1% 201 Walked6.0% 40 Other means3.0% 20 Worked at homeTravel time to work (commute) in zip code 06702 41 Less than 5 minutes103 5 to 9 minutes27 10 to 14 minutes152 15 to 19 minutes11 20 to 24 minutes39 30 to 34 minutes25 35 to 39 minutes21 45 to 59 minutes106 60 to 89 minutes96 90 or more minutes
Percentage of zip code residents living and working in this county: 79.7%
Household type by relationship:
Households: 3,273
Male householders: 839 (763 living alone ), Female householders: 1,074 (647 living alone )130 spouses (130 opposite-sex spouses ), 32 unmarried partners , (32 opposite-sex unmarried partners ), 610 children (610 natural , 0 adopted , 0 stepchildren ), 0 grandchildren , 87 brothers or sisters , 28 parents , 0 foster children , 72 other relatives , 0 non-relatives In group quarters: 450 (-1 institutionalized population )
Size of family households: 297 2-persons , 159 3-persons , 12 4-persons , 49 5-persons
Size of nonfamily households: 1,402 1-person , 33 2-persons
63 married couples with children. single-parent households (26 men , 268 women ).
58.4% of residents of 06702 zip code speak English at home. of residents speak Spanish at home (47% very well, 21% well, 17% not well, 15% not at all ).of residents speak other Indo-European language at home (30% very well, 26% well, 44% not at all ).of residents speak Asian or Pacific Island language at home (100% very well ).of residents speak other language at home (100% very well ).
Foreign born population: 567 (17.3%)
(19.5%
of them are naturalized citizens )
This zip code:
17.3%Whole state:
15.7%
90% Dominica 15% Brazil 3% Bolivia 2% Romania 1% France 0% Indonesia 4% Italian 2% Irish 1% Portuguese 1% Jamaican 0% American 0% Polish 0% German
Year of entry for the foreign-born population
437 2010 or later 106 2000 to 2009 277 1990 to 1999 167 Before 1990
There are
223 Medical Specialists in Zip Code 06702 .
Major facilities with environmental interests located in this zip code:
H & H CLEANING & DEBURRING INC (170 FREIGHT ST in WATERBURY, CT)
AIR SYNTHETIC MINOR (AIRS/AFS) ENFORCEMENT/COMPLIANCE ACTIVITY (Integrated Compliance Information System) - ICIS-01-2004-9095, FORMAL ENFORCEMENT ACTION (Integrated Compliance Information System) - ICIS-01-2004-9095, FORMAL ENFORCEMENT ACTION Large Quantity Generators, more that 1000 kg of hazardous waste/month (Resource Conservation and Recovery Act (tracking hazardous waste)) Business SIC classification: MANUFACTURING INDUSTRIESOrganizations: H & H PARTS CLEANING INC (CONTACT/OPERATOR)
, M R T REALTY (CONTACT/OWNER)
Alternative names: H&H PARTS CLEANING INC, H&H PARTS CLEANING INC
C.L. & P. - WATERBURY AREA WORK CENTER (250 FREIGHT STREET in WATERBURY, CT)
AIR MINOR (AIRS/AFS) AIR MONITORING SITE (Airborne pollution emission tracking) COMPLIANCE ACTIVITY (Tracking inspections of insecticide, fungicide, and rodenticide, and toxic substances) Small Quantity Generators, between 100 kg and 1000 kg of hazardous waste/month (Resource Conservation and Recovery Act (tracking hazardous waste)) - notification USED OIL PROGRAM (Resource Conservation and Recovery Act (tracking hazardous waste)) (Resource Conservation and Recovery Act (tracking hazardous waste)) Business SIC classification: ELECTRIC SERVICESOrganizations: CT LIGHT & POWER CO THE (CONTACT/OPERATOR)
, THE CONNECTICUT LIGHT (CONTACT/OWNER)
Alternative names: CONN. LIGHT & POWER, CONN LIGHT & POWER CO, CONNECTICUT LIGHT AND POWER, NORTHEAST UTILITIES, NORTHEAST UTILITIES, CONNECTICUT LIGHT AND POWER, WATERBURY REGIONAL SERVICE CENTER CL&P, WATERBURY SERVICE CTR
ENVIRONMENTAL WASTE RESOURCES INCORPORATED (130 FREIGHT STREET in WATERBURY, CT)
AIR SYNTHETIC MINOR (AIRS/AFS) (Integrated Compliance Information System) - ICIS-01-1982-0030, FORMAL ENFORCEMENT ACTION COMPLIANCE ACTIVITY (Tracking inspections of insecticide, fungicide, and rodenticide, and toxic substances) TSD (Resource Conservation and Recovery Act (tracking hazardous waste)) - notification USED OIL PROGRAM (Resource Conservation and Recovery Act (tracking hazardous waste)) Business SIC classification: REFUSE SYSTEMS; SANITARY SERVICESOrganizations: ENVIRONMENTAL WASTE REMOVAL INC (CONTACT/OPERATOR)
Alternative names: EWR
CENTURY BRASS PRODUCTS INCORPORATED (CENTURY PARK in WATERBURY, CT)
COMPLIANCE ACTIVITY (Tracking inspections of insecticide, fungicide, and rodenticide, and toxic substances) TSD (Resource Conservation and Recovery Act (tracking hazardous waste)) - notification
CONN PREC ELECTO PLATING, INC (123 MAPLE ST in WATERBURY, CT)
AIR MINOR (AIRS/AFS) (Resource Conservation and Recovery Act (tracking hazardous waste)) Business SIC classification: ELECTROPLATING, PLATING, POLISHING, ANODIZING, AND COLORINGOrganizations: OWNERNAME (CONTACT/OWNER)
Alternative names: CONN PRECISION ELECTRO PLATING COMPANY, CT PRECISION ELECTROPLATING INC
EYELET DESIGN INC. (574 E. MAIN STREET in WATERBURY, CT)
AIR MAJOR (AIRS/AFS) CRITERIA AND HAZARDOUS AIR POLLUTANT INVENTORY (Inventory of air pollution sources) HAZARDOUS WASTE BIENNIAL REPORTER (Resource Conservation and Recovery Act (tracking hazardous waste)) Small Quantity Generators, between 100 kg and 1000 kg of hazardous waste/month (Resource Conservation and Recovery Act (tracking hazardous waste)) - notification TRI REPORTER (Tracking of toxic chemicals releasing facilities) Business SIC classification: METAL STAMPINGSBusiness NAICS classification: IRON AND STEEL FORGING.Organizations: OWENS BROCKWAY CLOSURE & SPECIALTY PRODU (CONTACT/OWNER)
Alternative names: OWENS BROCKWAY CLOSURE & SPECIALTY PRODUCTS
GEORGE WILLIAMSON AUTO ELECTRIC INC (32 FREIGHT ST in WATERBURY, CT)
(Integrated Compliance Information System) - ICIS-01-2001-0161, FORMAL ENFORCEMENT ACTION
CORCORANS TRANSPORTATION INC (45 BROWN PL in WATERBURY, CT)
(Resource Conservation and Recovery Act (tracking hazardous waste)) Organizations: EILEEN M CORCORAN (CONTACT/OPERATOR)
, OWNERNAME (CONTACT/OWNER)
A AND A TRUCK BROKERS (130 FREIGHT STREET in WATERBURY, CT)
(Resource Conservation and Recovery Act (tracking hazardous waste)) Organizations: OWNERNAME (CONTACT/OWNER)
ALLOYS INTERNATIONAL (37 JUDD STREET in WATERBURY, CT)
AIR MINOR (AIRS/AFS) COMPLIANCE ACTIVITY (Tracking inspections of insecticide, fungicide, and rodenticide, and toxic substances) Business SIC classification: ELECTROMETALLURGICAL PRODUCTS, EXCEPT STEEL
ANACONDA INDUSTRIES RESEARCH AND TECHNOLOGY CENTER (245 FREIGHT STREET in WATERBURY, CT)
(Resource Conservation and Recovery Act (tracking hazardous waste)) Alternative names: ANACONDA IND RES & TECH C
BERGIN SCHOOL COMPLEX (PIERPONT RD in WATERBURY, CT)
AIR MINOR (AIRS/AFS) CRITERIA AND HAZARDOUS AIR POLLUTANT INVENTORY (Inventory of air pollution sources) Business SIC classification: ELEMENTARY AND SECONDARY SCHOOLS
BRASS CITY TIRE (461 E MAIN ST in WATERBURY, CT)
(Resource Conservation and Recovery Act (tracking hazardous waste)) Organizations: RALPH P GIUSTO (CONTACT/OWNER)
Housing units lacking complete plumbing facilities: 4.9%
Housing units lacking complete kitchen facilities: 12.0%
51.1% Electricity 33.8% Utility gas 10.9% Fuel oil, kerosene, etc. 2.8% Bottled, tank, or LP gas 1.6% No fuel used
Population in 1990: 4,522.
Place of birth for U.S.-born residents:
This state: 1,440Northeast: 407South: 429West: 23
47% of the 06702 zip code residents lived in the same house 5 years ago.
Out of people who lived in different houses, 74% lived in this county.
Out of people who lived in different counties, 50% lived in Connecticut.
83% of the 06702 zip code residents lived in the same house 1 year ago.
Out of people who lived in different houses, 36% moved from this county.
Out of people who lived in different houses, 39% moved from different county within same state.
Out of people who lived in different houses, 15% moved from abroad.
Private vs. public school enrollment:
Students in private schools in grades 1 to 8 (elementary and middle school):
Here:
0.0%Connecticut:
9.5%
Students in private schools in grades 9 to 12 (high school):
Here:
0.0%Connecticut:
12.9%
Students in private undergraduate colleges: 8
Here:
18.7%Connecticut:
35.5%
Occupation by median earnings in the past 12 months ($)
84,667 Community and social service occupations 82,460 Transportation occupations 28,745 Building and grounds cleaning and maintenance occupations 27,021 Healthcare support occupations 20,960 Sales and related occupations 3,002 Food preparation and serving related occupations
Companies with federal contracts located in this zip code (WATERBURY, CT):
TOOLS PLUS, INC (153 MEADOW ST; small business) in 6 contracts from 2004 to 2006
Contracts for Hand Tools, Edged, Nonpowered, Tools and Attachments for Woodworking Machinery, Hand Tools, Nonedged, Nonpowered, Woodworking Machines by Defense Logistics Agency, Navy, ArmySigned by year: 2000: $0; 2001: $0; 2002: $0; 2003: $0; 2004: $13,337; 2005: $0; 2006: $15,672.
Biggest contracts: with Defense Logistics Agency for Hand Tools, Edged, Nonpowered. Signed on 2006-06-19. Completion date: 2006-07-07.
with Navy for Tools and Attachments for Woodworking Machinery. Taking place in CA. Signed on 2004-11-23. Completion date: 2004-12-30.
with Army for Hand Tools, Nonedged, Nonpowered. Signed on 2004-01-30. Completion date: 2004-09-30.
with Army for Woodworking Machines. Signed on 2006-04-21. Completion date: 2006-05-20.
CORE TEC COMMUNICATIONS, LLC (49 LEAVENWORTH STREET; small business)
$10,300 with U.S. Army Corps of Engineers - civil program financing only for Miscellaneous Communication Equipment. Signed on 2002-09-24. Completion date: 2002-10-18.
MAR-C CLEANERS (186 GRAND ST; small business)
$1,624 with Army for Laundry and DryCleaning Services. Signed on 2004-09-01. Completion date: 2004-09-30.
WATERBURY, CITY OF (255 E MAIN ST) in 6 contracts from 2002 to 2006
Contracts for Guard Services, Other Professional Services by U.S. Army Corps of Engineers - civil program financing only, ArmySigned by year: 2000: $0; 2001: $0; 2002: -$1,595; 2003: -$1,284; 2004: $0; 2005: $0; 2006: $741.
Biggest contracts: with U.S. Army Corps of Engineers - civil program financing only for Guard Services. Signed on 2003-04-09. Completion date: 2003-09-30.
with Army for Guard Services. Signed on 2006-06-07. Completion date: 2003-09-30.
with U.S. Army Corps of Engineers - civil program financing only for Other Professional Services. Signed on 2002-12-10. Completion date: 2003-09-30.
with U.S. Army Corps of Engineers - civil program financing only for Guard Services. Signed on 2003-09-19. Completion date: 2003-09-30.
Top industries in this zip code by the number of employees in 2005:
Administrative and Support and Waste Management and Remediation Services: Temporary Help Services (over 1000 employees: 1 establishment, 20-49 employees: 2 establishments)Information: Newspaper Publishers (250-499: 1)Health Care and Social Assistance: Nursing Care Facilities (250-499: 1)Management of Companies and Enterprises: Corporate, Subsidiary, and Regional Managing Offices (250-499: 1)Accommodation and Food Services: Full-Service Restaurants (50-99: 2, 20-49: 3, 10-19: 4, 5-9: 2, 1-4: 7)Accommodation and Food Services: Limited-Service Restaurants (100-249: 1, 20-49: 3, 10-19: 1, 5-9: 2, 1-4: 6)Professional, Scientific, and Technical Services: Offices of Lawyers (50-99: 1, 20-49: 1, 10-19: 2, 5-9: 11, 1-4: 37)Health Care and Social Assistance: Other Individual and Family Services (100-249: 1, 20-49: 1, 10-19: 1)Other Services (except Public Administration): Civic and Social Organizations (100-249: 1, 10-19: 1, 1-4: 1)Health Care and Social Assistance: All Other Outpatient Care Centers (100-249: 1)
People in group quarters in 2010:
206 people in nursing facilities/skilled-nursing facilities
74 people in correctional residential facilities
68 people in residential treatment centers for adults
38 people in other noninstitutional facilities
4 people in group homes for juveniles (non-correctional)
2 people in group homes intended for adults
People in group quarters in 2000:
181 people in nursing homes
59 people in other noninstitutional group quarters
37 people in other types of correctional institutions
26 people in homes or halfway houses for drug/alcohol abuse
7 people in training schools for juvenile delinquents
6 people in religious group quarters
Fatal accident statistics in 2014:
Fatal accident count: 2Vehicles involved in fatal accidents: 3Fatal accidents caused by drunken drivers: 0Fatalities: 2Persons involved in fatal accidents: 3Pedestrians involved in fatal accidents: 1
Fatal accident statistics in 2013:
Fatal accident count: 3Vehicles involved in fatal accidents: 5Fatal accidents caused by drunken drivers: 2Fatalities: 3Persons involved in fatal accidents: 10Pedestrians involved in fatal accidents: 1
Home Mortgage Disclosure Act Aggregated Statistics For Year 2009(Based on 6 partial tracts) A) FHA, FSA/RHS & VA B) Conventional C) Refinancings D) Home Improvement Loans E) Loans on Dwellings For 5+ Families F) Non-occupant Loans on Number Average Value Number Average Value Number Average Value Number Average Value Number Average Value Number Average Value
LOANS ORIGINATED 3 $138,410 2 $88,955 9 $122,690 2 $23,520 3 $699,753 4 $107,590 APPLICATIONS APPROVED, NOT ACCEPTED 0 $0 0 $0 5 $143,376 0 $0 0 $0 2 $91,680 APPLICATIONS DENIED 3 $102,360 0 $0 30 $107,934 6 $20,562 0 $0 7 $71,269 APPLICATIONS WITHDRAWN 2 $80,525 2 $118,515 5 $116,996 1 $115,140 0 $0 2 $80,600 FILES CLOSED FOR INCOMPLETENESS 2 $135,200 2 $207,735 1 $54,620 0 $0 0 $0 0 $0
Aggregated Statistics For Year 2008(Based on 6 partial tracts) A) FHA, FSA/RHS & VA B) Conventional C) Refinancings D) Home Improvement Loans E) Loans on Dwellings For 5+ Families F) Non-occupant Loans on G) Loans On Manufactured Number Average Value Number Average Value Number Average Value Number Average Value Number Average Value Number Average Value Number Average Value
LOANS ORIGINATED 8 $128,725 10 $176,347 19 $134,294 3 $42,447 4 $1,969,302 13 $127,915 0 $0 APPLICATIONS APPROVED, NOT ACCEPTED 0 $0 3 $101,590 4 $144,798 2 $48,690 2 $255,105 3 $122,027 0 $0 APPLICATIONS DENIED 1 $156,110 14 $136,995 51 $138,143 10 $77,167 5 $945,954 22 $131,198 1 $16,450 APPLICATIONS WITHDRAWN 6 $146,612 1 $225,290 11 $160,013 0 $0 1 $225,900 4 $179,295 0 $0 FILES CLOSED FOR INCOMPLETENESS 0 $0 4 $224,035 4 $124,390 0 $0 0 $0 3 $135,963 0 $0
Aggregated Statistics For Year 2007(Based on 6 partial tracts) A) FHA, FSA/RHS & VA B) Conventional C) Refinancings D) Home Improvement Loans E) Loans on Dwellings For 5+ Families F) Non-occupant Loans on Number Average Value Number Average Value Number Average Value Number Average Value Number Average Value Number Average Value
LOANS ORIGINATED 12 $152,477 41 $132,496 43 $140,518 9 $68,676 7 $977,746 45 $141,653 APPLICATIONS APPROVED, NOT ACCEPTED 2 $149,075 12 $135,888 17 $133,019 2 $50,200 2 $2,302,360 15 $101,434 APPLICATIONS DENIED 3 $155,747 41 $130,037 74 $133,774 20 $71,612 8 $208,060 32 $145,753 APPLICATIONS WITHDRAWN 2 $149,075 10 $113,360 24 $170,027 1 $70,690 0 $0 14 $155,239 FILES CLOSED FOR INCOMPLETENESS 1 $237,960 3 $143,767 10 $128,554 2 $169,975 0 $0 4 $106,260
Aggregated Statistics For Year 2006(Based on 6 partial tracts) A) FHA, FSA/RHS & VA B) Conventional C) Refinancings D) Home Improvement Loans E) Loans on Dwellings For 5+ Families F) Non-occupant Loans on G) Loans On Manufactured Number Average Value Number Average Value Number Average Value Number Average Value Number Average Value Number Average Value Number Average Value
LOANS ORIGINATED 6 $127,198 100 $117,304 116 $124,437 11 $52,542 13 $875,441 96 $122,760 0 $0 APPLICATIONS APPROVED, NOT ACCEPTED 0 $0 40 $108,374 28 $122,190 5 $47,344 3 $423,047 28 $131,279 0 $0 APPLICATIONS DENIED 0 $0 53 $116,947 88 $123,224 27 $50,937 0 $0 55 $124,796 2 $79,705 APPLICATIONS WITHDRAWN 0 $0 36 $128,786 62 $116,901 2 $140,595 0 $0 18 $113,010 0 $0 FILES CLOSED FOR INCOMPLETENESS 0 $0 5 $105,404 7 $165,833 0 $0 2 $121,970 2 $144,750 0 $0
Aggregated Statistics For Year 2005(Based on 6 partial tracts) A) FHA, FSA/RHS & VA B) Conventional C) Refinancings D) Home Improvement Loans E) Loans on Dwellings For 5+ Families F) Non-occupant Loans on Number Average Value Number Average Value Number Average Value Number Average Value Number Average Value Number Average Value
LOANS ORIGINATED 7 $138,201 154 $108,050 85 $115,233 10 $56,781 11 $752,928 116 $116,149 APPLICATIONS APPROVED, NOT ACCEPTED 0 $0 32 $117,923 36 $100,134 0 $0 3 $231,187 26 $111,094 APPLICATIONS DENIED 0 $0 79 $101,989 87 $100,791 39 $26,468 5 $154,736 70 $93,239 APPLICATIONS WITHDRAWN 0 $0 29 $117,441 67 $119,546 7 $97,153 3 $3,741,527 20 $111,484 FILES CLOSED FOR INCOMPLETENESS 0 $0 5 $103,932 34 $107,564 1 $8,770 0 $0 8 $93,205
Aggregated Statistics For Year 2004(Based on 6 partial tracts) A) FHA, FSA/RHS & VA B) Conventional C) Refinancings D) Home Improvement Loans E) Loans on Dwellings For 5+ Families F) Non-occupant Loans on G) Loans On Manufactured Number Average Value Number Average Value Number Average Value Number Average Value Number Average Value Number Average Value Number Average Value
LOANS ORIGINATED 8 $91,501 100 $82,790 75 $100,915 17 $76,444 14 $624,789 75 $87,311 0 $0 APPLICATIONS APPROVED, NOT ACCEPTED 3 $117,767 24 $83,116 40 $89,890 3 $47,567 2 $172,195 18 $99,975 0 $0 APPLICATIONS DENIED 0 $0 60 $80,309 102 $100,283 21 $72,953 7 $199,057 43 $98,914 2 $12,755 APPLICATIONS WITHDRAWN 6 $113,867 38 $76,629 59 $107,803 2 $75,710 0 $0 33 $85,221 0 $0 FILES CLOSED FOR INCOMPLETENESS 1 $85,530 4 $77,618 46 $101,245 2 $104,435 0 $0 10 $96,630 0 $0
Aggregated Statistics For Year 2003(Based on 6 partial tracts) A) FHA, FSA/RHS & VA B) Conventional C) Refinancings D) Home Improvement Loans E) Loans on Dwellings For 5+ Families F) Non-occupant Loans on Number Average Value Number Average Value Number Average Value Number Average Value Number Average Value Number Average Value
LOANS ORIGINATED 5 $95,572 58 $76,395 73 $81,417 4 $75,675 2 $558,040 54 $78,136 APPLICATIONS APPROVED, NOT ACCEPTED 0 $0 18 $73,269 20 $90,748 2 $94,820 0 $0 12 $76,042 APPLICATIONS DENIED 3 $81,553 39 $75,206 113 $95,397 10 $20,198 2 $151,720 32 $74,223 APPLICATIONS WITHDRAWN 0 $0 17 $96,861 55 $91,378 2 $29,060 0 $0 8 $69,154 FILES CLOSED FOR INCOMPLETENESS 1 $71,280 1 $63,600 3 $82,153 2 $19,930 0 $0 1 $98,690
Aggregated Statistics For Year 2002(Based on 6 partial tracts) A) FHA, FSA/RHS & VA B) Conventional C) Refinancings D) Home Improvement Loans E) Loans on Dwellings For 5+ Families F) Non-occupant Loans on Number Average Value Number Average Value Number Average Value Number Average Value Number Average Value Number Average Value
LOANS ORIGINATED 20 $90,749 34 $57,396 50 $114,052 9 $37,970 2 $224,015 31 $131,495 APPLICATIONS APPROVED, NOT ACCEPTED 2 $70,950 13 $69,796 18 $74,593 5 $6,616 0 $0 10 $65,389 APPLICATIONS DENIED 2 $90,660 23 $68,062 62 $69,666 15 $7,885 2 $125,960 17 $57,808 APPLICATIONS WITHDRAWN 2 $74,890 7 $78,729 37 $85,287 2 $65,795 0 $0 7 $80,797 FILES CLOSED FOR INCOMPLETENESS 0 $0 13 $62,093 29 $108,659 0 $0 0 $0 1 $51,540
Aggregated Statistics For Year 2001(Based on 6 partial tracts) A) FHA, FSA/RHS & VA B) Conventional C) Refinancings D) Home Improvement Loans E) Loans on Dwellings For 5+ Families F) Non-occupant Loans on Number Average Value Number Average Value Number Average Value Number Average Value Number Average Value Number Average Value
LOANS ORIGINATED 36 $91,088 22 $82,447 37 $79,216 10 $26,073 0 $0 17 $65,549 APPLICATIONS APPROVED, NOT ACCEPTED 5 $69,196 8 $77,001 17 $84,026 6 $19,980 3 $371,573 11 $80,909 APPLICATIONS DENIED 2 $66,205 20 $80,696 75 $65,320 24 $13,107 2 $137,915 9 $58,897 APPLICATIONS WITHDRAWN 5 $89,286 5 $48,300 30 $66,185 10 $25,501 0 $0 5 $54,502 FILES CLOSED FOR INCOMPLETENESS 1 $91,020 0 $0 6 $79,283 1 $2,190 0 $0 0 $0
Aggregated Statistics For Year 2000(Based on 6 partial tracts) A) FHA, FSA/RHS & VA B) Conventional C) Refinancings D) Home Improvement Loans E) Loans on Dwellings For 5+ Families F) Non-occupant Loans on Number Average Value Number Average Value Number Average Value Number Average Value Number Average Value Number Average Value
LOANS ORIGINATED 27 $80,575 36 $56,003 17 $70,137 7 $19,519 0 $0 16 $61,883 APPLICATIONS APPROVED, NOT ACCEPTED 4 $77,870 9 $73,389 11 $83,610 8 $29,842 0 $0 14 $76,121 APPLICATIONS DENIED 5 $99,048 28 $60,618 75 $57,156 41 $21,703 3 $91,853 16 $64,464 APPLICATIONS WITHDRAWN 6 $73,828 10 $72,946 20 $59,574 6 $16,145 0 $0 6 $48,617 FILES CLOSED FOR INCOMPLETENESS 0 $0 2 $32,950 17 $76,255 0 $0 0 $0 3 $46,980
Aggregated Statistics For Year 1999(Based on 3 partial tracts) A) FHA, FSA/RHS & VA B) Conventional C) Refinancings D) Home Improvement Loans F) Non-occupant Loans on Number Average Value Number Average Value Number Average Value Number Average Value Number Average Value
LOANS ORIGINATED 12 $77,417 11 $65,140 20 $56,751 4 $35,225 8 $64,493 APPLICATIONS APPROVED, NOT ACCEPTED 0 $0 6 $75,175 5 $49,166 2 $19,205 1 $47,430 APPLICATIONS DENIED 5 $63,140 10 $97,932 24 $64,465 18 $19,132 5 $49,128 APPLICATIONS WITHDRAWN 3 $79,327 4 $43,230 12 $118,199 2 $43,335 3 $52,990 FILES CLOSED FOR INCOMPLETENESS 1 $32,730 2 $35,870 7 $89,394 0 $0 3 $72,567
Detailed HMDA statistics for the following Tracts:
3501.00
,
3504.00 ,
3523.00
Private Mortgage Insurance Companies Aggregated Statistics For Year 2008(Based on 6 partial tracts) A) Conventional B) Refinancings C) Non-occupant Loans on Number Average Value Number Average Value Number Average Value
LOANS ORIGINATED 1 $134,300 2 $126,240 2 $118,495 APPLICATIONS APPROVED, NOT ACCEPTED 2 $81,290 2 $104,435 2 $113,195 APPLICATIONS DENIED 0 $0 0 $0 0 $0 APPLICATIONS WITHDRAWN 1 $246,740 0 $0 0 $0 FILES CLOSED FOR INCOMPLETENESS 0 $0 0 $0 0 $0
Aggregated Statistics For Year 2007(Based on 6 partial tracts) A) Conventional B) Refinancings C) Non-occupant Loans on Number Average Value Number Average Value Number Average Value
LOANS ORIGINATED 15 $164,913 1 $229,680 11 $187,925 APPLICATIONS APPROVED, NOT ACCEPTED 5 $147,602 1 $199,870 3 $184,593 APPLICATIONS DENIED 2 $145,135 0 $0 1 $222,610 APPLICATIONS WITHDRAWN 0 $0 0 $0 0 $0 FILES CLOSED FOR INCOMPLETENESS 1 $232,480 0 $0 1 $232,480
Aggregated Statistics For Year 2006(Based on 6 partial tracts) A) Conventional C) Non-occupant Loans on Number Average Value Number Average Value
LOANS ORIGINATED 8 $94,164 6 $102,608 APPLICATIONS APPROVED, NOT ACCEPTED 4 $146,452 3 $116,013 APPLICATIONS DENIED 1 $165,590 1 $165,590 APPLICATIONS WITHDRAWN 0 $0 0 $0 FILES CLOSED FOR INCOMPLETENESS 0 $0 0 $0
Aggregated Statistics For Year 2005(Based on 6 partial tracts) A) Conventional B) Refinancings C) Non-occupant Loans on Number Average Value Number Average Value Number Average Value
LOANS ORIGINATED 9 $149,903 4 $132,402 8 $141,290 APPLICATIONS APPROVED, NOT ACCEPTED 5 $113,170 0 $0 3 $113,680 APPLICATIONS DENIED 0 $0 0 $0 0 $0 APPLICATIONS WITHDRAWN 0 $0 0 $0 0 $0 FILES CLOSED FOR INCOMPLETENESS 0 $0 0 $0 0 $0
Aggregated Statistics For Year 2004(Based on 6 partial tracts) A) Conventional B) Refinancings C) Non-occupant Loans on Number Average Value Number Average Value Number Average Value
LOANS ORIGINATED 12 $94,852 4 $112,505 6 $96,327 APPLICATIONS APPROVED, NOT ACCEPTED 7 $123,353 0 $0 5 $99,502 APPLICATIONS DENIED 2 $136,525 0 $0 2 $136,525 APPLICATIONS WITHDRAWN 1 $123,920 0 $0 1 $123,920 FILES CLOSED FOR INCOMPLETENESS 0 $0 0 $0 0 $0
Aggregated Statistics For Year 2003(Based on 6 partial tracts) A) Conventional B) Refinancings C) Non-occupant Loans on Number Average Value Number Average Value Number Average Value
LOANS ORIGINATED 14 $82,667 1 $63,990 9 $88,499 APPLICATIONS APPROVED, NOT ACCEPTED 2 $100,100 0 $0 2 $93,270 APPLICATIONS DENIED 0 $0 0 $0 0 $0 APPLICATIONS WITHDRAWN 1 $57,020 0 $0 1 $57,020 FILES CLOSED FOR INCOMPLETENESS 0 $0 0 $0 0 $0
Aggregated Statistics For Year 2002(Based on 6 partial tracts) A) Conventional B) Refinancings C) Non-occupant Loans on Number Average Value Number Average Value Number Average Value
LOANS ORIGINATED 10 $75,057 0 $0 4 $71,305 APPLICATIONS APPROVED, NOT ACCEPTED 7 $105,170 1 $120,680 0 $0 APPLICATIONS DENIED 2 $71,750 0 $0 2 $71,750 APPLICATIONS WITHDRAWN 2 $119,580 2 $65,450 0 $0 FILES CLOSED FOR INCOMPLETENESS 0 $0 0 $0 0 $0
Aggregated Statistics For Year 2001(Based on 6 partial tracts) A) Conventional B) Refinancings C) Non-occupant Loans on Number Average Value Number Average Value Number Average Value
LOANS ORIGINATED 10 $106,161 3 $163,577 3 $80,410 APPLICATIONS APPROVED, NOT ACCEPTED 0 $0 1 $117,340 0 $0 APPLICATIONS DENIED 0 $0 0 $0 0 $0 APPLICATIONS WITHDRAWN 0 $0 0 $0 0 $0 FILES CLOSED FOR INCOMPLETENESS 0 $0 0 $0 0 $0
Aggregated Statistics For Year 2000(Based on 6 partial tracts) A) Conventional B) Refinancings C) Non-occupant Loans on Number Average Value Number Average Value Number Average Value
LOANS ORIGINATED 7 $48,970 1 $53,730 3 $44,230 APPLICATIONS APPROVED, NOT ACCEPTED 0 $0 0 $0 0 $0 APPLICATIONS DENIED 0 $0 0 $0 0 $0 APPLICATIONS WITHDRAWN 0 $0 0 $0 0 $0 FILES CLOSED FOR INCOMPLETENESS 0 $0 0 $0 0 $0
Aggregated Statistics For Year 1999(Based on 3 partial tracts) A) Conventional B) Refinancings C) Non-occupant Loans on Number Average Value Number Average Value Number Average Value
LOANS ORIGINATED 3 $60,493 2 $77,880 3 $57,680 APPLICATIONS APPROVED, NOT ACCEPTED 0 $0 0 $0 0 $0 APPLICATIONS DENIED 0 $0 0 $0 0 $0 APPLICATIONS WITHDRAWN 0 $0 0 $0 0 $0 FILES CLOSED FOR INCOMPLETENESS 0 $0 0 $0 0 $0
Detailed PMIC statistics for the following Tracts:
3501.00
,
3504.00 ,
3523.00
2002 - 2018 National Fire Incident Reporting System (NFIRS) incidents See full 2006 National Fire Incident Reporting System statistics for zip code 06702, Connecticut
Most common first names in zip code 06702 among deceased individuals Name Count Lived (average)
Mary 158 81.1 years John 93 72.8 years Joseph 75 74.3 years William 66 74.4 years Helen 64 79.5 years James 63 69.5 years Anna 51 83.7 years Margaret 51 79.4 years George 43 75.1 years Elizabeth 38 82.4 years
Most common last names in zip code 06702 among deceased individuals Last name Count Lived (average)
Smith 20 73.9 years Brown 16 72.8 years Sullivan 16 78.8 years Murphy 15 74.5 years Williams 14 77.2 years Jones 11 78.0 years Kelly 11 68.1 years Anderson 11 76.4 years Mcdonald 10 74.0 years Clark 10 77.5 years
Businesses in zip code 06702
Name Count Name Count
7-Eleven 1 KFC 1 Advance Auto Parts 1 Macy's 1 American Eagle Outfitters 1 Marriott 1 Ashley Furniture 1 MasterBrand Cabinets 2 AutoZone 1 Motherhood Maternity 1 Burger King 1 Penske 1 ColorTyme 1 Spencer Gifts 1 DHL 1 Subway 2 Decora Cabinetry 2 U-Haul 1 Dunkin Donuts 2 UPS 3 FedEx 3 Walgreens 2 Finish Line 1 Wendy's 1 H&R Block 1 YMCA 1 Hot Topic 1
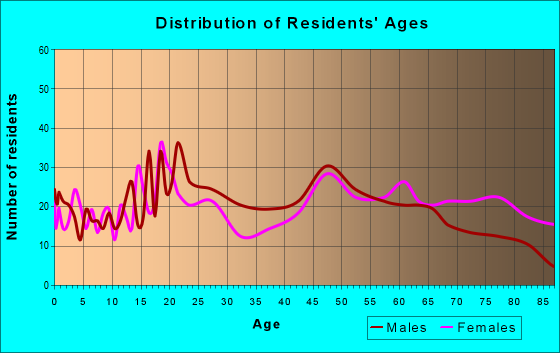


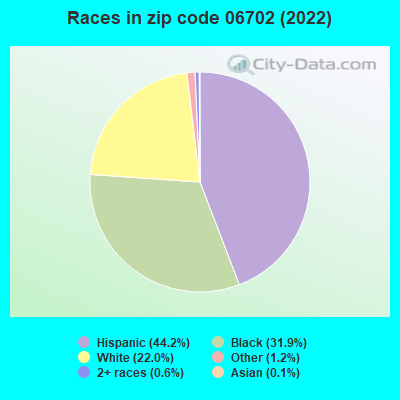


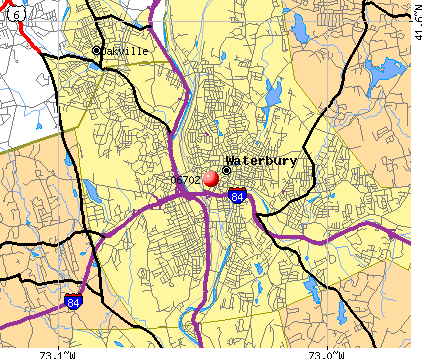 Nearest zip codes: 06710, 06708, 06706, 06704, 06779, 06705.
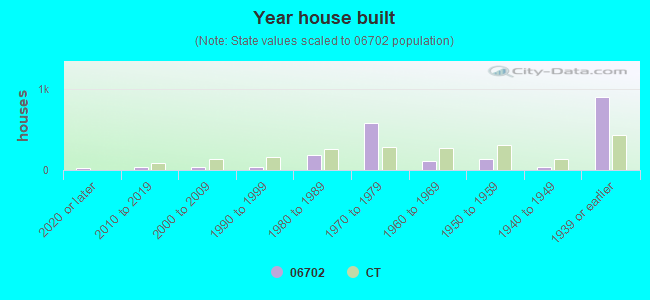

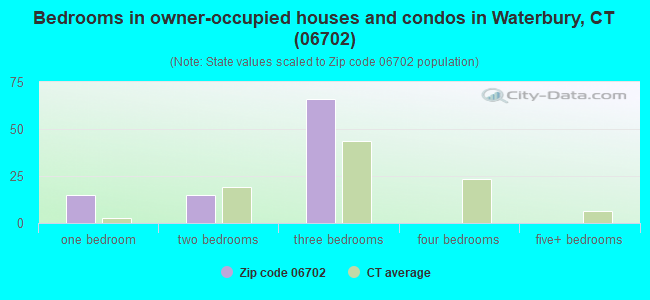
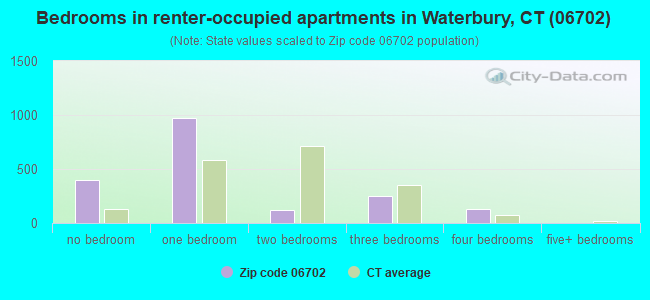
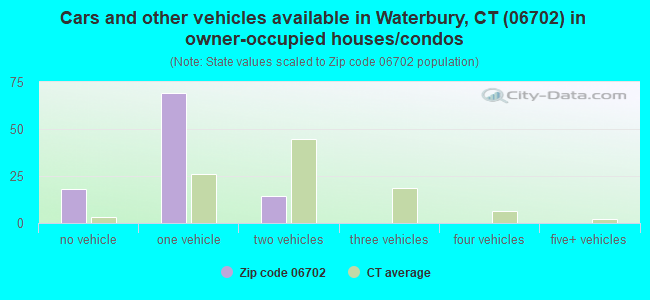
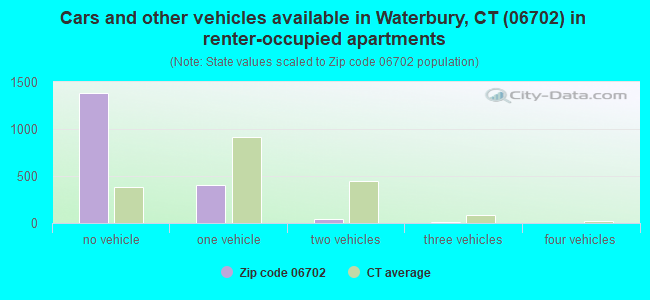


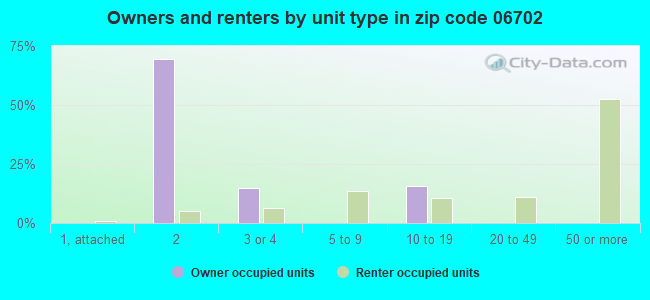


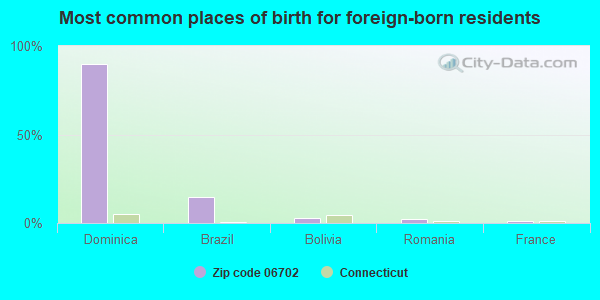
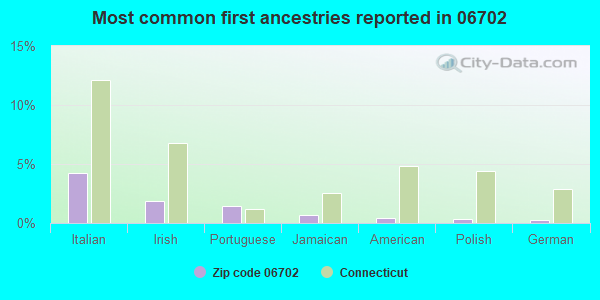
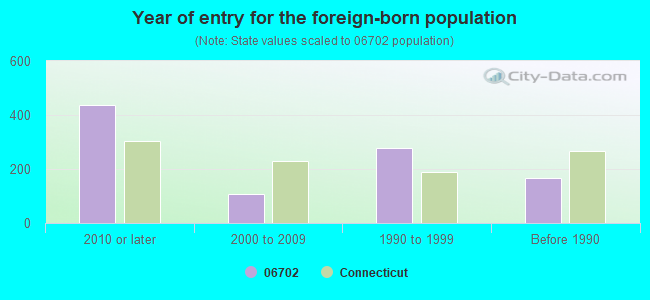


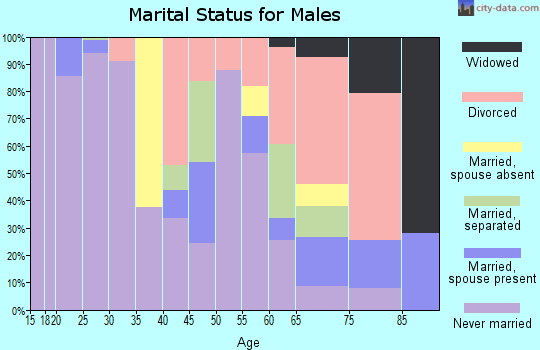
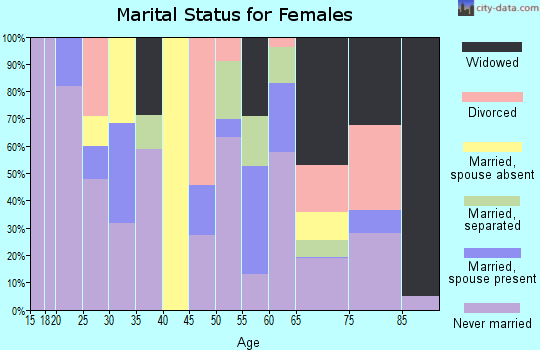
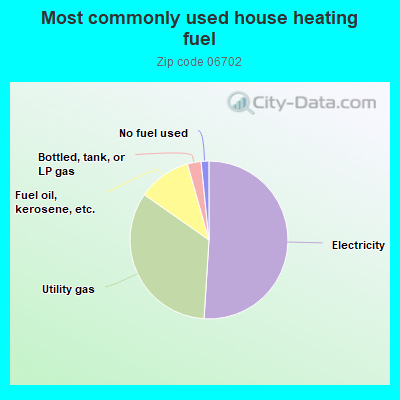
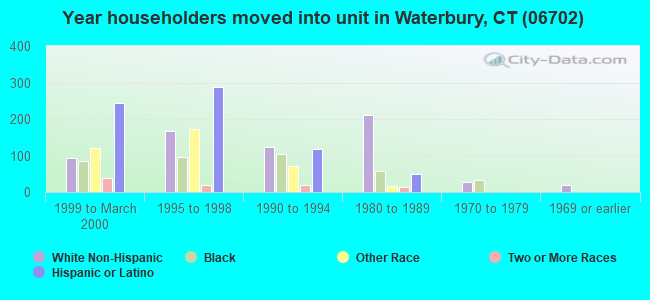
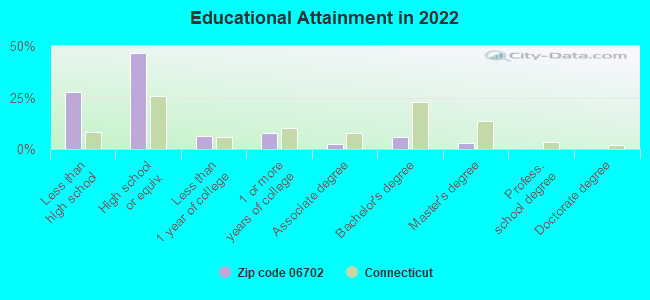
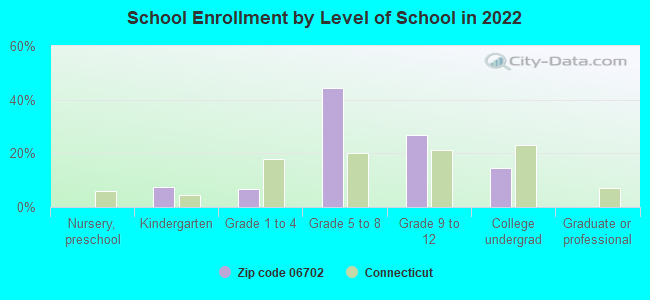
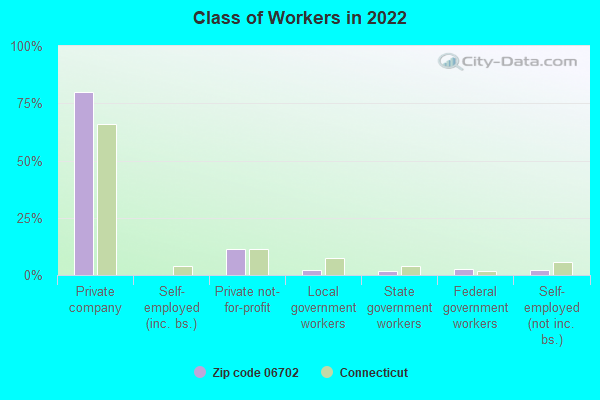
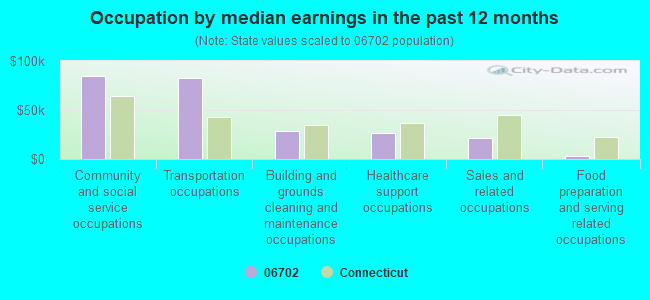
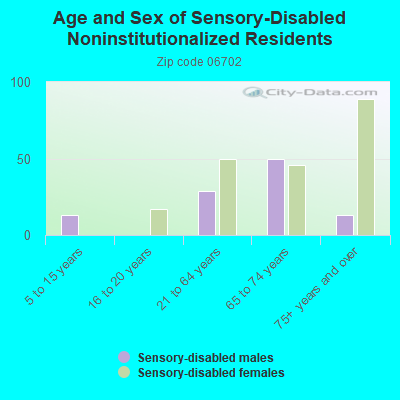
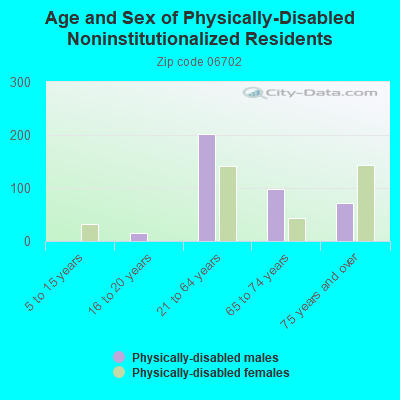
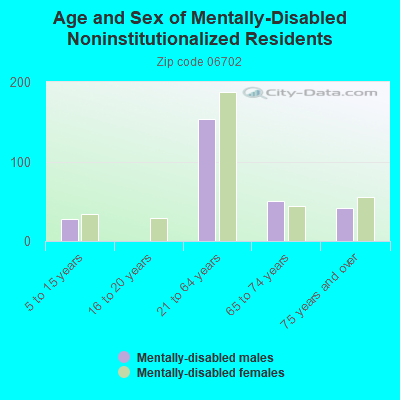
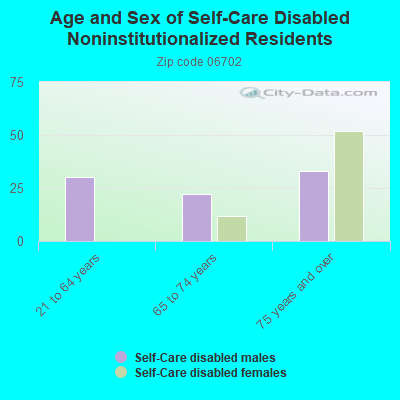
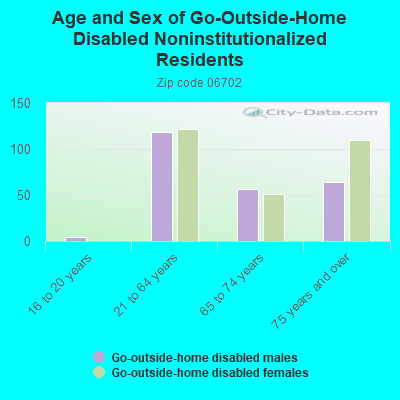
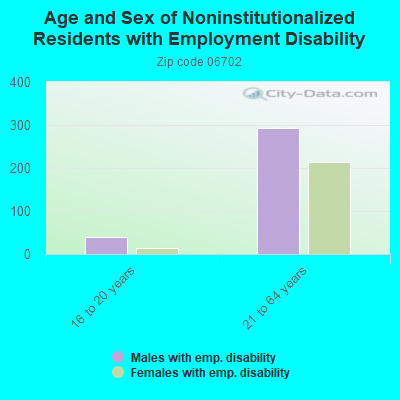
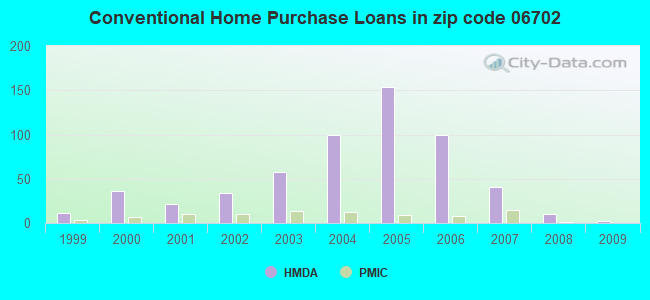
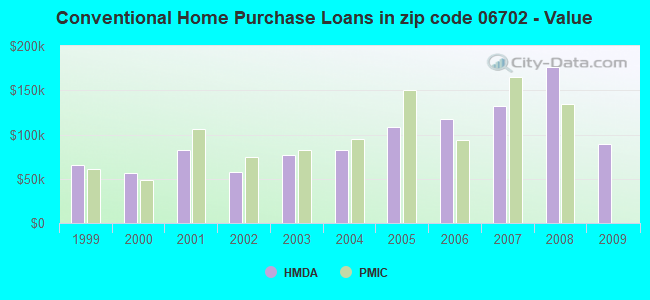
 According to the data from the years 2002 - 2018 the average number of fires per year is 62. The highest number of fires - 142 took place in 2007, and the least - 7 in 2011. The data has a dropping trend.
 When looking into fire subcategories, the most reports belonged to: Structure Fires (56.8%), and Outside Fires (25.3%).