Estimated zip code population in 2022: 3,060 Zip code population in 2010: 3,606 Zip code population in 2000: 3,411
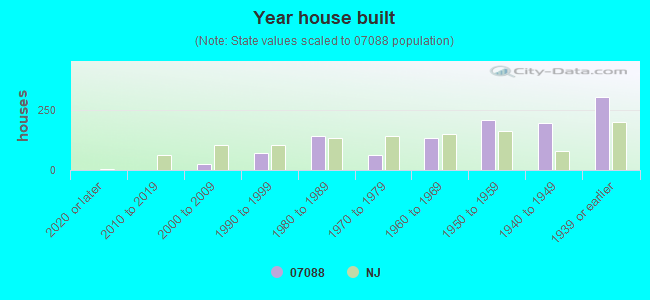
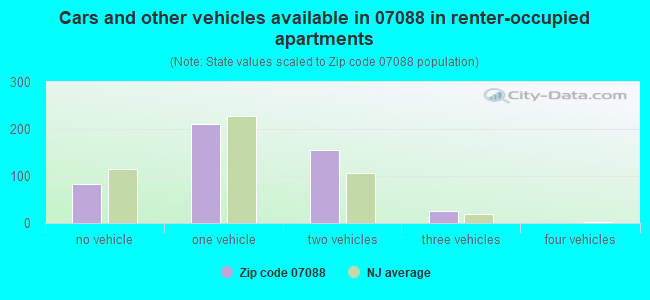
Houses and condos: 1,179 Renter-occupied apartments: 472
% of renters here:
40%
State:
35%
March 2022 cost of living index in zip code 07088: 113.6 (more than average, U.S. average is 100)
Land area: 0.4 sq. mi. Water area: 0.0 sq. mi.
Population density: 7,199 people per square mile
(high).
OSM Map
Google Map
MSN Map
OSM Map
General Map
Google Map
MSN Map
OSM Map
Google Map
MSN Map
OSM Map
Google Map
MSN Map
Please wait while loading the map...
Real estate property taxes paid for housing units in 2022:
This zip code:
1.8% ($6,253)
New Jersey:
2.1% ($8,897)
Median real estate property taxes paid for housing units with mortgages in 2022: $5,965 (1.6%) Median real estate property taxes paid for housing units with no mortgage in 2022: $7,298 (2.2%)
Business Search- 14 Million verified businesses
Males: 1,508
(49.3%)
Females: 1,551
(50.7%)
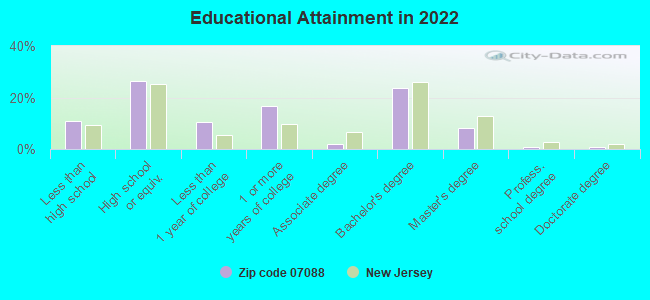
For population 25 years and over in 07088:
High school or higher: 88.1%
Bachelor's degree or higher: 33.4%
Graduate or professional degree: 10.0%
Unemployed: 5.6%
Mean travel time to work (commute): 30.5 minutes
For population 15 years and over in 07088:
Never married: 46.0%
Now married: 35.9%
Separated: 1.9%
Widowed: 8.6%
Divorced: 7.6%
Zip code 07088 compared to state average:
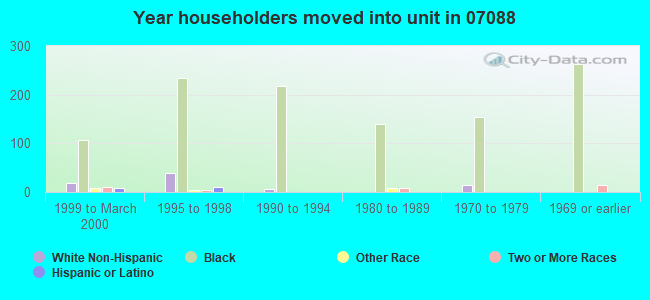
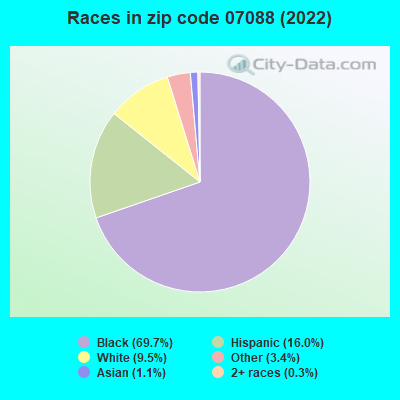
Black race population percentage significantly above state average.
Length of stay since moving in significantly above state average.
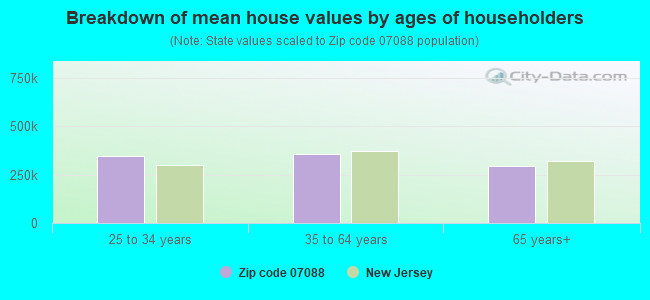
Estimated median house/condo value in 2022: $356,455
07088:
$356,455
New Jersey:
$428,900
According to our research of New Jersey and other state lists, there were 3 registered sex offenders living in 07088 zip code as of April 24, 2024. The ratio of all residents to sex offenders in zip code 07088 is 1,163 to 1.
Median resident age:
This zip code:
42.4 years
New Jersey median age:
40.4 years
Average household size:
This zip code:
2.6 people
New Jersey:
2.6 people
Averages for the 2020 tax year for zip code 07088, filed in 2021:
Average Adjusted Gross Income (AGI) in 2020: $52,120 (Individual Income Tax Returns)
Here:
$52,120
State:
$95,247
Salary/wage: $49,326 (reported on 84.7% of returns)
Here:
$49,326
State:
$80,635
(% of AGI for various income ranges: 1190.2% for AGIs below $25k, 3791.6% for AGIs $25k-50k, 7267.6% for AGIs $50k-75k, 10206.4% for AGIs $75k-100k, 16233.6% for AGIs $100k-200k)
Taxable interest for individuals: $293 (reported on 15.3% of returns)
This zip code:
$293
New Jersey:
$2,414
(% of AGI for various income ranges: 1.8% for AGIs below $25k, 3.0% for AGIs $25k-50k, 4.4% for AGIs $50k-75k, 12.7% for AGIs $75k-100k, 27.9% for AGIs $100k-200k)
Ordinary dividends: $1,481 (reported on 8.4% of returns)
Here:
$1,481
State:
$8,057
(% of AGI for various income ranges: 3.1% for AGIs below $25k, 0.7% for AGIs $25k-50k, 19.6% for AGIs $50k-75k, 13.6% for AGIs $75k-100k, 111.4% for AGIs $100k-200k)
Net capital gain/loss in AGI: +$4,693 (reported on 7.9% of returns)
Here:
+$4,693
State:
+$25,022
(% of AGI for various income ranges: 2.4% for AGIs below $25k, 3.4% for AGIs $25k-50k, 45.2% for AGIs $50k-75k, 403.6% for AGIs $100k-200k)
Profit/loss from business: +$3,603 (reported on 16.8% of returns)
Here:
+$3,603
State:
+$18,035
(% of AGI for various income ranges: 109.8% for AGIs below $25k, 35.2% for AGIs $25k-50k, 8.4% for AGIs $50k-75k, 374.3% for AGIs $100k-200k)
Taxable individual retirement arrangement distribution: $11,000 (reported on 3.7% of returns)
07088:
$11,000
New Jersey:
$21,558
(% of AGI for various income ranges: 91.1% for AGIs $25k-50k, 335.5% for AGIs $75k-100k)
Total itemized deductions: $24,904 (reported on 13.2% of returns)
Here:
$24,904
State:
$32,863
(% of AGI for various income ranges: 263.0% for AGIs $25k-50k, 517.6% for AGIs $50k-75k, 963.6% for AGIs $75k-100k, 1939.3% for AGIs $100k-200k)
Charity contributions: $7,183 (reported on 9.5% of returns)
Here:
$7,183
State:
$7,880
(% of AGI for various income ranges: 49.5% for AGIs $25k-50k, 81.6% for AGIs $50k-75k, 180.0% for AGIs $75k-100k, 480.7% for AGIs $100k-200k)
Taxes paid: $8,344 (reported on 13.2% of returns)
07088:
$8,344
State:
$9,183
(% of AGI for various income ranges: 80.2% for AGIs $25k-50k, 196.4% for AGIs $50k-75k, 339.1% for AGIs $75k-100k, 620.7% for AGIs $100k-200k)
Earned income credit: $2,311 (reported on 18.4% of returns)
Here:
$2,311
State:
$2,148
(% of AGI for various income ranges: 112.4% for AGIs below $25k, 68.9% for AGIs $25k-50k)
Percentage of individuals using paid preparers for their 2020 taxes: 88.4%
Here:
88%
State:
92%
(% for various income ranges: 85.7% for AGIs below $25k, 89.1% for AGIs $25k-50k, 88.2% for AGIs $50k-75k, 93.8% for AGIs $75k-100k, 90.0% for AGIs $100k-200k, 100.0% for AGIs over 200k)
Averages for the 2012 tax year for zip code 07088, filed in 2013:
Average Adjusted Gross Income (AGI) in 2012: $43,969 (Individual Income Tax Returns)
Here:
$43,969
State:
$79,688
Salary/wage: $41,488 (reported on 86.1% of returns)
Here:
$41,488
State:
$68,122
(% of AGI for various income ranges: 71.9% for AGIs below $25k, 83.7% for AGIs $25k-50k, 86.1% for AGIs $50k-75k, 78.9% for AGIs $75k-100k, 79.6% for AGIs $100k-200k)
Taxable interest for individuals: $277 (reported on 18.7% of returns)
This zip code:
$277
New Jersey:
$2,193
(% of AGI for various income ranges: 0.2% for AGIs below $25k, 0.1% for AGIs $50k-75k, 0.1% for AGIs $75k-100k, 0.1% for AGIs $100k-200k)
Ordinary dividends: $587 (reported on 9.0% of returns)
Here:
$587
State:
$6,828
(% of AGI for various income ranges: 0.2% for AGIs below $25k, 0.1% for AGIs $50k-75k, 0.1% for AGIs $75k-100k, 0.1% for AGIs $100k-200k)
Profit/loss from business: +$4,435 (reported on 12.0% of returns)
Here:
+$4,435
State:
+$19,577
(% of AGI for various income ranges: 6.0% for AGIs below $25k, 0.6% for AGIs $25k-50k, 1.2% for AGIs $50k-75k, 1.0% for AGIs $75k-100k)
Taxable individual retirement arrangement distribution: $9,611 (reported on 5.4% of returns)
07088:
$9,611
New Jersey:
$18,214
(% of AGI for various income ranges: 1.8% for AGIs below $25k, 1.8% for AGIs $25k-50k, 3.5% for AGIs $75k-100k)
Total itemized deductions: $20,786 (30% of AGI, reported on 35.5% of returns)
Here:
$20,786
State:
$30,827
Here:
30.1% of AGI
State:
21.2% of AGI
(% of AGI for various income ranges: 14.6% for AGIs below $25k, 13.1% for AGIs $25k-50k, 19.3% for AGIs $50k-75k, 20.0% for AGIs $75k-100k, 17.5% for AGIs $100k-200k)
Charity contributions: $3,824 (reported on 30.7% of returns)
Here:
$3,824
State:
$3,451
(% of AGI for various income ranges: 1.8% for AGIs below $25k, 2.0% for AGIs $25k-50k, 2.9% for AGIs $50k-75k, 3.7% for AGIs $75k-100k, 2.9% for AGIs $100k-200k)
Taxes paid: $7,193 (reported on 35.5% of returns)
07088:
$7,193
State:
$15,801
(% of AGI for various income ranges: 5.1% for AGIs below $25k, 3.7% for AGIs $25k-50k, 6.5% for AGIs $50k-75k, 6.8% for AGIs $75k-100k, 7.1% for AGIs $100k-200k)
Earned income credit: $2,066 (reported on 22.9% of returns)
Here:
$2,066
State:
$2,182
(% of AGI for various income ranges: 7.7% for AGIs below $25k, 1.0% for AGIs $25k-50k)
Percentage of individuals using paid preparers for their 2012 taxes: 63.3%
Here:
63%
State:
65%
(% for various income ranges: 60.0% for AGIs below $25k, 65.4% for AGIs $25k-50k, 64.3% for AGIs $50k-75k, 61.5% for AGIs $75k-100k, 69.2% for AGIs $100k-200k)
Averages for the 2004 tax year for zip code 07088, filed in 2005:
Average Adjusted Gross Income (AGI) in 2004: $38,104 (Individual Income Tax Returns)
Here:
$38,104
State:
$64,921
Salary/wage: $37,367 (reported on 89.1% of returns)
Here:
$37,367
State:
$57,755
(% of AGI for various income ranges: 83.2% for AGIs below $10k, 77.3% for AGIs $10k-25k, 91.3% for AGIs $25k-50k, 90.1% for AGIs $50k-75k, 91.0% for AGIs $75k-100k, 80.8% for AGIs over 100k)
Taxable interest for individuals: $451 (reported on 31.1% of returns)
This zip code:
$451
New Jersey:
$2,068
(% of AGI for various income ranges: 2.1% for AGIs below $10k, 0.6% for AGIs $10k-25k, 0.2% for AGIs $25k-50k, 0.4% for AGIs $50k-75k, 0.2% for AGIs $75k-100k, 0.4% for AGIs over 100k)
Taxable dividends: $348 (reported on 13.0% of returns)
Here:
$348
State:
$3,959
(% of AGI for various income ranges: 0.5% for AGIs below $10k, 0.3% for AGIs $10k-25k, 0.1% for AGIs $25k-50k, 0.1% for AGIs $50k-75k, 0.0% for AGIs $75k-100k, 0.1% for AGIs over 100k)
Net capital gain/loss: +$2,198 (reported on 6.8% of returns)
Here:
+$2,198
State:
+$13,591
(% of AGI for various income ranges: -0.1% for AGIs $10k-25k, -0.1% for AGIs $25k-50k, 0.1% for AGIs $50k-75k, 2.3% for AGIs over 100k)
Profit/loss from business: +$2,746 (reported on 8.9% of returns)
Here:
+$2,746
State:
+$17,520
(% of AGI for various income ranges: 1.2% for AGIs below $10k, 4.5% for AGIs $10k-25k, -0.1% for AGIs $25k-50k, -0.4% for AGIs $50k-75k, 0.5% for AGIs $75k-100k, 0.7% for AGIs over 100k)
IRA payment deduction: $1,133 (reported on 1.1% of returns)
07088:
$1,133
New Jersey:
$3,270
Total itemized deductions: $16,332 (29% of AGI, reported on 39.9% of returns)
Here:
$16,332
State:
$23,924
Here:
28.9% of AGI
State:
21.1% of AGI
(% of AGI for various income ranges: 13.2% for AGIs below $10k, 14.0% for AGIs $10k-25k, 16.1% for AGIs $25k-50k, 20.4% for AGIs $50k-75k, 19.4% for AGIs $75k-100k, 15.2% for AGIs over 100k)
Charity contributions deductions: $3,609 (6% of AGI, reported on 36.9% of returns)
Here:
$3,609
State:
$3,242
Here:
6.2% of AGI
State:
2.7% of AGI
(% of AGI for various income ranges: 1.2% for AGIs below $10k, 2.1% for AGIs $10k-25k, 3.5% for AGIs $25k-50k, 4.4% for AGIs $50k-75k, 4.3% for AGIs $75k-100k, 2.7% for AGIs over 100k)
Total tax: $4,661 (reported on 70.6% of returns)
07088:
$4,661
State:
$12,321
(% of AGI for various income ranges: 2.1% for AGIs below $10k, 3.1% for AGIs $10k-25k, 5.7% for AGIs $25k-50k, 9.7% for AGIs $50k-75k, 10.2% for AGIs $75k-100k, 15.7% for AGIs over 100k)
Earned income credit: $1,590 (reported on 20.4% of returns)
Here:
$1,590
State:
$1,711
Percentage of individuals using paid preparers for their 2004 taxes: 68.2%
Here:
68%
State:
65%
(% for various income ranges: 62.4% for AGIs below $10k, 68.7% for AGIs $10k-25k, 70.7% for AGIs $25k-50k, 66.0% for AGIs $50k-75k, 75.3% for AGIs $75k-100k, 63.8% for AGIs over 100k)
Household received Food Stamps/SNAP in the past 12 months: 123 Household did not receive Food Stamps/SNAP in the past 12 months: 1,049
Women who had a birth in the past 12 months: 47 (7 now married, 38 unmarried) Women who did not have a birth in the past 12 months: 667 (190 now married, 478 unmarried)
Housing units in zip code 07088 with a mortgage: 475 (33 second mortgage, 34 both second mortgage and home equity loan) Median monthly owner costs for units with a mortgage: $2,347 Median monthly owner costs for units without a mortgage: $962
Residents with income below the poverty level in 2022:
This zip code:
7.9%
Whole state:
9.7%
Residents with income below 50% of the poverty level in 2022:
This zip code:
5.0%
Whole state:
5.2%
Median number of rooms in houses and condos:
Here:
5.9
State:
6.8
Median number of rooms in apartments:
Here:
4.5
State:
3.9
Notable locations in this zip code not listed on our city pages
Size of family households: 235 2-persons, 184 3-persons, 114 4-persons, 34 5-persons, 125 6-persons
Size of nonfamily households: 434 1-person, 9 2-persons, 19 4-persons
241 married couples with children.
214 single-parent households (214 women).
76.5% of residents of 07088 zip code speak English at home.
15.9% of residents speak Spanish at home (43% very well, 21% well, 17% not well, 19% not at all).
6.0% of residents speak other Indo-European language at home (67% very well, 20% well, 14% not well).
1.6% of residents speak other language at home (100% very well).
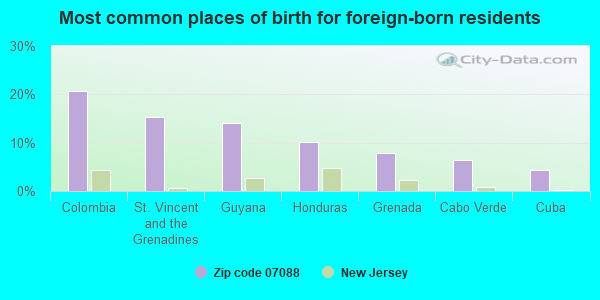
Foreign born population: 540 (17.6%) (42.9% of them are naturalized citizens)
This zip code:
17.6%
Whole state:
23.5%
21%Colombia
15%St. Vincent and the Grenadines
14%Guyana
10%Honduras
8%Grenada
6%Cabo Verde
4%Cuba
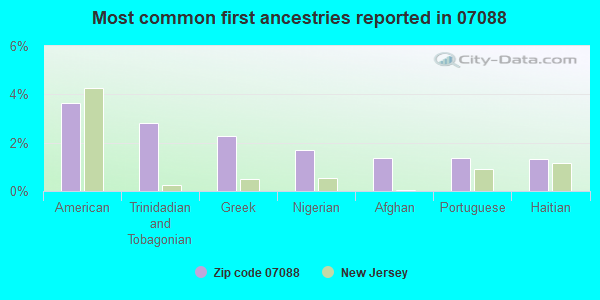
4%American
3%Trinidadian and Tobagonian
2%Greek
2%Nigerian
1%Afghan
1%Portuguese
1%Haitian
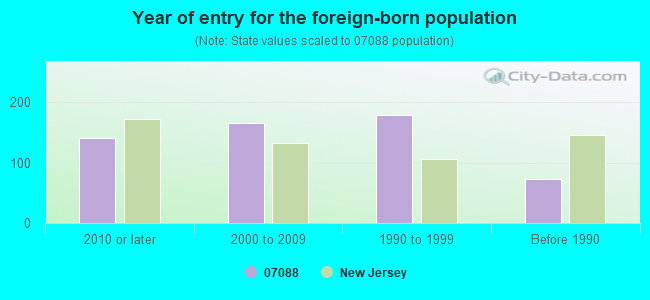
Year of entry for the foreign-born population
1412010 or later
1652000 to 2009
1791990 to 1999
73Before 1990
Facilities with environmental interests located in this zip code:
OZZIES CUSTOM CLEANERS (2929 VAUXHALL ROAD in VAUXHALL, NJ)
STATE MASTER (New Jersey environmental info) - NJEMS-72996100000, EPCRA, NJEMS-L4098, AIR PROGRAM, NJEMS-NJR000032359, HAZARDOUS WASTE PROGRAM HAZARDOUS WASTE BIENNIAL REPORTER (Resource Conservation and Recovery Act (tracking hazardous waste)) Large Quantity Generators, more that 1000 kg of hazardous waste/month (Resource Conservation and Recovery Act (tracking hazardous waste)) - notification Business SIC classification: DRYCLEANING PLANTS, EXCEPT RUG CLEANING Organizations: OZZIES CUSTOM DRY CLEANERS INC, OZZIES DAY CLEANERS C/O SAUL CANTOR, SAUL CANTOR (CONTACT/OWNER)
Alternative names: OZZIES CUSTOM DRY CLEANERS, OZZIES DRY CLEANERS
EXXON SERVICE STATION #32181 (2201 SPRINGFIELD AVE in VAUXHALL, NJ)
STATE MASTER (New Jersey environmental info) - NJEMS-73833800000, EPCRA, NJEMS-A4012, AIR PROGRAM, NJEMS-007491, STATE CLEANUP SITE, NJEMS-41542, AIR PROGRAM (Resource Conservation and Recovery Act (tracking hazardous waste)) Business SIC classification: GASOLINE SERVICE STATIONS Organizations: EXXON MOBIL CORP, EXXON MOBIL FUELS MARKETING CO (CONTACT/OWNER)
Alternative names: EXXON CO USA 32181
HOME DEPOT INC (2445 SPRINGFIELD AVE in VAUXHALL, NJ)
STATE MASTER (New Jersey environmental info) - NJEMS-NL001406, PESTICIDES - PESTICIDE APPLICATOR BUSINESS, PESTICIDES - APPLICATION Small Quantity Generators, between 100 kg and 1000 kg of hazardous waste/month (Resource Conservation and Recovery Act (tracking hazardous waste)) Organizations: HOME DEPOT USA INC (CONTACT/OPERATOR)
Alternative names: HOME DEPOT THE 915, HOME DEPOT #915
OZZIES ONE HOUR MARTINIZING (2919 VAUXHALL RD in VAUXHALL, NJ)
(Resource Conservation and Recovery Act (tracking hazardous waste))
PARKS PROFESSIONAL CLEANERS (2131 SPRINGFIELD AVE in VAUXHALL, NJ)
(Resource Conservation and Recovery Act (tracking hazardous waste))
PELLS AMOCO (2195 SPRINGFIELD AVE in VAUXHALL, NJ)
(Resource Conservation and Recovery Act (tracking hazardous waste))
Housing units lacking complete plumbing facilities: 1.2%
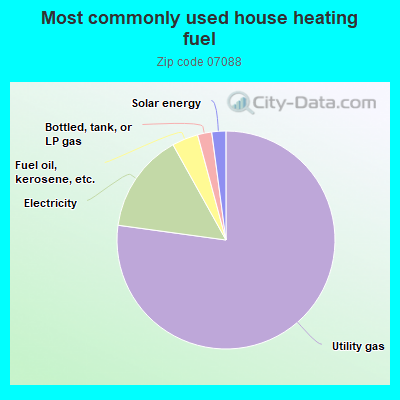
77.4%Utility gas
14.8%Electricity
3.9%Fuel oil, kerosene, etc.
2.1%Bottled, tank, or LP gas
2.1%Solar energy
Population in 1990: 3,481.
Place of birth for U.S.-born residents:
This state: 2,247
Northeast: 66
Midwest: 8
South: 154
69% of the 07088 zip code residents lived in the same house 5 years ago. Out of people who lived in different houses, 28% lived in this county. Out of people who lived in different counties, 50% lived in New Jersey.
96% of the 07088 zip code residents lived in the same house 1 year ago. Out of people who lived in different houses, 75% moved from this county. Out of people who lived in different houses, 14% moved from different county within same state. Out of people who lived in different houses, 9% moved from abroad.
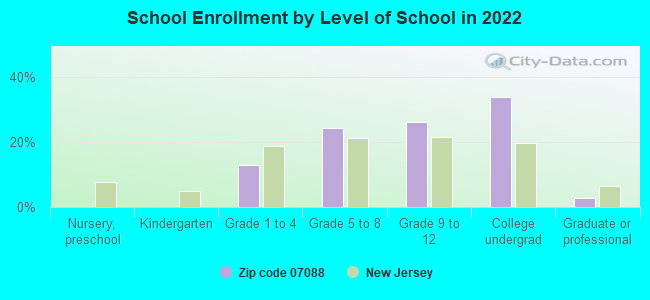
Private vs. public school enrollment:
Students in private schools in grades 1 to 8 (elementary and middle school): 153
Here:
57.1%
New Jersey:
12.3%
Students in private schools in grades 9 to 12 (high school): 12
Here:
6.7%
New Jersey:
13.1%
Students in private undergraduate colleges: 21
Here:
9.5%
New Jersey:
33.2%
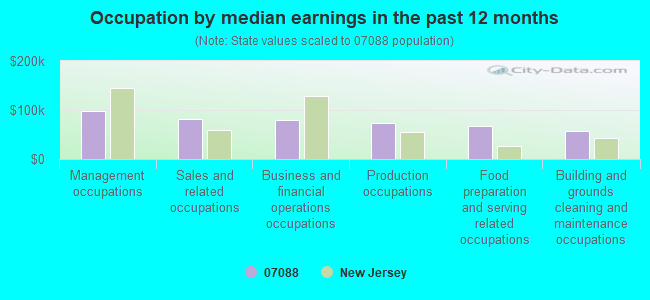
Occupation by median earnings in the past 12 months ($)
97,570Management occupations
81,364Sales and related occupations
79,795Business and financial operations occupations
73,936Production occupations
67,399Food preparation and serving related occupations
57,592Building and grounds cleaning and maintenance occupations
Top industries in this zip code by the number of employees in 2005:
Health Care and Social Assistance: Nursing Care Facilities (100-249 employees: 1 establishment)
Administrative and Support and Waste Management and Remediation Services: Landscaping Services (10-19: 1, 1-4: 2)
Construction: Water and Sewer Line and Related Structures Construction (10-19: 1, 1-4: 1)
Construction: Painting and Wall Covering Contractors (10-19: 1, 1-4: 1)
Arts, Entertainment, and Recreation: All Other Amusement and Recreation Industries (10-19: 1)
Construction: Highway, Street, and Bridge Construction (10-19: 1)
People in group quarters in 2010:
167 people in nursing facilities/skilled-nursing facilities
Home Mortgage Disclosure Act Aggregated Statistics For Year 2009 (Based on 2 partial tracts)
A) FHA, FSA/RHS & VA Home Purchase Loans
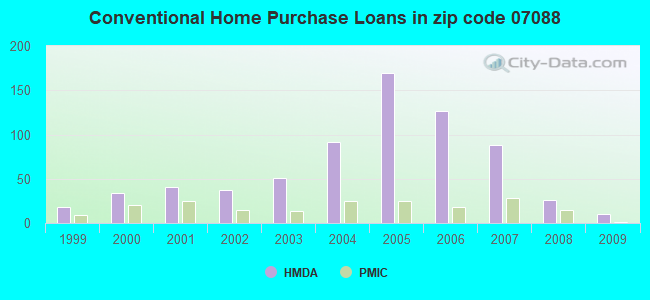
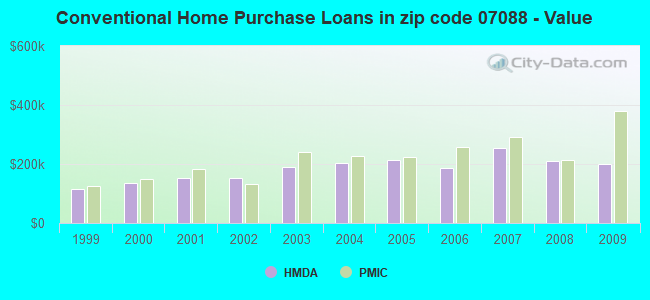
B) Conventional Home Purchase Loans
C) Refinancings
D) Home Improvement Loans
F) Non-occupant Loans on < 5 Family Dwellings (A B C & D)
Number
Average Value
Number
Average Value
Number
Average Value
Number
Average Value
Number
Average Value
LOANS ORIGINATED
26
$222,287
10
$201,508
89
$206,167
0
$0
7
$231,546
APPLICATIONS APPROVED, NOT ACCEPTED
4
$256,265
0
$0
6
$135,798
0
$0
0
$0
APPLICATIONS DENIED
4
$144,195
6
$180,822
67
$214,584
9
$87,612
3
$174,250
APPLICATIONS WITHDRAWN
3
$209,783
4
$189,460
28
$243,854
0
$0
1
$94,910
FILES CLOSED FOR INCOMPLETENESS
7
$244,479
3
$172,303
15
$238,305
0
$0
0
$0
Aggregated Statistics For Year 2008 (Based on 2 partial tracts)
A) FHA, FSA/RHS & VA Home Purchase Loans
B) Conventional Home Purchase Loans
C) Refinancings
D) Home Improvement Loans
F) Non-occupant Loans on < 5 Family Dwellings (A B C & D)
Number
Average Value
Number
Average Value
Number
Average Value
Number
Average Value
Number
Average Value
LOANS ORIGINATED
12
$287,416
26
$209,483
74
$195,430
13
$62,676
12
$199,682
APPLICATIONS APPROVED, NOT ACCEPTED
0
$0
10
$293,354
12
$197,979
9
$104,486
3
$354,343
APPLICATIONS DENIED
3
$286,200
16
$286,929
145
$253,390
19
$119,352
19
$249,003
APPLICATIONS WITHDRAWN
10
$245,314
4
$302,262
41
$260,913
4
$164,272
0
$0
FILES CLOSED FOR INCOMPLETENESS
1
$125,580
1
$585,540
10
$331,903
0
$0
0
$0
Aggregated Statistics For Year 2007 (Based on 2 partial tracts)
A) FHA, FSA/RHS & VA Home Purchase Loans
B) Conventional Home Purchase Loans
C) Refinancings
D) Home Improvement Loans
E) Loans on Dwellings For 5+ Families
F) Non-occupant Loans on < 5 Family Dwellings (A B C & D)
Number
Average Value
Number
Average Value
Number
Average Value
Number
Average Value
Number
Average Value
Number
Average Value
LOANS ORIGINATED
1
$750,540
88
$255,120
169
$231,809
26
$120,803
3
$200,533
32
$226,240
APPLICATIONS APPROVED, NOT ACCEPTED
0
$0
18
$264,458
57
$226,638
12
$133,852
0
$0
6
$293,987
APPLICATIONS DENIED
3
$236,067
50
$273,554
220
$264,641
42
$128,984
0
$0
19
$275,901
APPLICATIONS WITHDRAWN
0
$0
20
$270,137
89
$251,811
10
$107,909
0
$0
15
$315,598
FILES CLOSED FOR INCOMPLETENESS
0
$0
1
$420,540
23
$302,896
1
$14,600
0
$0
3
$342,660
Aggregated Statistics For Year 2006 (Based on 2 partial tracts)
A) FHA, FSA/RHS & VA Home Purchase Loans
B) Conventional Home Purchase Loans
C) Refinancings
D) Home Improvement Loans
F) Non-occupant Loans on < 5 Family Dwellings (A B C & D)
Number
Average Value
Number
Average Value
Number
Average Value
Number
Average Value
Number
Average Value
LOANS ORIGINATED
1
$376,730
127
$187,274
251
$222,061
35
$125,202
34
$224,269
APPLICATIONS APPROVED, NOT ACCEPTED
0
$0
26
$185,445
74
$215,577
6
$120,467
7
$142,891
APPLICATIONS DENIED
0
$0
57
$203,455
188
$220,684
22
$77,390
32
$183,164
APPLICATIONS WITHDRAWN
1
$294,960
38
$219,299
117
$213,876
7
$181,899
6
$229,982
FILES CLOSED FOR INCOMPLETENESS
0
$0
16
$230,894
39
$253,888
1
$55,490
1
$189,830
Aggregated Statistics For Year 2005 (Based on 2 partial tracts)
A) FHA, FSA/RHS & VA Home Purchase Loans
B) Conventional Home Purchase Loans
C) Refinancings
D) Home Improvement Loans
F) Non-occupant Loans on < 5 Family Dwellings (A B C & D)
G) Loans On Manufactured Home Dwelling (A B C & D)
Number
Average Value
Number
Average Value
Number
Average Value
Number
Average Value
Number
Average Value
Number
Average Value
LOANS ORIGINATED
9
$254,561
169
$211,971
279
$194,217
25
$52,684
37
$219,661
0
$0
APPLICATIONS APPROVED, NOT ACCEPTED
3
$301,773
25
$199,697
54
$184,824
4
$16,792
6
$295,933
0
$0
APPLICATIONS DENIED
7
$261,793
31
$178,239
181
$194,247
54
$50,701
12
$169,018
1
$630,810
APPLICATIONS WITHDRAWN
0
$0
39
$241,457
165
$210,826
10
$55,488
20
$231,807
0
$0
FILES CLOSED FOR INCOMPLETENESS
0
$0
10
$215,380
19
$257,841
0
$0
3
$330,007
0
$0
Aggregated Statistics For Year 2004 (Based on 2 partial tracts)
A) FHA, FSA/RHS & VA Home Purchase Loans
B) Conventional Home Purchase Loans
C) Refinancings
D) Home Improvement Loans
E) Loans on Dwellings For 5+ Families
F) Non-occupant Loans on < 5 Family Dwellings (A B C & D)
G) Loans On Manufactured Home Dwelling (A B C & D)
Number
Average Value
Number
Average Value
Number
Average Value
Number
Average Value
Number
Average Value
Number
Average Value
Number
Average Value
LOANS ORIGINATED
7
$288,703
92
$204,539
191
$170,813
26
$104,517
1
$394,250
20
$198,295
0
$0
APPLICATIONS APPROVED, NOT ACCEPTED
3
$238,500
13
$224,309
50
$170,873
9
$28,393
0
$0
7
$196,710
0
$0
APPLICATIONS DENIED
1
$489,170
26
$246,156
142
$173,394
45
$68,727
0
$0
23
$240,235
1
$80,310
APPLICATIONS WITHDRAWN
6
$231,928
39
$189,189
86
$165,410
4
$18,618
0
$0
23
$181,065
0
$0
FILES CLOSED FOR INCOMPLETENESS
1
$343,150
0
$0
12
$164,029
3
$12,170
0
$0
1
$254,070
0
$0
Aggregated Statistics For Year 2003 (Based on 2 partial tracts)
A) FHA, FSA/RHS & VA Home Purchase Loans
B) Conventional Home Purchase Loans
C) Refinancings
D) Home Improvement Loans
F) Non-occupant Loans on < 5 Family Dwellings (A B C & D)
Number
Average Value
Number
Average Value
Number
Average Value
Number
Average Value
Number
Average Value
LOANS ORIGINATED
18
$206,699
51
$190,227
294
$152,213
16
$50,012
35
$164,001
APPLICATIONS APPROVED, NOT ACCEPTED
1
$238,010
19
$194,207
72
$138,313
7
$59,660
16
$120,831
APPLICATIONS DENIED
0
$0
18
$163,137
114
$136,337
34
$31,180
10
$146,604
APPLICATIONS WITHDRAWN
4
$294,595
15
$168,605
92
$146,068
3
$25,310
6
$197,857
FILES CLOSED FOR INCOMPLETENESS
0
$0
6
$208,808
12
$167,680
1
$87,610
0
$0
Aggregated Statistics For Year 2002 (Based on 2 partial tracts)
A) FHA, FSA/RHS & VA Home Purchase Loans
B) Conventional Home Purchase Loans
C) Refinancings
D) Home Improvement Loans
E) Loans on Dwellings For 5+ Families
F) Non-occupant Loans on < 5 Family Dwellings (A B C & D)
Number
Average Value
Number
Average Value
Number
Average Value
Number
Average Value
Number
Average Value
Number
Average Value
LOANS ORIGINATED
15
$181,357
37
$151,387
169
$137,069
20
$29,788
1
$328,550
19
$164,618
APPLICATIONS APPROVED, NOT ACCEPTED
3
$173,277
7
$170,426
37
$146,533
9
$51,593
0
$0
0
$0
APPLICATIONS DENIED
3
$237,040
10
$126,453
93
$113,943
12
$12,412
0
$0
9
$91,343
APPLICATIONS WITHDRAWN
3
$123,630
7
$139,344
64
$139,403
3
$24,823
0
$0
3
$143,100
FILES CLOSED FOR INCOMPLETENESS
0
$0
0
$0
15
$126,259
0
$0
0
$0
1
$170,840
Aggregated Statistics For Year 2001 (Based on 2 partial tracts)
A) FHA, FSA/RHS & VA Home Purchase Loans
B) Conventional Home Purchase Loans
C) Refinancings
D) Home Improvement Loans
E) Loans on Dwellings For 5+ Families
F) Non-occupant Loans on < 5 Family Dwellings (A B C & D)
Number
Average Value
Number
Average Value
Number
Average Value
Number
Average Value
Number
Average Value
Number
Average Value
LOANS ORIGINATED
19
$190,595
41
$152,074
111
$126,327
13
$26,172
0
$0
12
$144,073
APPLICATIONS APPROVED, NOT ACCEPTED
6
$208,078
6
$194,207
16
$81,954
4
$43,805
0
$0
0
$0
APPLICATIONS DENIED
4
$170,478
13
$183,985
96
$78,942
19
$15,832
1
$292,040
1
$248,230
APPLICATIONS WITHDRAWN
3
$250,667
4
$190,555
50
$110,304
9
$16,711
0
$0
3
$115,843
FILES CLOSED FOR INCOMPLETENESS
0
$0
4
$90,532
7
$91,576
0
$0
0
$0
0
$0
Aggregated Statistics For Year 2000 (Based on 2 partial tracts)
A) FHA, FSA/RHS & VA Home Purchase Loans
B) Conventional Home Purchase Loans
C) Refinancings
D) Home Improvement Loans
F) Non-occupant Loans on < 5 Family Dwellings (A B C & D)
Number
Average Value
Number
Average Value
Number
Average Value
Number
Average Value
Number
Average Value
LOANS ORIGINATED
25
$142,749
34
$135,455
53
$110,479
10
$20,005
10
$144,268
APPLICATIONS APPROVED, NOT ACCEPTED
4
$160,988
4
$108,055
29
$92,597
16
$23,819
0
$0
APPLICATIONS DENIED
1
$173,760
23
$143,734
93
$86,497
20
$10,660
7
$133,296
APPLICATIONS WITHDRAWN
10
$111,267
12
$105,742
34
$59,138
12
$39,303
0
$0
FILES CLOSED FOR INCOMPLETENESS
0
$0
4
$202,602
13
$133,665
0
$0
1
$420,540
Aggregated Statistics For Year 1999 (Based on 1 partial tract)
A) FHA, FSA/RHS & VA Home Purchase Loans
B) Conventional Home Purchase Loans
C) Refinancings
D) Home Improvement Loans
E) Loans on Dwellings For 5+ Families
F) Non-occupant Loans on < 5 Family Dwellings (A B C & D)


 Nearest zip codes: 07041, 07040, 07083, 07079, 07033, 07081.