Estimated zip code population in 2022: 12,102 Zip code population in 2010: 11,601 Zip code population in 2000: 11,546
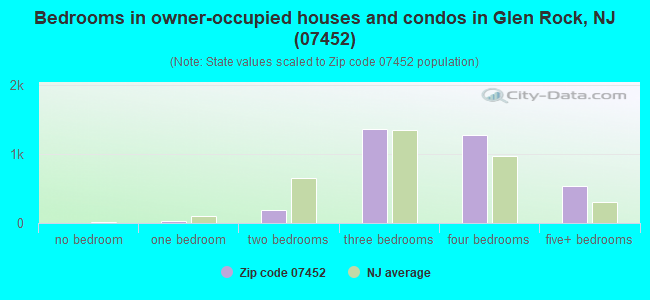
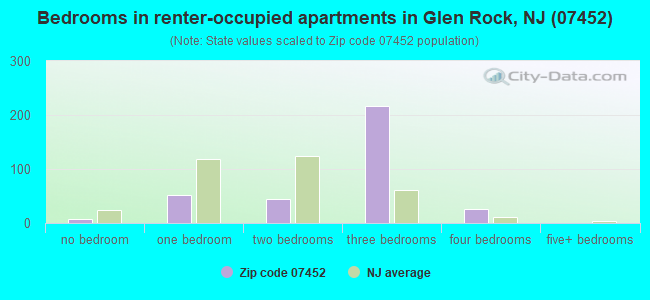
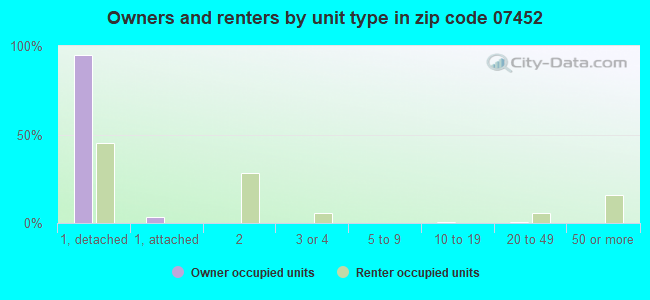
Houses and condos: 3,831 Renter-occupied apartments: 354
% of renters here:
9%
State:
35%
March 2022 cost of living index in zip code 07452: 117.8 (more than average, U.S. average is 100)
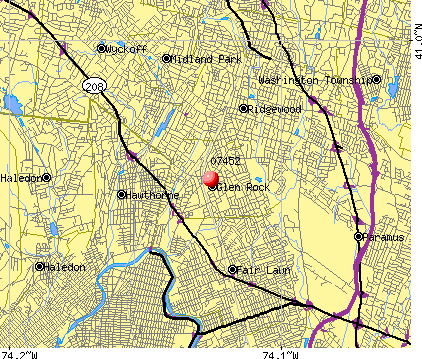
Land area: 2.7 sq. mi. Water area: 0.0 sq. mi.
Population density: 4,459 people per square mile
(average).
OSM Map
Google Map
MSN Map
OSM Map
General Map
Google Map
MSN Map
OSM Map
Google Map
MSN Map
OSM Map
Google Map
MSN Map
Please wait while loading the map...
Real estate property taxes paid for housing units in 2022:
This zip code:
1.1% ($9,521)
New Jersey:
2.1% ($8,897)
Median real estate property taxes paid for housing units with mortgages in 2022: $9,557 (1.1%) Median real estate property taxes paid for housing units with no mortgage in 2022: $9,483 (1.2%)
Business Search- 14 Million verified businesses
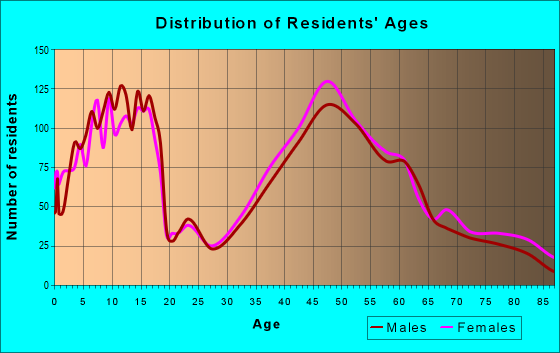
Males: 6,042
(49.9%)
Females: 6,060
(50.1%)
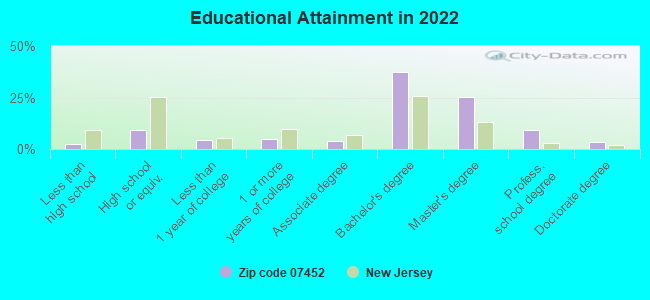
For population 25 years and over in 07452:
High school or higher: 99.4%
Bachelor's degree or higher: 76.8%
Graduate or professional degree: 38.6%
Unemployed: 5.3%
Mean travel time to work (commute): 37.0 minutes
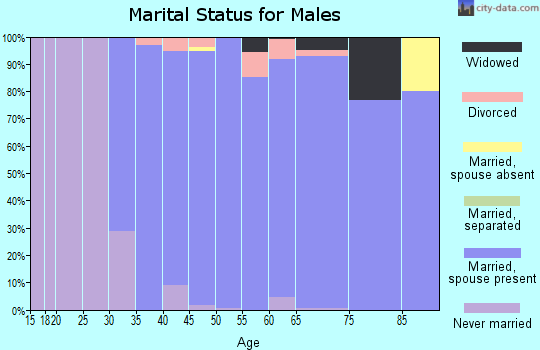
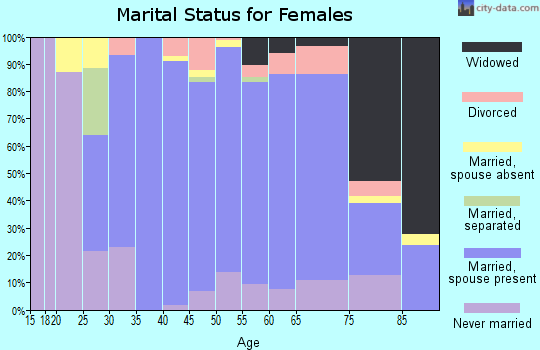
For population 15 years and over in 07452:
Never married: 24.5%
Now married: 67.4%
Separated: 0.0%
Widowed: 3.3%
Divorced: 4.8%
Zip code 07452 compared to state average:
Median household income above state average.
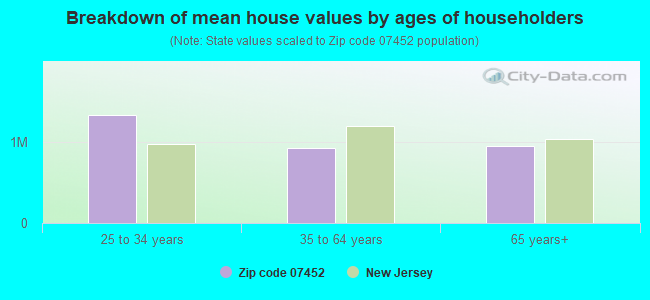
Median house value above state average.
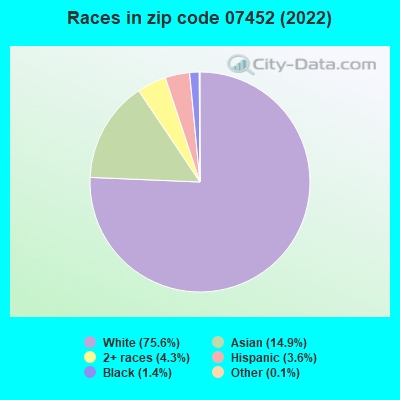
Black race population percentage significantly below state average.
Hispanic race population percentage significantly below state average.
Renting percentage significantly below state average.
Estimated median house/condo value in 2022: $840,170
07452:
$840,170
New Jersey:
$428,900
Median resident age:
This zip code:
39.7 years
New Jersey median age:
40.4 years
Average household size:
This zip code:
3.2 people
New Jersey:
2.6 people
Averages for the 2020 tax year for zip code 07452, filed in 2021:
Average Adjusted Gross Income (AGI) in 2020: $219,700 (Individual Income Tax Returns)
Here:
$219,700
State:
$95,247
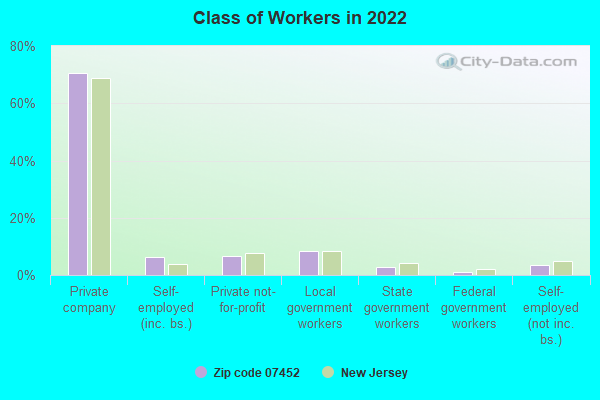
Salary/wage: $196,625 (reported on 80.3% of returns)
Here:
$196,625
State:
$80,635
(% of AGI for various income ranges: 1161.6% for AGIs below $25k, 3910.0% for AGIs $25k-50k, 7042.0% for AGIs $50k-75k, 9107.0% for AGIs $75k-100k, 19874.7% for AGIs $100k-200k, 112400.5% for AGIs over 200k)
Taxable interest for individuals: $2,695 (reported on 60.4% of returns)
This zip code:
$2,695
New Jersey:
$2,414
(% of AGI for various income ranges: 64.8% for AGIs below $25k, 125.0% for AGIs $25k-50k, 144.0% for AGIs $50k-75k, 217.0% for AGIs $75k-100k, 284.5% for AGIs $100k-200k, 933.3% for AGIs over 200k)
Ordinary dividends: $11,628 (reported on 58.2% of returns)
Here:
$11,628
State:
$8,057
(% of AGI for various income ranges: 180.7% for AGIs below $25k, 228.9% for AGIs $25k-50k, 468.8% for AGIs $50k-75k, 743.5% for AGIs $75k-100k, 1073.3% for AGIs $100k-200k, 4287.8% for AGIs over 200k)
Net capital gain/loss in AGI: +$36,459 (reported on 51.2% of returns)
Here:
+$36,459
State:
+$25,022
(% of AGI for various income ranges: 107.7% for AGIs below $25k, 168.6% for AGIs $25k-50k, 442.8% for AGIs $50k-75k, 537.5% for AGIs $75k-100k, 776.0% for AGIs $100k-200k, 15317.2% for AGIs over 200k)
Profit/loss from business: +$33,359 (reported on 19.9% of returns)
Here:
+$33,359
State:
+$18,035
(% of AGI for various income ranges: 152.5% for AGIs below $25k, 345.7% for AGIs $25k-50k, 452.4% for AGIs $50k-75k, 671.5% for AGIs $75k-100k, 1329.3% for AGIs $100k-200k, 3923.0% for AGIs over 200k)
Taxable individual retirement arrangement distribution: $25,264 (reported on 12.9% of returns)
07452:
$25,264
New Jersey:
$21,558
(% of AGI for various income ranges: 85.0% for AGIs below $25k, 200.4% for AGIs $25k-50k, 434.8% for AGIs $50k-75k, 991.0% for AGIs $75k-100k, 1122.4% for AGIs $100k-200k, 1153.0% for AGIs over 200k)
Self-employed (Keogh) retirement plans: $31,239 (reported on 3.4% of returns)
07452:
$31,239
New Jersey:
$30,844
(% of AGI for various income ranges: 152.4% for AGIs $100k-200k, 789.8% for AGIs over 200k)
Total itemized deductions: $35,928 (reported on 32.3% of returns)
Here:
$35,928
State:
$32,863
(% of AGI for various income ranges: 254.1% for AGIs below $25k, 627.9% for AGIs $25k-50k, 1206.8% for AGIs $50k-75k, 1605.0% for AGIs $75k-100k, 2037.8% for AGIs $100k-200k, 6812.3% for AGIs over 200k)
Charity contributions: $8,140 (reported on 28.7% of returns)
Here:
$8,140
State:
$7,880
(% of AGI for various income ranges: 18.6% for AGIs below $25k, 43.9% for AGIs $25k-50k, 102.8% for AGIs $50k-75k, 194.5% for AGIs $75k-100k, 259.8% for AGIs $100k-200k, 1682.7% for AGIs over 200k)
Taxes paid: $9,793 (reported on 32.3% of returns)
07452:
$9,793
State:
$9,183
(% of AGI for various income ranges: 88.6% for AGIs below $25k, 196.8% for AGIs $25k-50k, 320.4% for AGIs $50k-75k, 561.5% for AGIs $75k-100k, 655.0% for AGIs $100k-200k, 1696.7% for AGIs over 200k)
Earned income credit: $1,442 (reported on 2.3% of returns)
Here:
$1,442
State:
$2,148
(% of AGI for various income ranges: 25.0% for AGIs below $25k, 22.5% for AGIs $25k-50k)
Percentage of individuals using paid preparers for their 2020 taxes: 93.6%
Here:
94%
State:
92%
(% for various income ranges: 90.8% for AGIs below $25k, 93.9% for AGIs $25k-50k, 90.7% for AGIs $50k-75k, 92.3% for AGIs $75k-100k, 92.4% for AGIs $100k-200k, 96.8% for AGIs over 200k)
Averages for the 2012 tax year for zip code 07452, filed in 2013:
Average Adjusted Gross Income (AGI) in 2012: $160,568 (Individual Income Tax Returns)
Here:
$160,568
State:
$79,688
Salary/wage: $143,926 (reported on 80.6% of returns)
Here:
$143,926
State:
$68,122
(% of AGI for various income ranges: 63.3% for AGIs below $25k, 63.0% for AGIs $25k-50k, 59.5% for AGIs $50k-75k, 55.0% for AGIs $75k-100k, 73.8% for AGIs $100k-200k, 74.0% for AGIs over 200k)
Taxable interest for individuals: $2,362 (reported on 63.7% of returns)
This zip code:
$2,362
New Jersey:
$2,193
(% of AGI for various income ranges: 2.9% for AGIs below $25k, 1.6% for AGIs $25k-50k, 1.7% for AGIs $50k-75k, 2.0% for AGIs $75k-100k, 1.1% for AGIs $100k-200k, 0.7% for AGIs over 200k)
Ordinary dividends: $7,599 (reported on 56.1% of returns)
Here:
$7,599
State:
$6,828
(% of AGI for various income ranges: 8.4% for AGIs below $25k, 4.7% for AGIs $25k-50k, 4.8% for AGIs $50k-75k, 5.6% for AGIs $75k-100k, 2.7% for AGIs $100k-200k, 2.1% for AGIs over 200k)
Net capital gain/loss in AGI: +$15,461 (reported on 46.4% of returns)
Here:
+$15,461
State:
+$15,358
(% of AGI for various income ranges: 0.7% for AGIs below $25k, 0.9% for AGIs $50k-75k, 0.8% for AGIs $75k-100k, 1.1% for AGIs $100k-200k, 6.4% for AGIs over 200k)
Profit/loss from business: +$30,172 (reported on 19.1% of returns)
Here:
+$30,172
State:
+$19,577
(% of AGI for various income ranges: 7.9% for AGIs below $25k, 7.0% for AGIs $25k-50k, 6.7% for AGIs $50k-75k, 4.6% for AGIs $75k-100k, 5.2% for AGIs $100k-200k, 2.5% for AGIs over 200k)
Taxable individual retirement arrangement distribution: $21,951 (reported on 16.4% of returns)
07452:
$21,951
New Jersey:
$18,214
(% of AGI for various income ranges: 4.9% for AGIs below $25k, 5.2% for AGIs $25k-50k, 4.8% for AGIs $50k-75k, 6.0% for AGIs $75k-100k, 3.3% for AGIs $100k-200k, 1.3% for AGIs over 200k)
Self-employment retirement plans: $23,389 (reported on 3.6% of returns)
07452:
$23,389
New Jersey:
$24,511
(% of AGI for various income ranges: 2.2% for AGIs below $25k, 0.6% for AGIs $100k-200k, 0.5% for AGIs over 200k)
Total itemized deductions: $44,447 (20% of AGI, reported on 69.2% of returns)
Here:
$44,447
State:
$30,827
Here:
20.2% of AGI
State:
21.2% of AGI
(% of AGI for various income ranges: 33.9% for AGIs below $25k, 27.5% for AGIs $25k-50k, 29.4% for AGIs $50k-75k, 27.1% for AGIs $75k-100k, 22.7% for AGIs $100k-200k, 16.2% for AGIs over 200k)
Charity contributions: $4,264 (reported on 62.6% of returns)
Here:
$4,264
State:
$3,451
(% of AGI for various income ranges: 1.4% for AGIs below $25k, 1.5% for AGIs $25k-50k, 2.1% for AGIs $50k-75k, 2.5% for AGIs $75k-100k, 1.8% for AGIs $100k-200k, 1.5% for AGIs over 200k)
Taxes paid: $27,230 (reported on 69.0% of returns)
07452:
$27,230
State:
$15,801
(% of AGI for various income ranges: 15.3% for AGIs below $25k, 12.5% for AGIs $25k-50k, 14.1% for AGIs $50k-75k, 14.4% for AGIs $75k-100k, 12.9% for AGIs $100k-200k, 10.8% for AGIs over 200k)
Earned income credit: $1,750 (reported on 3.0% of returns)
Here:
$1,750
State:
$2,182
(% of AGI for various income ranges: 2.0% for AGIs below $25k, 0.4% for AGIs $25k-50k)
Percentage of individuals using paid preparers for their 2012 taxes: 67.1%
Here:
67%
State:
65%
(% for various income ranges: 63.3% for AGIs below $25k, 60.7% for AGIs $25k-50k, 66.7% for AGIs $50k-75k, 68.2% for AGIs $75k-100k, 67.6% for AGIs $100k-200k, 72.7% for AGIs over 200k)
Averages for the 2004 tax year for zip code 07452, filed in 2005:
Average Adjusted Gross Income (AGI) in 2004: $115,988 (Individual Income Tax Returns)
Here:
$115,988
State:
$64,921
Salary/wage: $107,052 (reported on 76.9% of returns)
Here:
$107,052
State:
$57,755
(% of AGI for various income ranges: 175.7% for AGIs below $10k, 47.2% for AGIs $10k-25k, 60.3% for AGIs $25k-50k, 61.2% for AGIs $50k-75k, 68.6% for AGIs $75k-100k, 72.3% for AGIs over 100k)
Taxable interest for individuals: $3,206 (reported on 77.8% of returns)
This zip code:
$3,206
New Jersey:
$2,068
(% of AGI for various income ranges: 32.4% for AGIs below $10k, 8.6% for AGIs $10k-25k, 4.5% for AGIs $25k-50k, 3.2% for AGIs $50k-75k, 2.4% for AGIs $75k-100k, 1.7% for AGIs over 100k)
Taxable dividends: $5,475 (reported on 61.7% of returns)
Here:
$5,475
State:
$3,959
(% of AGI for various income ranges: 29.6% for AGIs below $10k, 9.1% for AGIs $10k-25k, 5.4% for AGIs $25k-50k, 4.4% for AGIs $50k-75k, 3.1% for AGIs $75k-100k, 2.5% for AGIs over 100k)
Net capital gain/loss: +$11,658 (reported on 50.4% of returns)
Here:
+$11,658
State:
+$13,591
(% of AGI for various income ranges: -6.8% for AGIs below $10k, 1.4% for AGIs $10k-25k, 1.1% for AGIs $25k-50k, 1.8% for AGIs $50k-75k, 1.1% for AGIs $75k-100k, 6.0% for AGIs over 100k)
Profit/loss from business: +$30,213 (reported on 18.1% of returns)
Here:
+$30,213
State:
+$17,520
(% of AGI for various income ranges: 8.7% for AGIs below $10k, 9.0% for AGIs $10k-25k, 6.2% for AGIs $25k-50k, 7.2% for AGIs $50k-75k, 5.6% for AGIs $75k-100k, 4.3% for AGIs over 100k)
IRA payment deduction: $3,680 (reported on 4.3% of returns)
07452:
$3,680
New Jersey:
$3,270
(% of AGI for various income ranges: 0.8% for AGIs $10k-25k, 0.5% for AGIs $25k-50k, 0.3% for AGIs $50k-75k, 0.3% for AGIs $75k-100k, 0.1% for AGIs over 100k)
Self-employed pension: $19,088 (reported on 4.2% of returns)
Here:
$19,088
New Jersey:
$17,258
(% of AGI for various income ranges: 0.5% for AGIs $50k-75k, 0.4% for AGIs $75k-100k, 0.8% for AGIs over 100k)
Total itemized deductions: $34,947 (21% of AGI, reported on 67.4% of returns)
Here:
$34,947
State:
$23,924
Here:
21.5% of AGI
State:
21.1% of AGI
(% of AGI for various income ranges: 45.4% for AGIs below $10k, 43.7% for AGIs $10k-25k, 27.9% for AGIs $25k-50k, 26.8% for AGIs $50k-75k, 26.7% for AGIs $75k-100k, 18.4% for AGIs over 100k)
Charity contributions deductions: $3,966 (2% of AGI, reported on 63.8% of returns)
Here:
$3,966
State:
$3,242
Here:
2.4% of AGI
State:
2.7% of AGI
(% of AGI for various income ranges: 1.8% for AGIs below $10k, 2.5% for AGIs $10k-25k, 2.3% for AGIs $25k-50k, 2.8% for AGIs $50k-75k, 2.7% for AGIs $75k-100k, 2.1% for AGIs over 100k)
Total tax: $24,766 (reported on 83.4% of returns)
07452:
$24,766
State:
$12,321
(% of AGI for various income ranges: 5.5% for AGIs below $10k, 4.7% for AGIs $10k-25k, 7.5% for AGIs $25k-50k, 8.9% for AGIs $50k-75k, 9.7% for AGIs $75k-100k, 19.9% for AGIs over 100k)
Earned income credit: $1,374 (reported on 2.0% of returns)
Here:
$1,374
State:
$1,711
Percentage of individuals using paid preparers for their 2004 taxes: 66.5%
Here:
66%
State:
65%
(% for various income ranges: 63.6% for AGIs below $10k, 57.7% for AGIs $10k-25k, 61.8% for AGIs $25k-50k, 67.2% for AGIs $50k-75k, 68.2% for AGIs $75k-100k, 70.8% for AGIs over 100k)
Household received Food Stamps/SNAP in the past 12 months: 11 Household did not receive Food Stamps/SNAP in the past 12 months: 3,680
Women who had a birth in the past 12 months: 93 (55 now married, 37 unmarried) Women who did not have a birth in the past 12 months: 2,525 (1,546 now married, 968 unmarried)
Housing units in zip code 07452 with a mortgage: 2,133 (280 second mortgage, 287 both second mortgage and home equity loan) Houses without a mortgage: 73
Median monthly owner costs for units with a mortgage: $3,744 Median monthly owner costs for units without a mortgage: $1,425
Residents with income below the poverty level in 2022:
This zip code:
2.3%
Whole state:
9.7%
Residents with income below 50% of the poverty level in 2022:
This zip code:
0.2%
Whole state:
5.2%
Median number of rooms in houses and condos:
Here:
7.9
State:
6.8
Median number of rooms in apartments:
Here:
4.4
State:
3.9
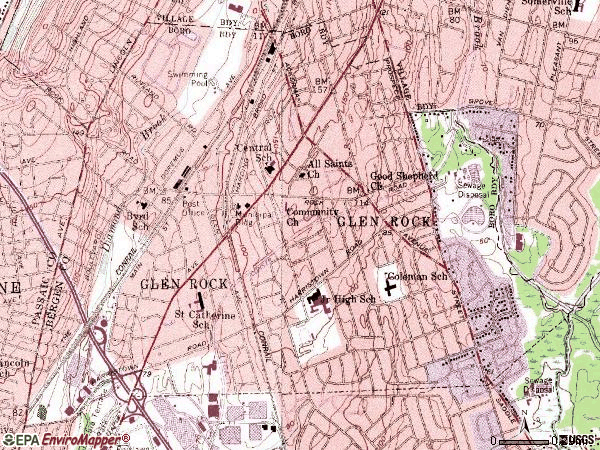
Notable locations in this zip code not listed on our city pages
Notable locations in zip code 07452: Glen Rock Ambulance Corps (A), Glen Rock Public Library (B), Glen Rock Fire Department (C), Glen Rock Municipal Building (D). Display/hide their locations on the map
Churches in zip code 07452 include: Lutheran Church of the Good Shepherd (A), All Saints Episcopal Church (B), Saint Catherines Roman Catholic Church (C), Community Church of Glen Rock (D). Display/hide their locations on the map
In group quarters: 20 (-1 institutionalized population)
Size of family households: 966 2-persons, 712 3-persons, 1,135 4-persons, 267 5-persons, 158 6-persons, 30 7-or-more-persons
Size of nonfamily households: 364 1-person, 70 2-persons
3,570 married couples with children.
289 single-parent households (35 men, 254 women).
79.5% of residents of 07452 zip code speak English at home.
1.9% of residents speak Spanish at home (69% very well, 31% well).
6.4% of residents speak other Indo-European language at home (91% very well, 9% well).
10.8% of residents speak Asian or Pacific Island language at home (67% very well, 20% well, 14% not well).
0.7% of residents speak other language at home (100% very well).
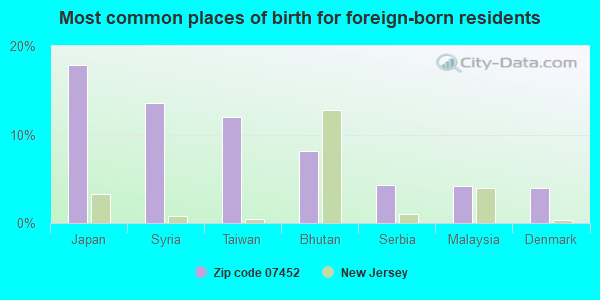
Foreign born population: 1,991 (16.5%) (65.9% of them are naturalized citizens)
This zip code:
16.5%
Whole state:
23.5%
18%Japan
14%Syria
12%Taiwan
8%Bhutan
4%Serbia
4%Malaysia
4%Denmark
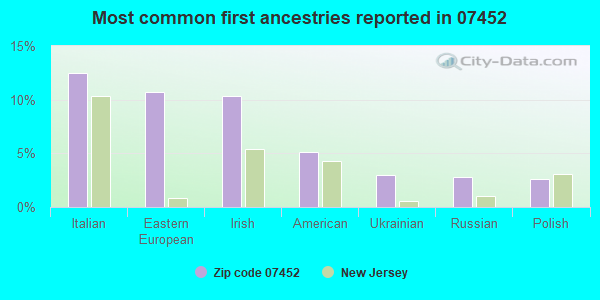
13%Italian
11%Eastern European
10%Irish
5%American
3%Ukrainian
3%Russian
3%Polish
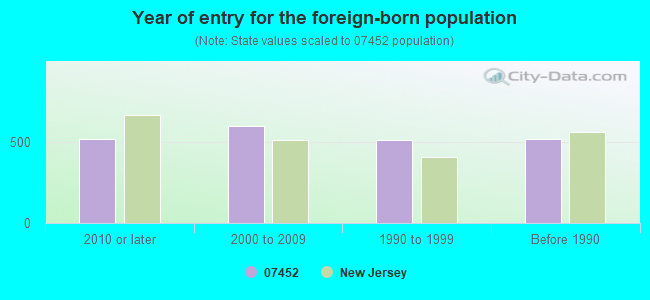
Year of entry for the foreign-born population
5192010 or later
5992000 to 2009
5131990 to 1999
517Before 1990
Major facilities with environmental interests located in this zip code:
GLEN ROCK BORO BD OF ED CLARA COLEMAN SCHOOL (100 PINELYNN RD in GLEN ROCK BORO, NJ)
(National Center for Education Statistics) - STATE ID-090 STATE MASTER (New Jersey environmental info) - NJEMS-016087, STATE CLEANUP SITE, NJEMS-02568, AIR PROGRAM Business SIC classification: ELEMENTARY AND SECONDARY SCHOOLS
AMERADA HESS SERVICE STATION #30274 (390 SOUTH MAPLE AVENUE in GLEN ROCK, NJ)
STATE MASTER (New Jersey environmental info) - NJEMS-006672, STATE CLEANUP SITE, NJEMS-01431, AIR PROGRAM, NJEMS-27557900040, EPCRA, NJEMS-B0082, AIR PROGRAM Conditionally Exempt Small Quantity Generators, less than 100 kg/month of hazardous waste (Resource Conservation and Recovery Act (tracking hazardous waste)) - notification Business SIC classification: GASOLINE SERVICE STATIONS Organizations: AMERADA HESS CORP, KIMBER PETROLEUM CORP, GLEN ROCK SERVICE, HESS CORP, AMERADA HESS CORP (CONTACT/OWNER)
, KIMBER PETROLEUM CORP (CONTACT/OWNER)
, HESS CORP (CONTACT/OWNER)
Alternative names: AMERADA HESS STA 30274, AMERADA HESS STAtion number 30274
GLEN ROCK BORO BD OF ED JR SR HIGH SCHOOL (600 HARRISTOWN RD in GLEN ROCK BORO, NJ)
(National Center for Education Statistics) - STATE ID-050 STATE MASTER (New Jersey environmental info) - NJEMS-016086, STATE CLEANUP SITE, NJEMS-016089,
GLEN ROCK BORO MUNICIPAL BUILDING (HARDING PLAZA RD in GLEN ROCK BORO, NJ)
STATE MASTER (New Jersey environmental info) - NJEMS-009539, STATE CLEANUP SITE, NJEMS-009540, NJEMS-197969, National Pollutant Discharge Elimination System Permit, NJEMS-198736, REFUSE DISPOSAL National Pollutant Discharge Elimination System NON-MAJOR (Tracking pollutant discharge elimination systems) - permit
GRACIE CLEANERS (238 ROCK RD in GLEN ROCK,NJ, NJ)
AIR MINOR (AIRS/AFS) STATE MASTER (New Jersey environmental info) - NJEMS-66782700000, EPCRA, NJEMS-L0160, AIR PROGRAM Business SIC classification: SERVICE ESTABLISHMENT EQUIPMENT AND SUPPLIES; DRYCLEANING PLANTS, EXCEPT RUG CLEANING Organizations: HARN ENTERPRISE, GLEN ROCK CLEANERS LLC D/B/A GRACIE CLEANERS Alternative names: EXCEL CLEANERS
HOME FUEL OIL CO INC (471 DOREMUS AVE in GLEN ROCK, NJ)
STATE MASTER (New Jersey environmental info) - NJEMS-00000001863, EPCRA, NJEMS-008880, STATE CLEANUP SITE, NJEMS-46453, National Pollutant Discharge Elimination System Permit (Resource Conservation and Recovery Act (tracking hazardous waste)) Business SIC classification: PETROLEUM BULK STATIONS AND TERMINALS; PETROLEUM AND PETROLEUM PRODUCTS WHOLESALERS, EXCEPT BULK STATIONS AND TERMINALS
CITIZENS 1ST NATIONAL BANK (208 HARRISTOWN ROAD in GLEN ROCK, NJ)
STATE MASTER (New Jersey environmental info) - NJEMS-022855, STATE CLEANUP SITE (Resource Conservation and Recovery Act (tracking hazardous waste)) Organizations: CITIZENS FIRST NATIONAL BANK (CONTACT/OWNER)
Alternative names: CITIZENS FIRST NATIONAL BANK
PAXALL CIRCLE MACHINERY (161 HARRISTOWN ROAD in GLEN ROCK, NJ)
STATE MASTER (New Jersey environmental info) - NJEMS-G000003982, STATE CLEANUP SITE (Resource Conservation and Recovery Act (tracking hazardous waste))
ATOCHEM POLYMERS INC (139 HARRISTOWN RD in GLEN ROCK, NJ)
(Integrated Compliance Information System) - ICIS-02-1986-0290, FORMAL ENFORCEMENT ACTION COMPLIANCE ACTIVITY (Tracking inspections of insecticide, fungicide, and rodenticide, and toxic substances) Business SIC classification: PLASTICS MATERIALS, SYNTHETIC RESINS, AND NONVULCANIZABLE ELASTOMERS
ATOCHEM, INCORPORATED (266 HARRISON ROAD, P.O. BOX 607 in GLEN ROCK, NJ)
AIR MINOR (AIRS/AFS) COMPLIANCE ACTIVITY (Tracking inspections of insecticide, fungicide, and rodenticide, and toxic substances) Business SIC classification: NONCLASSIFIABLE ESTABLISHMENTS Alternative names: ATOCHEM USA
GLEN ROCK CITY OF RIDGEWOOD BD OF ED (561 PROSPECT ST in GLEN ROCK, NJ)
(Integrated Compliance Information System) - ICIS-02-1992-0115, FORMAL ENFORCEMENT ACTION Small Quantity Generators, between 100 kg and 1000 kg of hazardous waste/month (Resource Conservation and Recovery Act (tracking hazardous waste))
GLEN ROCK MIDDLE SCH (400 HAMILTON AVENUE in GLEN ROCK, NJ)
(National Center for Education Statistics) - STATE ID-060 Organizations: GLEN ROCK BORO (SCHOOL DISTRICT)
AMERICAN COLOR (65 HARRISTOWN RD in GLEN ROCK, NJ)
Housing units lacking complete plumbing facilities: 1.3% Housing units lacking complete kitchen facilities: 2.2%
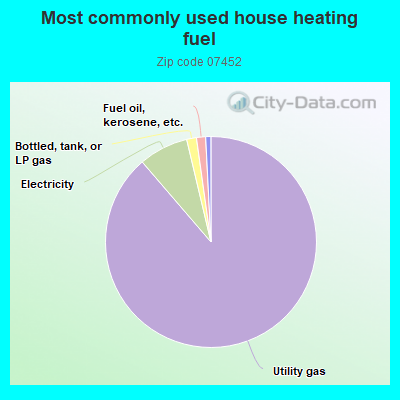
88.8%Utility gas
7.6%Electricity
1.5%Bottled, tank, or LP gas
1.4%Fuel oil, kerosene, etc.
0.8%Other fuel
Population in 1990: 10,942. Population change in the 1990s: +604 (+5.5%).
Place of birth for U.S.-born residents:
This state: 5,082
Northeast: 3,964
Midwest: 258
South: 352
West: 324
73% of the 07452 zip code residents lived in the same house 5 years ago. Out of people who lived in different houses, 52% lived in this county. Out of people who lived in different counties, 50% lived in New Jersey.
87% of the 07452 zip code residents lived in the same house 1 year ago. Out of people who lived in different houses, 29% moved from this county. Out of people who lived in different houses, 33% moved from different county within same state. Out of people who lived in different houses, 30% moved from different state. Out of people who lived in different houses, 8% moved from abroad.
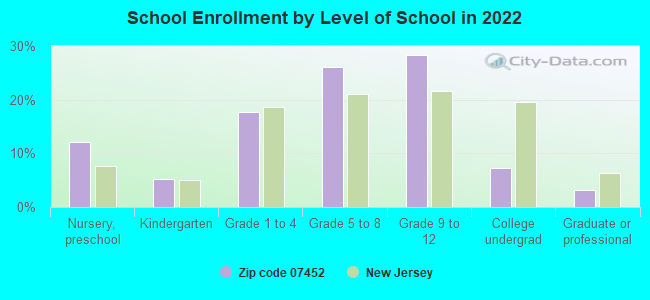
Private vs. public school enrollment:
Students in private schools in grades 1 to 8 (elementary and middle school): 91
Here:
5.3%
New Jersey:
12.3%
Students in private schools in grades 9 to 12 (high school): 116
Here:
10.5%
New Jersey:
13.1%
Students in private undergraduate colleges: 132
Here:
45.6%
New Jersey:
33.2%
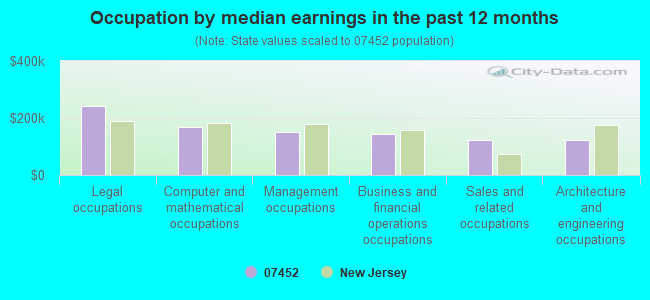
Occupation by median earnings in the past 12 months ($)
242,553Legal occupations
168,833Computer and mathematical occupations
151,635Management occupations
145,045Business and financial operations occupations
124,309Sales and related occupations
121,972Architecture and engineering occupations
Companies with federal contracts located in this zip code:
MVS USA, INC (175 ROCK ROAD in GLEN ROCK, NJ; small business) 500 employees, $0 revenue. Woman Owned Business: $1,021,607 in 8 contractsfrom 2001 to 2005
Contracts for ADP Telecommunications and Transmission Services, Communications Security Equipment and Components by Department of Defense, Defense Information Systems Agency, Army Signed by year:2000: $0; 2001: $168,000; 2002: $0; 2003: $827,915; 2004: $48,294; 2005: -$22,602; 2006: $0.
Biggest contracts:
$377,311 with Department of Defense for ADP Telecommunications and Transmission Services. Signed on 2003-09-30. Completion date: 2007-07-31.
$377,311, same as above.Signed on 2003-09-30. Completion date: 2007-07-31.
$84,000, same as above.Signed on 2001-03-31. Completion date: 2003-01-30.
$84,000, same as above.Signed on 2001-03-31. Completion date: 2003-01-30.
GRASSEY EQUIPMENT CO (432 GROVE ST in GLEN ROCK, NJ; small business)
$2,775 with Defense Logistics Agency for Safety and Rescue Equipment. Signed on 2005-11-03. Completion date: 2005-12-17.
Top industries in this zip code by the number of employees in 2005:
Wholesale Trade: Other Electronic Parts and Equipment Merchant Wholesalers (250-499 employees: 1 establishment, 1-4 employees: 3 establishments)
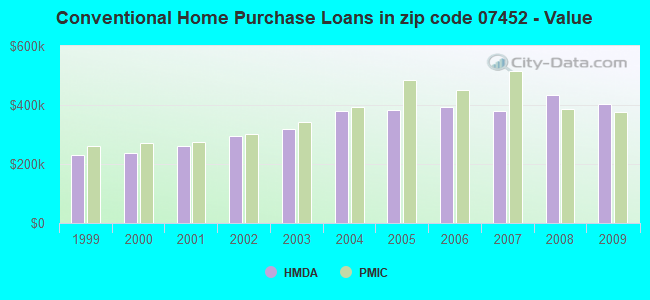
Detailed PMIC statistics for the following Tracts:0221.00
, 0222.00
2002 - 2018 National Fire Incident Reporting System (NFIRS) incidents
Based on the data from the years 2002 - 2018 the average number of fire incidents per year is 24. The highest number of reported fire incidents - 41 took place in 2015, and the least - 0 in 2003. The data has a growing trend.
When looking into fire subcategories, the most incidents belonged to: Structure Fires (66.4%), and Outside Fires (26.3%).
Fire incident types reported to NFIRS in Zip Code 07452


 Nearest zip codes: 07410, 07450, 07506, 07514, 07432, 07524.


 Based on the data from the years 2002 - 2018 the average number of fire incidents per year is 24. The highest number of reported fire incidents - 41 took place in 2015, and the least - 0 in 2003. The data has a growing trend.
 When looking into fire subcategories, the most incidents belonged to: Structure Fires (66.4%), and Outside Fires (26.3%).