Estimated zip code population in 2022: 3,030 Zip code population in 2010: 2,842 Zip code population in 2000: 2,298
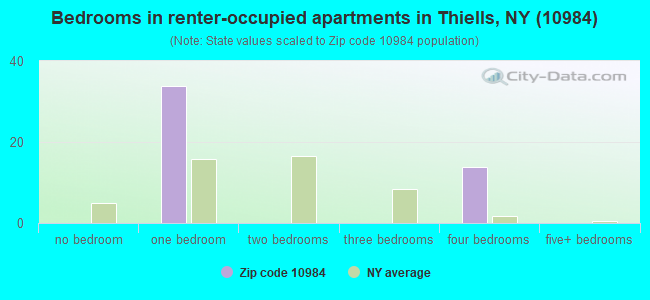
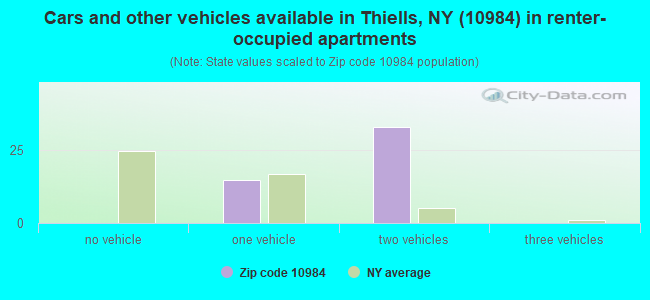
Houses and condos: 1,048 Renter-occupied apartments: 48
% of renters here:
5%
State:
46%
March 2022 cost of living index in zip code 10984: 121.4 (high, U.S. average is 100)
Land area: 1.6 sq. mi. Water area: 0.0 sq. mi.
Population density: 1,891 people per square mile
(low).
OSM Map
General Map
Google Map
MSN Map
OSM Map
General Map
Google Map
MSN Map
OSM Map
General Map
Google Map
MSN Map
OSM Map
General Map
Google Map
MSN Map
Please wait while loading the map...
Real estate property taxes paid for housing units in 2022:
This zip code:
2.0% ($9,805)
New York:
1.5% ($6,180)
Median real estate property taxes paid for housing units with mortgages in 2022: $9,858 (1.9%) Median real estate property taxes paid for housing units with no mortgage in 2022: $9,755 (2.0%)
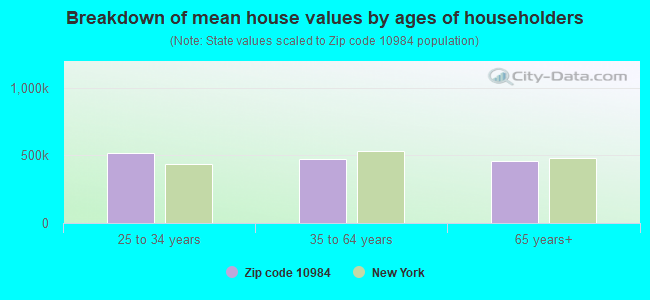
Estimated median house/condo value in 2022: $501,308
10984:
$501,308
New York:
$400,400
According to our research of New York and other state lists, there were 2 registered sex offenders living in 10984 zip code as of April 25, 2024. The ratio of all residents to sex offenders in zip code 10984 is 1,532 to 1. The ratio of registered sex offenders to all residents in this zip code is lower than the state average.
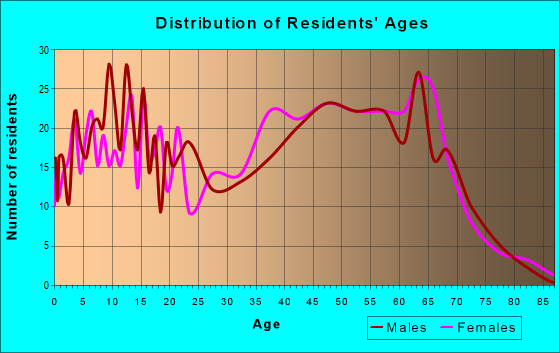
Median resident age:
This zip code:
38.3 years
New York median age:
40.0 years
Average household size:
This zip code:
2.8 people
New York:
2.5 people
Averages for the 2020 tax year for zip code 10984, filed in 2021:
Average Adjusted Gross Income (AGI) in 2020: $86,628 (Individual Income Tax Returns)
Here:
$86,628
State:
$90,930
Salary/wage: $72,258 (reported on 83.7% of returns)
Here:
$72,258
State:
$72,104
(% of AGI for various income ranges: 1097.0% for AGIs below $25k, 3194.0% for AGIs $25k-50k, 6624.3% for AGIs $50k-75k, 9381.0% for AGIs $75k-100k, 19077.1% for AGIs $100k-200k, 54135.0% for AGIs over 200k)
Taxable interest for individuals: $1,074 (reported on 45.9% of returns)
This zip code:
$1,074
New York:
$3,075
(% of AGI for various income ranges: 9.6% for AGIs below $25k, 19.5% for AGIs $25k-50k, 17.9% for AGIs $50k-75k, 28.0% for AGIs $75k-100k, 193.5% for AGIs $100k-200k, 557.5% for AGIs over 200k)
Ordinary dividends: $3,425 (reported on 26.7% of returns)
Here:
$3,425
State:
$11,095
(% of AGI for various income ranges: 15.7% for AGIs below $25k, 44.5% for AGIs $25k-50k, 27.9% for AGIs $50k-75k, 89.0% for AGIs $75k-100k, 355.3% for AGIs $100k-200k, 940.0% for AGIs over 200k)
Net capital gain/loss in AGI: +$6,581 (reported on 23.0% of returns)
Here:
+$6,581
State:
+$44,925
(% of AGI for various income ranges: 31.7% for AGIs below $25k, 15.0% for AGIs $25k-50k, 38.6% for AGIs $50k-75k, 159.0% for AGIs $75k-100k, 270.6% for AGIs $100k-200k, 3160.0% for AGIs over 200k)
Profit/loss from business: +$11,133 (reported on 13.3% of returns)
Here:
+$11,133
State:
+$14,940
(% of AGI for various income ranges: 128.7% for AGIs below $25k, 83.5% for AGIs $25k-50k, 170.0% for AGIs $50k-75k, 270.0% for AGIs $75k-100k, 148.8% for AGIs $100k-200k, 1950.0% for AGIs over 200k)
Taxable individual retirement arrangement distribution: $20,792 (reported on 8.9% of returns)
10984:
$20,792
New York:
$19,609
(% of AGI for various income ranges: 103.0% for AGIs below $25k, 300.0% for AGIs $50k-75k, 1081.2% for AGIs $100k-200k)
Total itemized deductions: $28,462 (reported on 17.8% of returns)
Here:
$28,462
State:
$39,326
(% of AGI for various income ranges: 465.0% for AGIs $25k-50k, 397.1% for AGIs $50k-75k, 1325.0% for AGIs $75k-100k, 1568.8% for AGIs $100k-200k, 3382.5% for AGIs over 200k)
Charity contributions: $4,864 (reported on 16.3% of returns)
Here:
$4,864
State:
$15,420
(% of AGI for various income ranges: 35.5% for AGIs $25k-50k, 59.3% for AGIs $50k-75k, 173.0% for AGIs $75k-100k, 278.8% for AGIs $100k-200k, 672.5% for AGIs over 200k)
Taxes paid: $9,862 (reported on 17.8% of returns)
10984:
$9,862
State:
$9,183
(% of AGI for various income ranges: 174.0% for AGIs $25k-50k, 154.3% for AGIs $50k-75k, 510.0% for AGIs $75k-100k, 523.5% for AGIs $100k-200k, 1007.5% for AGIs over 200k)
Earned income credit: $2,570 (reported on 7.4% of returns)
Here:
$2,570
State:
$2,138
(% of AGI for various income ranges: 60.0% for AGIs below $25k, 59.5% for AGIs $25k-50k)
Percentage of individuals using paid preparers for their 2020 taxes: 97.0%
Here:
97%
State:
95%
(% for various income ranges: 97.0% for AGIs below $25k, 96.0% for AGIs $25k-50k, 94.7% for AGIs $50k-75k, 100.0% for AGIs $75k-100k, 96.9% for AGIs $100k-200k, 100.0% for AGIs over 200k)
Averages for the 2012 tax year for zip code 10984, filed in 2013:
Average Adjusted Gross Income (AGI) in 2012: $79,285 (Individual Income Tax Returns)
Here:
$79,285
State:
$77,088
Salary/wage: $69,146 (reported on 86.0% of returns)
Here:
$69,146
State:
$60,593
(% of AGI for various income ranges: 72.1% for AGIs below $25k, 71.6% for AGIs $25k-50k, 72.4% for AGIs $50k-75k, 74.4% for AGIs $75k-100k, 75.7% for AGIs $100k-200k, 77.3% for AGIs over 200k)
Taxable interest for individuals: $748 (reported on 51.2% of returns)
This zip code:
$748
New York:
$3,125
(% of AGI for various income ranges: 1.0% for AGIs below $25k, 1.1% for AGIs $25k-50k, 0.5% for AGIs $50k-75k, 0.5% for AGIs $75k-100k, 0.4% for AGIs $100k-200k, 0.3% for AGIs over 200k)
Ordinary dividends: $2,117 (reported on 31.8% of returns)
Here:
$2,117
State:
$10,299
(% of AGI for various income ranges: 1.0% for AGIs below $25k, 1.1% for AGIs $25k-50k, 0.9% for AGIs $50k-75k, 0.8% for AGIs $75k-100k, 0.8% for AGIs $100k-200k, 0.8% for AGIs over 200k)
Profit/loss from business: +$9,765 (reported on 13.2% of returns)
Here:
+$9,765
State:
+$16,168
(% of AGI for various income ranges: 7.5% for AGIs below $25k, 3.0% for AGIs $25k-50k, 4.2% for AGIs $50k-75k, 1.5% for AGIs $100k-200k)
Taxable individual retirement arrangement distribution: $11,947 (reported on 11.6% of returns)
10984:
$11,947
New York:
$17,621
(% of AGI for various income ranges: 2.4% for AGIs below $25k, 3.2% for AGIs $25k-50k, 5.0% for AGIs $50k-75k, 2.0% for AGIs $100k-200k)
Total itemized deductions: $27,783 (24% of AGI, reported on 58.9% of returns)
Here:
$27,783
State:
$34,985
Here:
24.3% of AGI
State:
21.3% of AGI
(% of AGI for various income ranges: 16.5% for AGIs below $25k, 18.4% for AGIs $25k-50k, 21.4% for AGIs $50k-75k, 23.3% for AGIs $75k-100k, 22.1% for AGIs $100k-200k, 16.5% for AGIs over 200k)
Charity contributions: $2,419 (reported on 53.5% of returns)
Here:
$2,419
State:
$5,572
(% of AGI for various income ranges: 1.1% for AGIs below $25k, 1.3% for AGIs $25k-50k, 1.9% for AGIs $50k-75k, 2.0% for AGIs $75k-100k, 1.7% for AGIs $100k-200k, 1.3% for AGIs over 200k)
Taxes paid: $15,012 (reported on 58.1% of returns)
10984:
$15,012
State:
$18,656
(% of AGI for various income ranges: 6.3% for AGIs below $25k, 7.3% for AGIs $25k-50k, 9.8% for AGIs $50k-75k, 11.8% for AGIs $75k-100k, 12.3% for AGIs $100k-200k, 10.3% for AGIs over 200k)
Earned income credit: $1,760 (reported on 7.8% of returns)
Here:
$1,760
State:
$2,230
(% of AGI for various income ranges: 3.4% for AGIs below $25k, 0.5% for AGIs $25k-50k)
Percentage of individuals using paid preparers for their 2012 taxes: 70.5%
Here:
71%
State:
66%
(% for various income ranges: 61.8% for AGIs below $25k, 70.0% for AGIs $25k-50k, 72.2% for AGIs $50k-75k, 70.6% for AGIs $75k-100k, 75.8% for AGIs $100k-200k, 85.7% for AGIs over 200k)
Averages for the 2004 tax year for zip code 10984, filed in 2005:
Average Adjusted Gross Income (AGI) in 2004: $66,079 (Individual Income Tax Returns)
Here:
$66,079
State:
$59,519
Salary/wage: $60,439 (reported on 87.3% of returns)
Here:
$60,439
State:
$50,673
(% of AGI for various income ranges: 109.3% for AGIs below $10k, 68.4% for AGIs $10k-25k, 78.9% for AGIs $25k-50k, 82.1% for AGIs $50k-75k, 79.0% for AGIs $75k-100k, 80.1% for AGIs over 100k)
Taxable interest for individuals: $994 (reported on 68.2% of returns)
This zip code:
$994
New York:
$2,377
(% of AGI for various income ranges: 7.5% for AGIs below $10k, 2.5% for AGIs $10k-25k, 1.2% for AGIs $25k-50k, 1.6% for AGIs $50k-75k, 0.6% for AGIs $75k-100k, 0.8% for AGIs over 100k)
Taxable dividends: $1,256 (reported on 39.8% of returns)
Here:
$1,256
State:
$5,394
(% of AGI for various income ranges: 6.2% for AGIs below $10k, 0.9% for AGIs $10k-25k, 1.2% for AGIs $25k-50k, 0.7% for AGIs $50k-75k, 0.6% for AGIs $75k-100k, 0.6% for AGIs over 100k)
Net capital gain/loss: +$1,343 (reported on 26.4% of returns)
Here:
+$1,343
State:
+$23,581
(% of AGI for various income ranges: -4.7% for AGIs below $10k, 0.5% for AGIs $10k-25k, -0.4% for AGIs $25k-50k, 0.1% for AGIs $50k-75k, -0.1% for AGIs $75k-100k, 1.1% for AGIs over 100k)
Profit/loss from business: +$11,028 (reported on 14.3% of returns)
Here:
+$11,028
State:
+$13,809
(% of AGI for various income ranges: 8.0% for AGIs below $10k, 5.3% for AGIs $10k-25k, 4.0% for AGIs $25k-50k, 2.4% for AGIs $50k-75k, 0.8% for AGIs $75k-100k, 2.2% for AGIs over 100k)
IRA payment deduction: $3,762 (reported on 3.4% of returns)
10984:
$3,762
New York:
$3,115
Total itemized deductions: $22,565 (24% of AGI, reported on 59.4% of returns)
Here:
$22,565
State:
$25,864
Here:
23.9% of AGI
State:
21.9% of AGI
(% of AGI for various income ranges: 25.5% for AGIs below $10k, 16.8% for AGIs $10k-25k, 19.3% for AGIs $25k-50k, 21.7% for AGIs $50k-75k, 24.6% for AGIs $75k-100k, 19.0% for AGIs over 100k)
Charity contributions deductions: $2,740 (3% of AGI, reported on 57.4% of returns)
Here:
$2,740
State:
$4,439
Here:
2.9% of AGI
State:
3.6% of AGI
(% of AGI for various income ranges: 1.5% for AGIs below $10k, 1.6% for AGIs $10k-25k, 2.2% for AGIs $25k-50k, 2.6% for AGIs $50k-75k, 3.1% for AGIs $75k-100k, 2.2% for AGIs over 100k)
Total tax: $9,398 (reported on 85.1% of returns)
10984:
$9,398
State:
$11,730
(% of AGI for various income ranges: 3.5% for AGIs below $10k, 4.4% for AGIs $10k-25k, 8.3% for AGIs $25k-50k, 9.4% for AGIs $50k-75k, 8.8% for AGIs $75k-100k, 15.1% for AGIs over 100k)
Earned income credit: $1,250 (reported on 4.5% of returns)
Here:
$1,250
State:
$1,757
Percentage of individuals using paid preparers for their 2004 taxes: 72.5%
Here:
73%
State:
67%
(% for various income ranges: 62.6% for AGIs below $10k, 68.1% for AGIs $10k-25k, 73.3% for AGIs $25k-50k, 73.5% for AGIs $50k-75k, 76.0% for AGIs $75k-100k, 77.9% for AGIs over 100k)
Household received Food Stamps/SNAP in the past 12 months: 0 Household did not receive Food Stamps/SNAP in the past 12 months: 1,039
Women who had a birth in the past 12 months: 34 (34 now married, 0 unmarried) Women who did not have a birth in the past 12 months: 583 (267 now married, 312 unmarried)
Housing units in zip code 10984 with a mortgage: 567 (119 second mortgage, 66 both second mortgage and home equity loan) Houses without a mortgage: 31
Median monthly owner costs for units with a mortgage: $3,149 Median monthly owner costs for units without a mortgage: $1,487
Residents with income below the poverty level in 2022:
This zip code:
0.9%
Whole state:
14.3%
Residents with income below 50% of the poverty level in 2022:
This zip code:
0.2%
Whole state:
6.8%
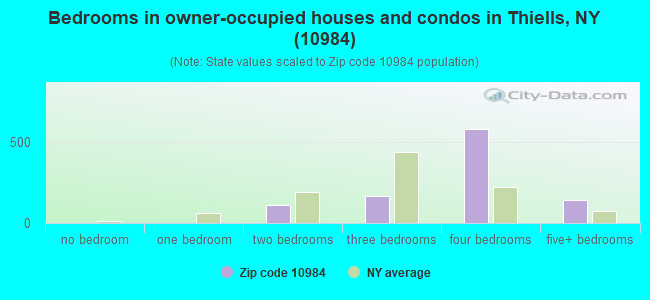
Median number of rooms in houses and condos:
Here:
7.7
State:
6.3
Notable locations in this zip code not listed on our city pages
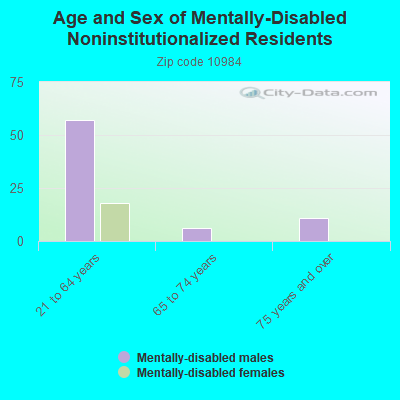
In group quarters: 68 (-1 institutionalized population)
Size of family households: 285 2-persons, 183 3-persons, 219 4-persons, 65 5-persons, 63 6-persons
Size of nonfamily households: 143 1-person, 87 2-persons
525 married couples with children.
0 single-parent households ().
78.4% of residents of 10984 zip code speak English at home.
14.9% of residents speak Spanish at home (92% very well, 6% well, 1% not well).
3.2% of residents speak other Indo-European language at home (67% very well, 33% not at all).
2.9% of residents speak Asian or Pacific Island language at home (58% very well, 16% well, 25% not well).
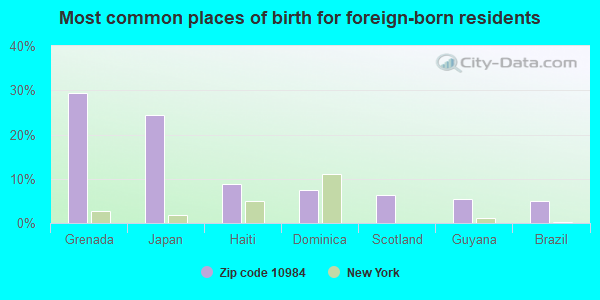
Foreign born population: 225 (7.4%) (58.3% of them are naturalized citizens)
This zip code:
7.4%
Whole state:
22.7%
29%Grenada
24%Japan
9%Haiti
8%Dominica
6%Scotland
5%Guyana
5%Brazil
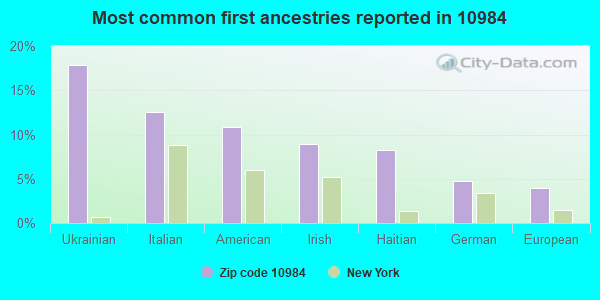
18%Ukrainian
13%Italian
11%American
9%Irish
8%Haitian
5%German
4%European
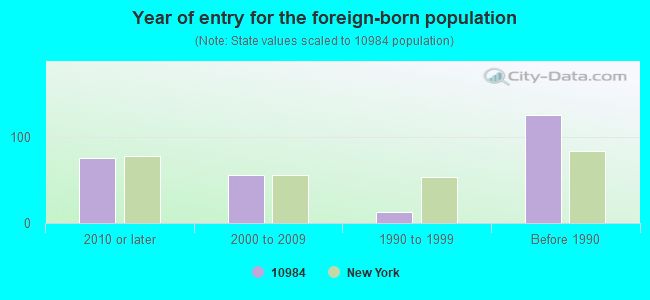
Year of entry for the foreign-born population
752010 or later
562000 to 2009
131990 to 1999
125Before 1990
Facilities with environmental interests located in this zip code:
GREEN MOUNTAIN CONDOMINIUM ASSOC (CRESCENT DR - CLUBHOUSE in THIELLS, NY)
(Resource Conservation and Recovery Act (tracking hazardous waste))
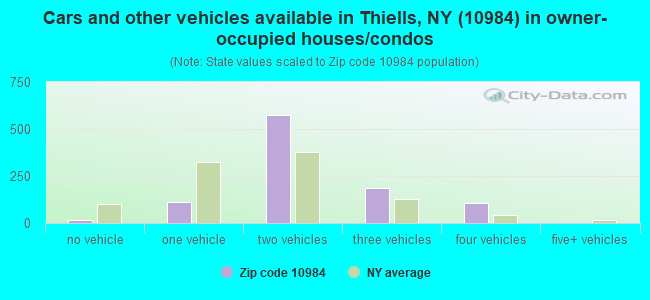
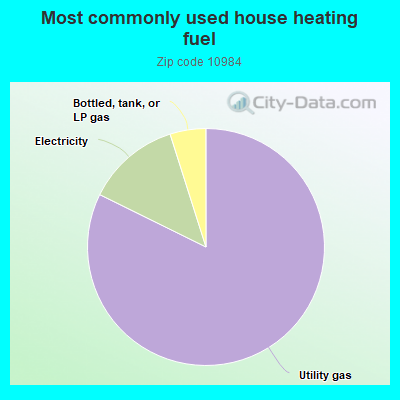
82.3%Utility gas
12.8%Electricity
4.9%Bottled, tank, or LP gas
Population in 1990: 3,971.
Place of birth for U.S.-born residents:
This state: 2,448
Northeast: 198
Midwest: 61
South: 42
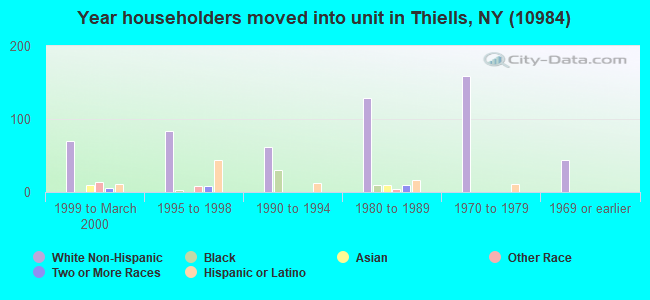
75% of the 10984 zip code residents lived in the same house 5 years ago. Out of people who lived in different houses, 69% lived in this county. Out of people who lived in different counties, 50% lived in New York.
93% of the 10984 zip code residents lived in the same house 1 year ago. Out of people who lived in different houses, 80% moved from this county. Out of people who lived in different houses, 16% moved from different county within same state.
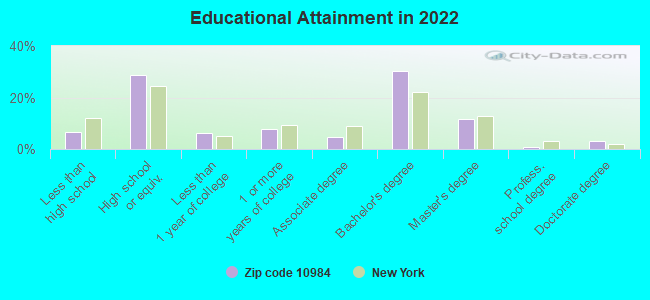
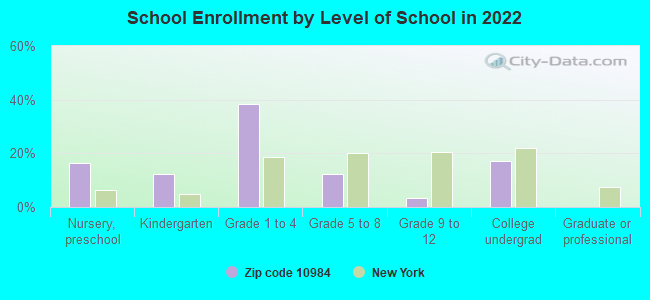
Private vs. public school enrollment:
Students in private schools in grades 1 to 8 (elementary and middle school): 33
Here:
12.6%
New York:
15.6%
Students in private schools in grades 9 to 12 (high school):
Here:
0.0%
New York:
15.0%
Students in private undergraduate colleges:
Here:
0.0%
New York:
39.2%
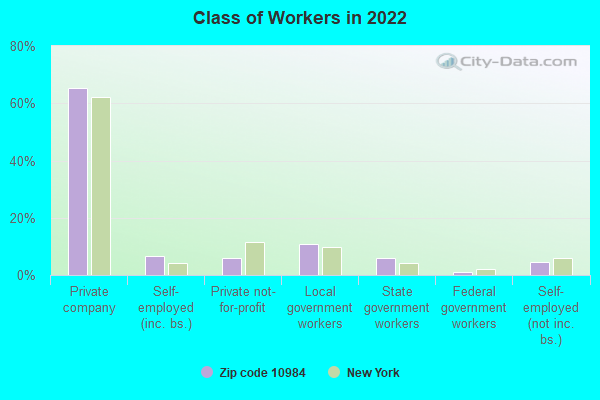
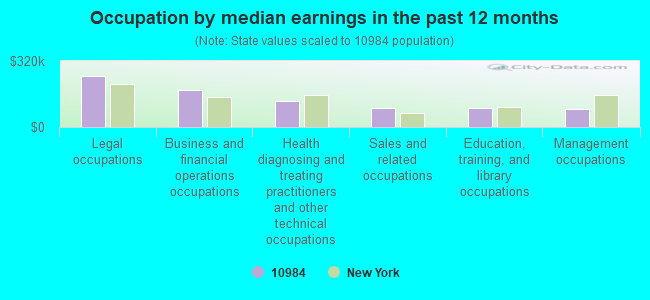
Occupation by median earnings in the past 12 months ($)
247,483Legal occupations
179,217Business and financial operations occupations
126,090Health diagnosing and treating practitioners and other technical occupations
94,320Sales and related occupations
94,100Education, training, and library occupations
85,336Management occupations
Top industries in this zip code by the number of employees in 2005:
Health Care and Social Assistance: Child Day Care Services (20-49 employees: 1 establishment, 10-19 employees: 1 establishment)
Management of Companies and Enterprises: Corporate, Subsidiary, and Regional Managing Offices (20-49: 1)
Other Services (except Public Administration): Professional Organizations (10-19: 1)
Educational Services: All Other Miscellaneous Schools and Instruction (10-19: 1)
Accommodation and Food Services: Full-Service Restaurants (5-9: 1)
Construction: Flooring Contractors (5-9: 1)
Construction: Electrical Contractors (5-9: 1)
Professional, Scientific, and Technical Services: Research and Development in the Physical, Engineering, and Life Sciences (5-9: 1)
People in group quarters in 2010:
25 people in group homes intended for adults
8 people in residential treatment centers for adults
People in group quarters in 2000:
57 people in homes for the mentally retarded
Fatal accident statistics in 2012:
Fatal accident count: 1
Vehicles involved in fatal accidents: 1
Fatal accidents caused by drunken drivers: 0
Fatalities: 1
Persons involved in fatal accidents: 3
Pedestrians involved in fatal accidents: 1
Home Mortgage Disclosure Act Aggregated Statistics For Year 2009 (Based on 2 partial tracts)
A) FHA, FSA/RHS & VA Home Purchase Loans
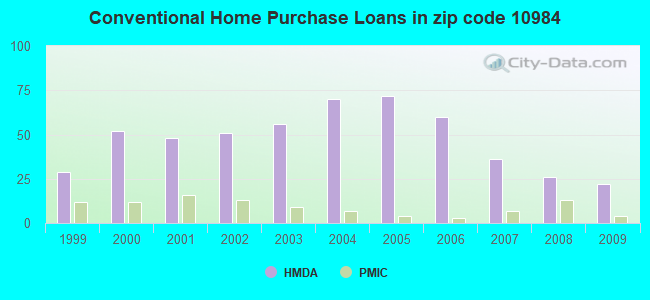
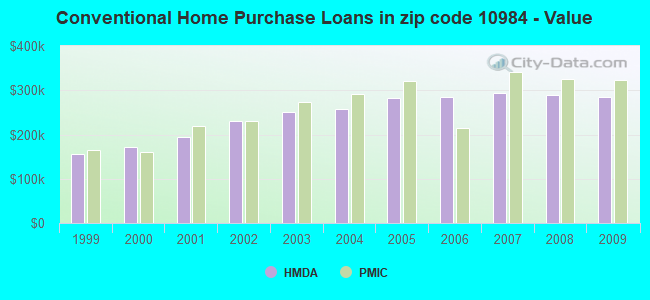
B) Conventional Home Purchase Loans
C) Refinancings
D) Home Improvement Loans
E) Loans on Dwellings For 5+ Families
F) Non-occupant Loans on < 5 Family Dwellings (A B C & D)
Number
Average Value
Number
Average Value
Number
Average Value
Number
Average Value
Number
Average Value
Number
Average Value
LOANS ORIGINATED
16
$353,696
22
$284,149
56
$255,926
5
$68,690
0
$0
2
$129,360
APPLICATIONS APPROVED, NOT ACCEPTED
0
$0
3
$314,903
7
$304,144
1
$7,290
1
$1,317,310
1
$296,070
APPLICATIONS DENIED
1
$268,750
1
$355,290
22
$298,932
3
$22,773
0
$0
0
$0
APPLICATIONS WITHDRAWN
0
$0
3
$238,073
21
$269,569
0
$0
0
$0
0
$0
FILES CLOSED FOR INCOMPLETENESS
1
$326,140
2
$129,360
10
$299,081
1
$36,440
0
$0
1
$54,660
Aggregated Statistics For Year 2008 (Based on 2 partial tracts)
A) FHA, FSA/RHS & VA Home Purchase Loans
B) Conventional Home Purchase Loans
C) Refinancings
D) Home Improvement Loans
F) Non-occupant Loans on < 5 Family Dwellings (A B C & D)
Number
Average Value
Number
Average Value
Number
Average Value
Number
Average Value
Number
Average Value
LOANS ORIGINATED
5
$375,332
26
$289,453
33
$245,335
8
$30,291
1
$81,990
APPLICATIONS APPROVED, NOT ACCEPTED
0
$0
5
$348,730
5
$195,682
2
$125,260
0
$0
APPLICATIONS DENIED
0
$0
7
$309,480
11
$306,841
5
$118,976
1
$91,100
APPLICATIONS WITHDRAWN
2
$196,775
5
$316,116
7
$370,256
1
$36,440
0
$0
FILES CLOSED FOR INCOMPLETENESS
0
$0
1
$464,610
6
$390,060
1
$91,100
0
$0
Aggregated Statistics For Year 2007 (Based on 2 partial tracts)
B) Conventional Home Purchase Loans
C) Refinancings
D) Home Improvement Loans
F) Non-occupant Loans on < 5 Family Dwellings (A B C & D)
Number
Average Value
Number
Average Value
Number
Average Value
Number
Average Value
LOANS ORIGINATED
36
$293,216
53
$238,905
7
$88,107
1
$72,880
APPLICATIONS APPROVED, NOT ACCEPTED
3
$354,380
17
$300,576
2
$83,810
1
$136,650
APPLICATIONS DENIED
17
$349,449
46
$296,907
9
$85,027
2
$177,645
APPLICATIONS WITHDRAWN
5
$418,332
13
$247,372
1
$34,620
2
$225,470
FILES CLOSED FOR INCOMPLETENESS
5
$196,958
7
$346,700
0
$0
0
$0
Aggregated Statistics For Year 2006 (Based on 2 partial tracts)
B) Conventional Home Purchase Loans
C) Refinancings
D) Home Improvement Loans
F) Non-occupant Loans on < 5 Family Dwellings (A B C & D)
G) Loans On Manufactured Home Dwelling (A B C & D)
Number
Average Value
Number
Average Value
Number
Average Value
Number
Average Value
Number
Average Value
LOANS ORIGINATED
60
$284,505
87
$263,823
24
$59,443
2
$279,220
0
$0
APPLICATIONS APPROVED, NOT ACCEPTED
7
$312,473
17
$198,598
5
$46,644
0
$0
0
$0
APPLICATIONS DENIED
13
$300,770
49
$285,738
17
$96,619
2
$108,865
1
$25,510
APPLICATIONS WITHDRAWN
15
$286,175
44
$253,092
6
$209,985
0
$0
0
$0
FILES CLOSED FOR INCOMPLETENESS
5
$274,210
7
$381,189
0
$0
0
$0
0
$0
Aggregated Statistics For Year 2005 (Based on 2 partial tracts)
A) FHA, FSA/RHS & VA Home Purchase Loans
B) Conventional Home Purchase Loans
C) Refinancings
D) Home Improvement Loans
F) Non-occupant Loans on < 5 Family Dwellings (A B C & D)
G) Loans On Manufactured Home Dwelling (A B C & D)
Number
Average Value
Number
Average Value
Number
Average Value
Number
Average Value
Number
Average Value
Number
Average Value
LOANS ORIGINATED
0
$0
72
$282,321
91
$248,042
22
$114,165
4
$206,798
0
$0
APPLICATIONS APPROVED, NOT ACCEPTED
0
$0
13
$296,285
28
$255,568
5
$28,788
4
$255,762
1
$153,050
APPLICATIONS DENIED
1
$207,710
21
$300,543
42
$297,897
8
$167,169
2
$352,100
1
$18,220
APPLICATIONS WITHDRAWN
0
$0
9
$315,914
62
$256,226
6
$116,457
2
$278,765
0
$0
FILES CLOSED FOR INCOMPLETENESS
0
$0
5
$349,642
13
$303,643
2
$53,750
0
$0
0
$0
Aggregated Statistics For Year 2004 (Based on 2 partial tracts)
B) Conventional Home Purchase Loans
C) Refinancings
D) Home Improvement Loans
E) Loans on Dwellings For 5+ Families
F) Non-occupant Loans on < 5 Family Dwellings (A B C & D)
G) Loans On Manufactured Home Dwelling (A B C & D)
Number
Average Value
Number
Average Value
Number
Average Value
Number
Average Value
Number
Average Value
Number
Average Value
LOANS ORIGINATED
70
$257,136
108
$231,790
20
$48,738
1
$182,200
4
$134,372
2
$36,440
APPLICATIONS APPROVED, NOT ACCEPTED
9
$244,047
15
$265,708
5
$96,020
0
$0
1
$258,720
0
$0
APPLICATIONS DENIED
10
$249,432
49
$218,138
15
$87,091
0
$0
2
$171,725
1
$63,770
APPLICATIONS WITHDRAWN
8
$303,705
56
$234,924
5
$60,308
0
$0
1
$173,090
0
$0
FILES CLOSED FOR INCOMPLETENESS
2
$180,380
7
$303,363
3
$47,980
0
$0
0
$0
0
$0
Aggregated Statistics For Year 2003 (Based on 2 partial tracts)
A) FHA, FSA/RHS & VA Home Purchase Loans
B) Conventional Home Purchase Loans
C) Refinancings
D) Home Improvement Loans
F) Non-occupant Loans on < 5 Family Dwellings (A B C & D)
Number
Average Value
Number
Average Value
Number
Average Value
Number
Average Value
Number
Average Value
LOANS ORIGINATED
2
$250,980
56
$250,574
260
$194,148
12
$79,485
3
$182,200
APPLICATIONS APPROVED, NOT ACCEPTED
0
$0
6
$269,048
33
$174,332
4
$16,170
1
$154,870
APPLICATIONS DENIED
0
$0
6
$257,205
56
$219,714
11
$65,924
1
$150,320
APPLICATIONS WITHDRAWN
0
$0
6
$220,613
41
$220,795
2
$25,510
1
$150,320
FILES CLOSED FOR INCOMPLETENESS
0
$0
2
$249,160
12
$201,635
0
$0
0
$0
Aggregated Statistics For Year 2002 (Based on 2 partial tracts)
B) Conventional Home Purchase Loans
C) Refinancings
D) Home Improvement Loans
F) Non-occupant Loans on < 5 Family Dwellings (A B C & D)
Number
Average Value
Number
Average Value
Number
Average Value
Number
Average Value
LOANS ORIGINATED
51
$231,162
154
$176,018
15
$36,865
1
$182,200
APPLICATIONS APPROVED, NOT ACCEPTED
7
$267,443
15
$152,805
5
$60,490
1
$92,920
APPLICATIONS DENIED
2
$168,990
31
$183,699
1
$9,110
0
$0
APPLICATIONS WITHDRAWN
8
$195,181
38
$176,806
3
$38,263
0
$0
FILES CLOSED FOR INCOMPLETENESS
2
$189,945
7
$223,586
1
$40,990
0
$0
Aggregated Statistics For Year 2001 (Based on 2 partial tracts)
A) FHA, FSA/RHS & VA Home Purchase Loans
B) Conventional Home Purchase Loans
C) Refinancings
D) Home Improvement Loans
E) Loans on Dwellings For 5+ Families
F) Non-occupant Loans on < 5 Family Dwellings (A B C & D)
Number
Average Value
Number
Average Value
Number
Average Value
Number
Average Value
Number
Average Value
Number
Average Value
LOANS ORIGINATED
2
$219,095
48
$194,309
96
$152,668
10
$37,442
1
$191,310
3
$75,917
APPLICATIONS APPROVED, NOT ACCEPTED
0
$0
3
$151,833
18
$172,888
5
$60,490
0
$0
0
$0
APPLICATIONS DENIED
0
$0
7
$162,679
20
$142,526
5
$75,796
0
$0
0
$0
APPLICATIONS WITHDRAWN
0
$0
5
$267,288
30
$151,044
8
$47,486
0
$0
0
$0
FILES CLOSED FOR INCOMPLETENESS
0
$0
2
$148,950
7
$182,590
0
$0
0
$0
0
$0
Aggregated Statistics For Year 2000 (Based on 2 partial tracts)
A) FHA, FSA/RHS & VA Home Purchase Loans
B) Conventional Home Purchase Loans
C) Refinancings
D) Home Improvement Loans
F) Non-occupant Loans on < 5 Family Dwellings (A B C & D)
Number
Average Value
Number
Average Value
Number
Average Value
Number
Average Value
Number
Average Value
LOANS ORIGINATED
1
$170,360
52
$171,653
19
$138,904
20
$47,600
1
$102,940
APPLICATIONS APPROVED, NOT ACCEPTED
0
$0
5
$210,440
9
$118,228
8
$38,376
0
$0
APPLICATIONS DENIED
0
$0
13
$151,156
13
$92,782
3
$18,827
0
$0
APPLICATIONS WITHDRAWN
2
$65,590
4
$147,582
29
$109,917
5
$47,372
0
$0
FILES CLOSED FOR INCOMPLETENESS
0
$0
0
$0
6
$180,227
0
$0
0
$0
Aggregated Statistics For Year 1999 (Based on 3 partial tracts)
B) Conventional Home Purchase Loans
C) Refinancings
D) Home Improvement Loans
E) Loans on Dwellings For 5+ Families
F) Non-occupant Loans on < 5 Family Dwellings (A B C & D)
Detailed PMIC statistics for the following Tracts:0105.01
2002 - 2018 National Fire Incident Reporting System (NFIRS) incidents
Based on the data from the years 2002 - 2018 the average number of fires per year is 10. The highest number of fire incidents - 26 took place in 2014, and the least - 1 in 2004. The data has a declining trend.
When looking into fire subcategories, the most reports belonged to: Structure Fires (56.8%), and Outside Fires (25.3%).
Fire incident types reported to NFIRS in Zip Code 10984
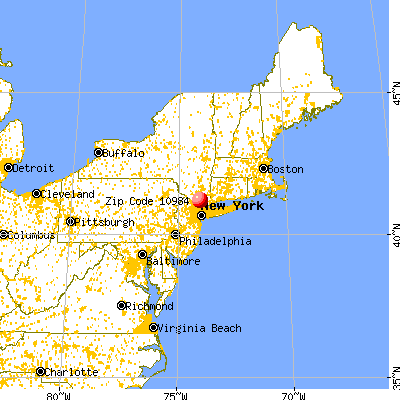


 Nearest zip codes: 10923, 10980, 10993, 10956, 10927, 10970.
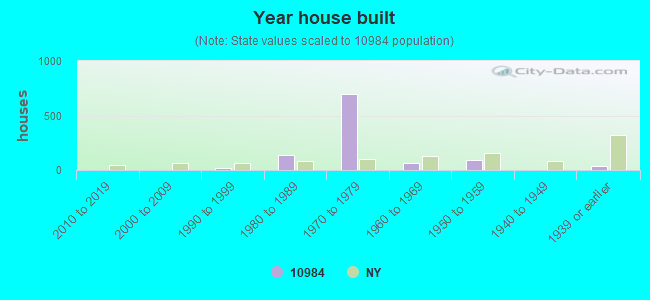


 Based on the data from the years 2002 - 2018 the average number of fires per year is 10. The highest number of fire incidents - 26 took place in 2014, and the least - 1 in 2004. The data has a declining trend.
 When looking into fire subcategories, the most reports belonged to: Structure Fires (56.8%), and Outside Fires (25.3%).