Estimated zip code population in 2022: 575 Zip code population in 2010: 793 Zip code population in 2000: 666
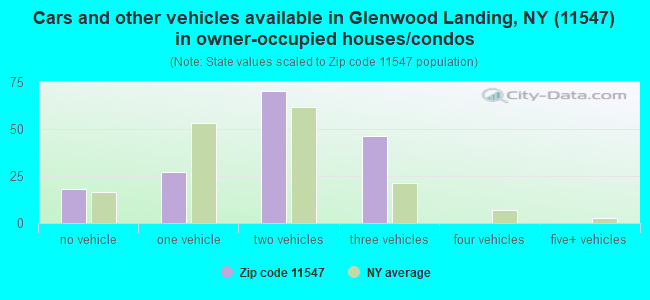
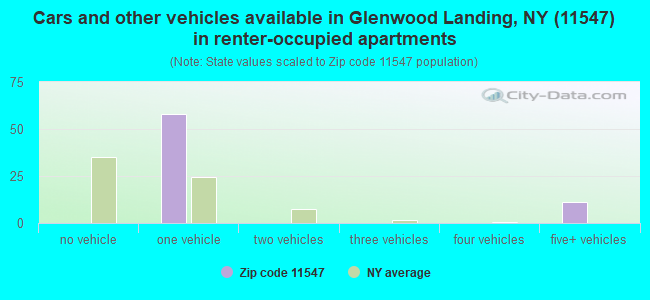
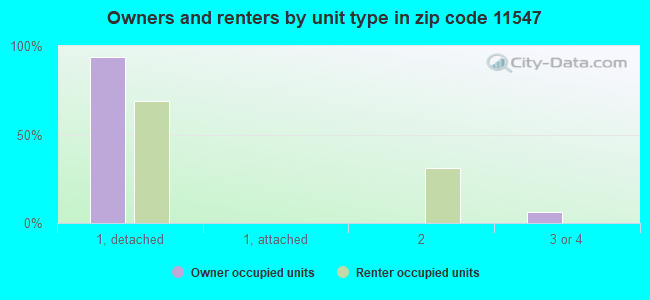
Houses and condos: 229 Renter-occupied apartments: 68
% of renters here:
30%
State:
46%
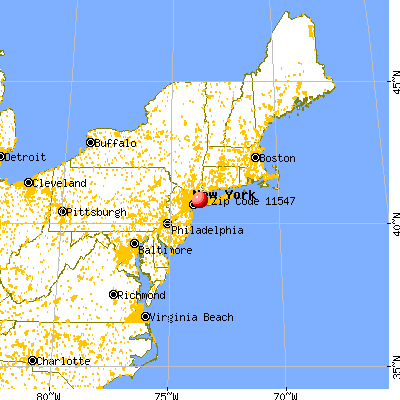
March 2022 cost of living index in zip code 11547: 147.5 (very high, U.S. average is 100)
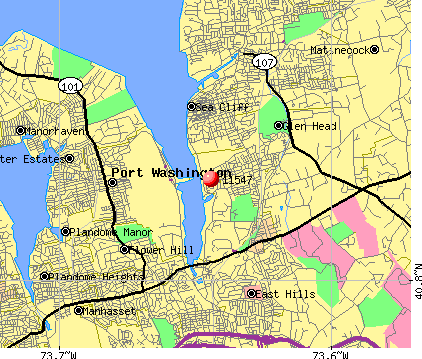
Land area: 0.4 sq. mi. Water area: 0.0 sq. mi.
Population density: 1,322 people per square mile
(low).
OSM Map
General Map
Google Map
MSN Map
OSM Map
General Map
Google Map
MSN Map
OSM Map
General Map
Google Map
MSN Map
OSM Map
General Map
Google Map
MSN Map
Please wait while loading the map...
Real estate property taxes paid for housing units in 2022:
This zip code:
1.1% ($9,805)
New York:
1.5% ($6,180)
Median real estate property taxes paid for housing units with mortgages in 2022: $9,858 (1.0%) Median real estate property taxes paid for housing units with no mortgage in 2022: $9,755 (1.1%)
Business Search- 14 Million verified businesses
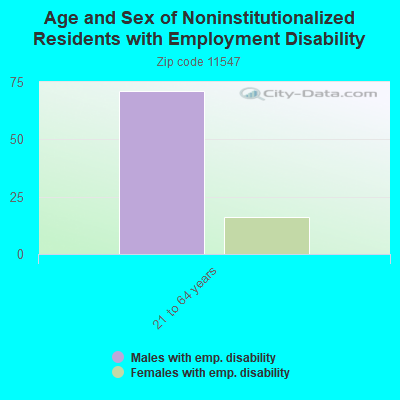
Males: 272
(47.4%)
Females: 303
(52.6%)
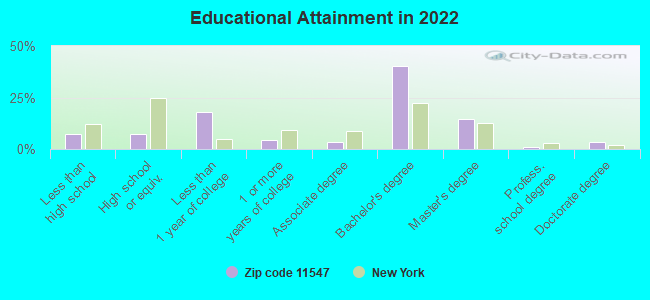
For population 25 years and over in 11547:
High school or higher: 94.2%
Bachelor's degree or higher: 59.6%
Graduate or professional degree: 19.4%
Mean travel time to work (commute): 36.7 minutes
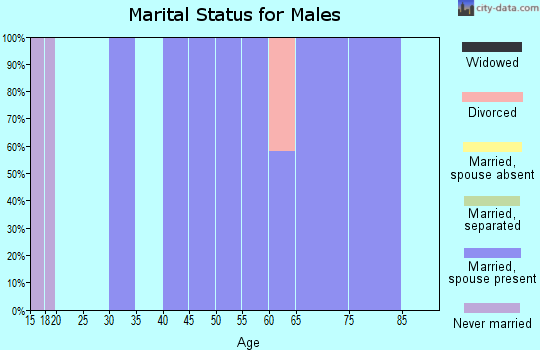
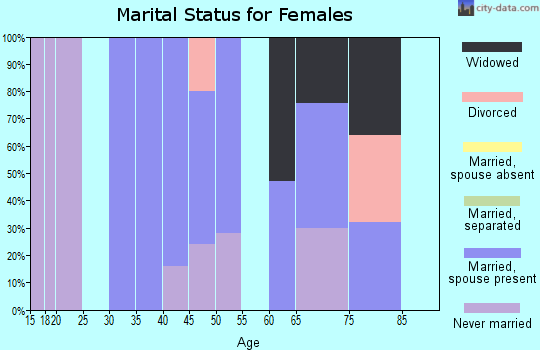
For population 15 years and over in 11547:
Never married: 28.7%
Now married: 49.8%
Separated: 0.0%
Widowed: 3.7%
Divorced: 17.8%
Zip code 11547 compared to state average:
Median household income significantly below state average.
Median house value significantly above state average.
Unemployed percentage significantly below state average.
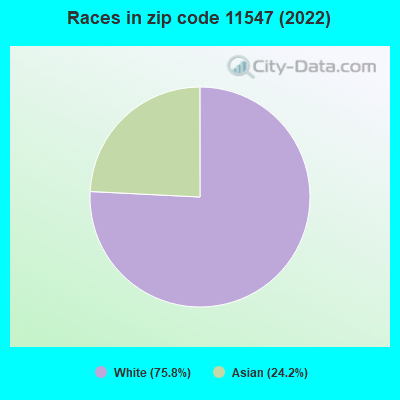
Black race population percentage significantly below state average.
Hispanic race population percentage significantly below state average.
Median age significantly above state average.
Foreign-born population percentage below state average.
Renting percentage below state average.
Length of stay since moving in significantly above state average.
Number of rooms per house above state average.
Number of college students above state average.
Percentage of population with a bachelor's degree or higher above state average.
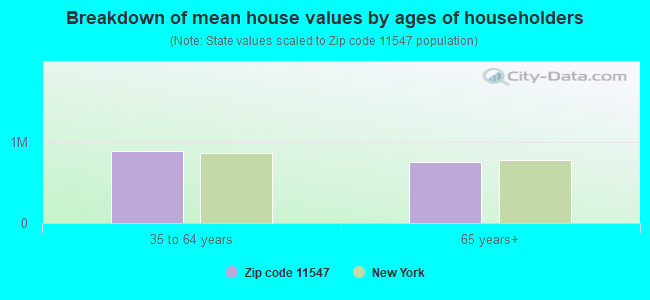
Estimated median house/condo value in 2022: $925,163
11547:
$925,163
New York:
$400,400
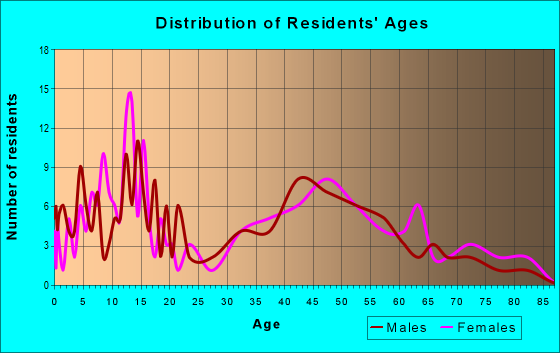
Median resident age:
This zip code:
48.2 years
New York median age:
40.0 years
Average household size:
This zip code:
2.5 people
New York:
2.5 people
Averages for the 2004 tax year for zip code 11547, filed in 2005:
Average Adjusted Gross Income (AGI) in 2004: $66,527 (Individual Income Tax Returns)
Here:
$66,527
State:
$59,519
Salary/wage: $61,536 (reported on 79.8% of returns)
Here:
$61,536
State:
$50,673
(% of AGI for various income ranges: 59.7% for AGIs below $10k, 65.3% for AGIs $10k-25k, 73.4% for AGIs $25k-50k, 73.4% for AGIs $50k-75k, 84.5% for AGIs $75k-100k, 71.6% for AGIs over 100k)
Taxable interest for individuals: $1,553 (reported on 70.7% of returns)
This zip code:
$1,553
New York:
$2,377
(% of AGI for various income ranges: 9.3% for AGIs below $10k, 3.6% for AGIs $10k-25k, 3.3% for AGIs $25k-50k, 2.2% for AGIs $50k-75k, 0.6% for AGIs $75k-100k, 1.1% for AGIs over 100k)
Taxable dividends: $3,005 (reported on 41.5% of returns)
Here:
$3,005
State:
$5,394
(% of AGI for various income ranges: 8.4% for AGIs below $10k, 0.6% for AGIs $10k-25k, 0.8% for AGIs $25k-50k, 2.1% for AGIs $50k-75k, 1.1% for AGIs $75k-100k, 2.3% for AGIs over 100k)
Net capital gain/loss: +$4,910 (reported on 32.0% of returns)
Here:
+$4,910
State:
+$23,581
(% of AGI for various income ranges: -4.4% for AGIs below $10k, -0.2% for AGIs $25k-50k, 0.1% for AGIs $50k-75k, -0.3% for AGIs $75k-100k, 4.8% for AGIs over 100k)
Profit/loss from business: +$17,638 (reported on 14.3% of returns)
Here:
+$17,638
State:
+$13,809
(% of AGI for various income ranges: 12.3% for AGIs $10k-25k, 4.0% for AGIs $25k-50k, 2.7% for AGIs $50k-75k, 4.7% for AGIs over 100k)
IRA payment deduction: $3,143 (reported on 5.8% of returns)
11547:
$3,143
New York:
$3,115
Total itemized deductions: $24,413 (25% of AGI, reported on 54.5% of returns)
Here:
$24,413
State:
$25,864
Here:
25.2% of AGI
State:
21.9% of AGI
(% of AGI for various income ranges: 24.4% for AGIs $10k-25k, 18.7% for AGIs $25k-50k, 18.7% for AGIs $50k-75k, 25.6% for AGIs $75k-100k, 19.1% for AGIs over 100k)
Charity contributions deductions: $2,506 (3% of AGI, reported on 51.4% of returns)
Here:
$2,506
State:
$4,439
Here:
2.5% of AGI
State:
3.6% of AGI
(% of AGI for various income ranges: 1.1% for AGIs $10k-25k, 1.7% for AGIs $25k-50k, 1.8% for AGIs $50k-75k, 2.1% for AGIs $75k-100k, 2.1% for AGIs over 100k)
Total tax: $9,734 (reported on 85.5% of returns)
11547:
$9,734
State:
$11,730
(% of AGI for various income ranges: 4.0% for AGIs below $10k, 4.5% for AGIs $10k-25k, 8.0% for AGIs $25k-50k, 9.8% for AGIs $50k-75k, 9.5% for AGIs $75k-100k, 16.1% for AGIs over 100k)
Earned income credit: $1,625 (reported on 6.6% of returns)
Here:
$1,625
State:
$1,757
Percentage of individuals using paid preparers for their 2004 taxes: 74.2%
Here:
74%
State:
67%
(% for various income ranges: 65.6% for AGIs below $10k, 63.1% for AGIs $10k-25k, 67.5% for AGIs $25k-50k, 80.9% for AGIs $50k-75k, 82.1% for AGIs $75k-100k, 83.8% for AGIs over 100k)
Household received Food Stamps/SNAP in the past 12 months: 0 Household did not receive Food Stamps/SNAP in the past 12 months: 227
Women who did not have a birth in the past 12 months: 94 (64 now married, 28 unmarried)
Housing units in zip code 11547 with a mortgage: 105 (26 second mortgage, 26 both second mortgage and home equity loan) Median monthly owner costs for units with a mortgage: $3,786 Median monthly owner costs for units without a mortgage: $1,418
Residents with income below the poverty level in 2022:
This zip code:
7.8%
Whole state:
14.3%
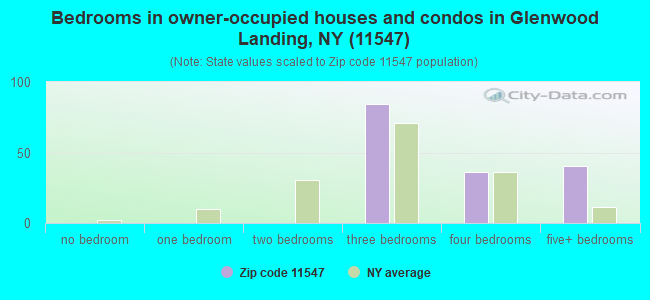
Median number of rooms in houses and condos:
Here:
8.1
State:
6.3
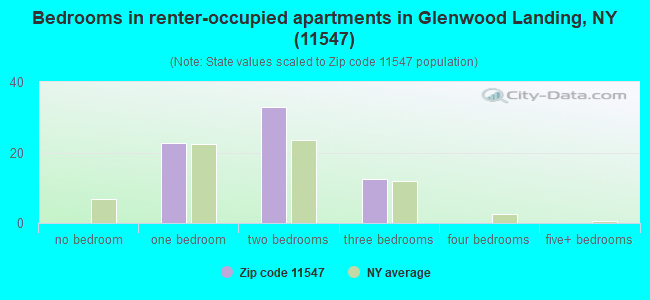
Median number of rooms in apartments:
Here:
4.8
State:
3.8
Notable locations in this zip code not listed on our city pages
Size of family households: 28 2-persons, 60 3-persons, 15 4-persons, 26 5-persons
Size of nonfamily households: 86 1-person, 11 5-persons
101 married couples with children.
0 single-parent households ().
87.5% of residents of 11547 zip code speak English at home.
5.4% of residents speak other Indo-European language at home (74% very well, 26% well).
7.5% of residents speak Asian or Pacific Island language at home (100% very well).
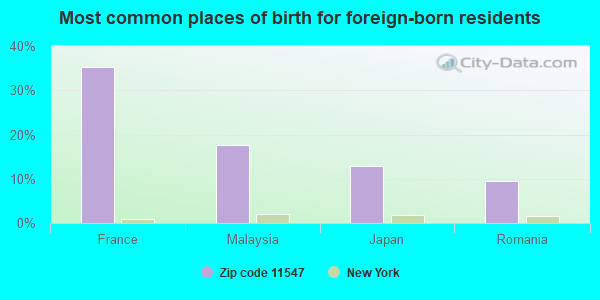
Foreign born population: 85 (14.9%) (81.0% of them are naturalized citizens)
This zip code:
14.9%
Whole state:
22.7%
35%France
18%Malaysia
13%Japan
9%Romania
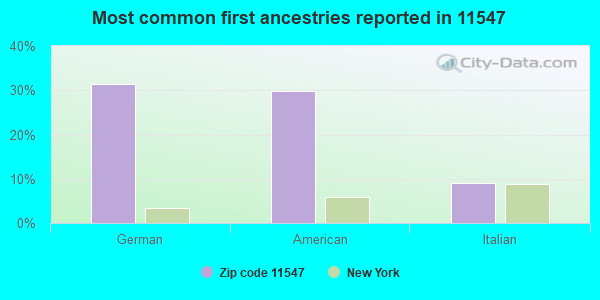
31%German
30%American
9%Italian
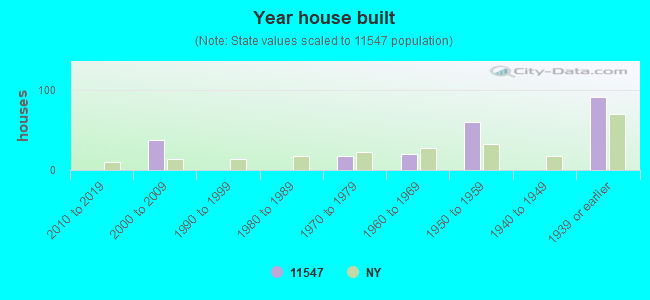
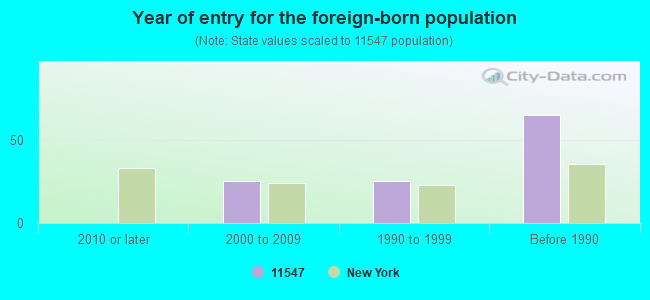
Year of entry for the foreign-born population
02010 or later
252000 to 2009
251990 to 1999
65Before 1990
Facilities with environmental interests located in this zip code:
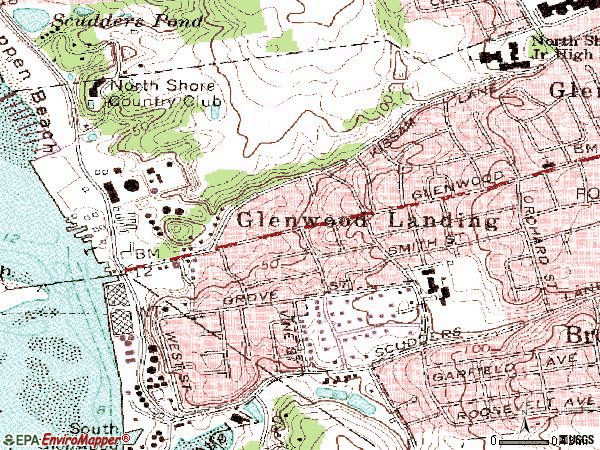
GLENWOOD LANDING ENERGY CENTER (SHORE ROAD in GLENWOOD LANDING, NY)
AIR MAJOR (AIRS/AFS) AIR SYNTHETIC MINOR (AIRS/AFS) AIR PROGRAM (Clean Air Markets Division Business System) STATE MASTER (New York facility tracking) - SECTION 404 PERMITTING, 401 CERTIFICATION, AIR PROGRAM, AIR MAJOR, National Pollutant Discharge Elimination System Permit, AIR PROGRAM, HAZARDOUS WASTE PROGRAM, AIR PROGRAM STATE MASTER (New York facility tracking) - AIR PROGRAM, National Pollutant Discharge Elimination System Permit, GROUNDWATER PROGRAM, AIR PROGRAM, AIR MAJOR, National Pollutant Discharge Elimination System Permit, HAZARDOUS WASTE PROGRAM STATE MASTER (New York facility tracking) - AIR PROGRAM, OIL CONTROL (Facility Response Plan for oil discharge) ENFORCEMENT/COMPLIANCE ACTIVITY (Integrated Compliance Information System) CRITERIA AND HAZARDOUS AIR POLLUTANT INVENTORY (Inventory of air pollution sources) National Pollutant Discharge Elimination System NON-MAJOR (Tracking pollutant discharge elimination systems) - permit National Pollutant Discharge Elimination System MAJOR (Tracking pollutant discharge elimination systems) - permit HAZARDOUS WASTE BIENNIAL REPORTER (Resource Conservation and Recovery Act (tracking hazardous waste)) Large Quantity Generators, more that 1000 kg of hazardous waste/month (Resource Conservation and Recovery Act (tracking hazardous waste)) Large Quantity Generators, more that 1000 kg of hazardous waste/month (Resource Conservation and Recovery Act (tracking hazardous waste)) TRI REPORTER (Tracking of toxic chemicals releasing facilities) Business SIC classification: ELECTRIC SERVICES; COMBINATION UTILITIES Business NAICS classification: FOSSIL FUEL ELECTRIC POWER GENERATION.; FOSSIL FUEL ELECTRIC POWER GENERATION. Organizations: GLENWOOD TERMINAL CORPORATION (CONTACT/GENERAL)
, KEYSPAN ENERGY CORP. (CONTACT/GENERAL)
, KEYSPAN ENERGY CORP (CONTACT/OWNER)
, KEYSPAN GENRATION, LLC (CONTACT/OWNER)
, LONG ISLAND LIGHTING CO (LEGALLY RESPONSIBLE PARTY)
, KEYSPAN ENERGY CORP (LEGALLY RESPONSIBLE PARTY)
, KEYSPAN ENERGY DEVELOPMENT CORP (LEGALLY RESPONSIBLE PARTY)
, KEYSPAN-GLENWOOD ENERGY CENTER LLC (LEGALLY RESPONSIBLE PARTY)
, KEYSPAN GENERATION, LLC (OWNER/OPERATOR)
Alternative names: GLENWOOD BLACK START GT FACILITY, GLENWOOD GAS FACILITY, GLENWOOD GAS PLANT, GLENWOOD GAS TURBINE SITE , GLENWOOD LANDING TERMINAL , GLENWOOD MAIN POWER STATION, GLENWOOD POWER STATION, KEYSPAN ENERGY ENVIRONMENTAL ENG., KEYSPAN ENERGY GLENWOOD LANDING ENERGY CENTER, KEYSPAN - GLENWOOD POWER STA, KEYSPAN SYSTEM LABORATORY
APPLIED ENVIRONMENTAL SERVICES (1 SHORE ROAD in GLENWOOD LANDING, NY)
SUPERFUND NPL (Superfund database) (Integrated Compliance Information System) - ICIS-02-1993-0258, FORMAL ENFORCEMENT ACTION, ICIS-02-1992-0273, ICIS-02-1992-0274, TRANSPORTER (Resource Conservation and Recovery Act (tracking hazardous waste)) TSD (Resource Conservation and Recovery Act (tracking hazardous waste)) Alternative names: PHILIPS PETROLEUM CO, SHORE REALTY
GLENWOOD GAS PLANT (SHORE RD in OYSTER BAY, NY)
CRITERIA AND HAZARDOUS AIR POLLUTANT INVENTORY (Inventory of air pollution sources) Business SIC classification: ELECTRIC SERVICES
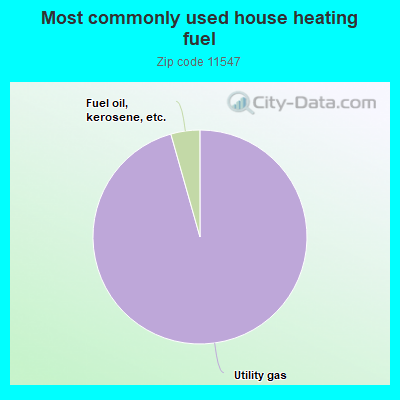
96.0%Utility gas
4.4%Fuel oil, kerosene, etc.
Place of birth for U.S.-born residents:
This state: 383
Northeast: 27
South: 27
West: 13
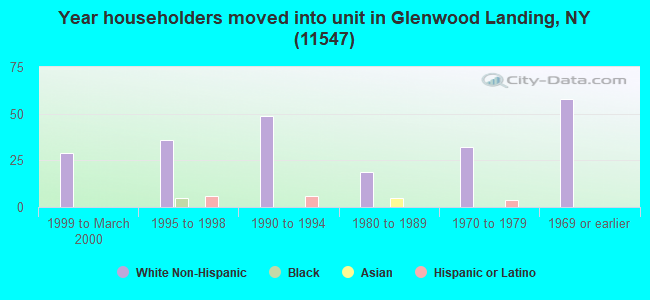
67% of the 11547 zip code residents lived in the same house 5 years ago. Out of people who lived in different houses, 46% lived in this county. Out of people who lived in different counties, 50% lived in New York.
94% of the 11547 zip code residents lived in the same house 1 year ago. Out of people who lived in different houses, 104% moved from different state.
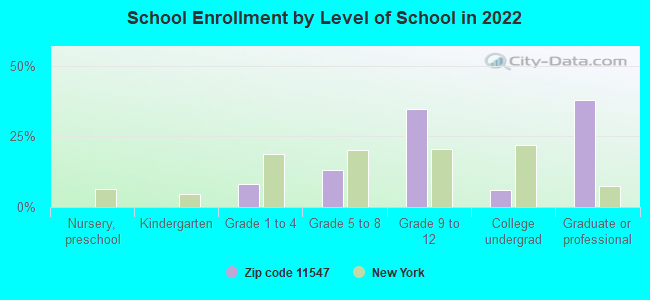
Private vs. public school enrollment:
Students in private schools in grades 1 to 8 (elementary and middle school):
Here:
0.0%
New York:
15.6%
Students in private schools in grades 9 to 12 (high school): 34
Here:
51.6%
New York:
15.0%
Students in private undergraduate colleges:
Here:
0.0%
New York:
39.2%
Top industries in this zip code by the number of employees in 2005:
Utilities: Electric Power Distribution (50-99 employees: 1 establishment, 5-9 employees: 1 establishment, 1-4 employees: 2 establishments)
Accommodation and Food Services: Caterers (50-99: 1)
Finance and Insurance: Securities Brokerage (10-19: 1, 5-9: 1)
Wholesale Trade: Petroleum Bulk Stations and Terminals (10-19: 1)
Management of Companies and Enterprises: Corporate, Subsidiary, and Regional Managing Offices (5-9: 1)
Construction: Electrical Contractors (5-9: 1)
Real Estate and Rental and Leasing: Lessors of Residential Buildings and Dwellings (1-4: 2)
Wholesale Trade: Other Miscellaneous Nondurable Goods Merchant Wholesalers (1-4: 2)
Home Mortgage Disclosure Act Aggregated Statistics For Year 2009 (Based on 2 partial tracts)
A) FHA, FSA/RHS & VA Home Purchase Loans
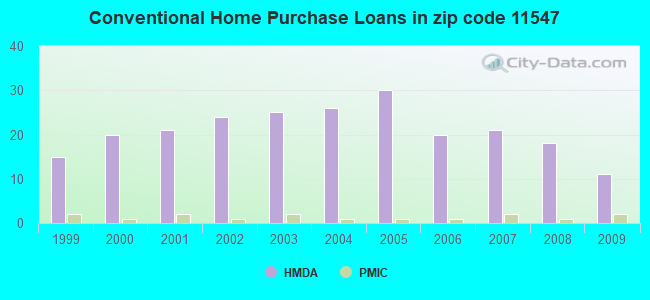
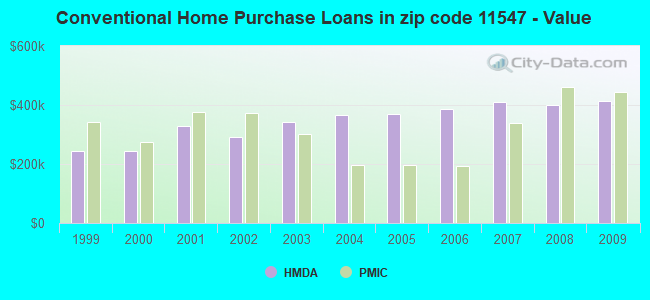
B) Conventional Home Purchase Loans
C) Refinancings
D) Home Improvement Loans
F) Non-occupant Loans on < 5 Family Dwellings (A B C & D)
Number
Average Value
Number
Average Value
Number
Average Value
Number
Average Value
Number
Average Value
LOANS ORIGINATED
1
$524,360
11
$413,701
41
$317,006
2
$177,635
2
$370,690
APPLICATIONS APPROVED, NOT ACCEPTED
1
$193,330
2
$252,265
3
$273,563
1
$206,550
0
$0
APPLICATIONS DENIED
1
$306,240
3
$521,423
10
$398,394
2
$221,145
1
$229,680
APPLICATIONS WITHDRAWN
2
$373,720
1
$545,290
12
$292,704
1
$261,630
0
$0
FILES CLOSED FOR INCOMPLETENESS
0
$0
1
$352,510
4
$489,800
0
$0
0
$0
Aggregated Statistics For Year 2008 (Based on 2 partial tracts)
A) FHA, FSA/RHS & VA Home Purchase Loans
B) Conventional Home Purchase Loans
C) Refinancings
D) Home Improvement Loans
F) Non-occupant Loans on < 5 Family Dwellings (A B C & D)
Number
Average Value
Number
Average Value
Number
Average Value
Number
Average Value
Number
Average Value
LOANS ORIGINATED
1
$271,540
18
$400,217
10
$334,666
3
$95,103
1
$355,820
APPLICATIONS APPROVED, NOT ACCEPTED
1
$275,400
1
$229,680
2
$407,865
1
$220,320
1
$129,990
APPLICATIONS DENIED
0
$0
2
$413,375
12
$402,910
3
$172,033
0
$0
APPLICATIONS WITHDRAWN
0
$0
1
$273,200
4
$345,352
1
$22,030
0
$0
FILES CLOSED FOR INCOMPLETENESS
0
$0
2
$508,665
1
$275,400
0
$0
0
$0
Aggregated Statistics For Year 2007 (Based on 2 partial tracts)
B) Conventional Home Purchase Loans
C) Refinancings
D) Home Improvement Loans
F) Non-occupant Loans on < 5 Family Dwellings (A B C & D)
Number
Average Value
Number
Average Value
Number
Average Value
Number
Average Value
LOANS ORIGINATED
21
$409,376
28
$392,071
3
$194,250
2
$441,190
APPLICATIONS APPROVED, NOT ACCEPTED
6
$284,213
5
$247,860
2
$124,480
0
$0
APPLICATIONS DENIED
5
$672,306
9
$391,924
2
$115,670
1
$1,101,600
APPLICATIONS WITHDRAWN
1
$404,840
5
$410,566
1
$27,540
0
$0
FILES CLOSED FOR INCOMPLETENESS
1
$547,500
3
$388,313
0
$0
1
$189,480
Aggregated Statistics For Year 2006 (Based on 2 partial tracts)
B) Conventional Home Purchase Loans
C) Refinancings
D) Home Improvement Loans
F) Non-occupant Loans on < 5 Family Dwellings (A B C & D)
Number
Average Value
Number
Average Value
Number
Average Value
Number
Average Value
LOANS ORIGINATED
20
$387,570
32
$309,257
5
$114,676
1
$476,440
APPLICATIONS APPROVED, NOT ACCEPTED
6
$362,610
9
$342,047
2
$188,100
3
$389,783
APPLICATIONS DENIED
7
$384,694
15
$359,158
2
$28,365
1
$880,730
APPLICATIONS WITHDRAWN
2
$353,340
15
$326,257
1
$5,510
0
$0
FILES CLOSED FOR INCOMPLETENESS
1
$501,230
7
$485,491
0
$0
0
$0
Aggregated Statistics For Year 2005 (Based on 2 partial tracts)
B) Conventional Home Purchase Loans
C) Refinancings
D) Home Improvement Loans
E) Loans on Dwellings For 5+ Families
F) Non-occupant Loans on < 5 Family Dwellings (A B C & D)
G) Loans On Manufactured Home Dwelling (A B C & D)
Number
Average Value
Number
Average Value
Number
Average Value
Number
Average Value
Number
Average Value
Number
Average Value
LOANS ORIGINATED
30
$370,395
35
$329,410
4
$95,288
1
$429,620
4
$230,785
0
$0
APPLICATIONS APPROVED, NOT ACCEPTED
3
$248,410
9
$392,966
2
$96,390
0
$0
1
$161,380
1
$27,540
APPLICATIONS DENIED
4
$323,732
13
$354,673
3
$94,003
0
$0
1
$160,280
0
$0
APPLICATIONS WITHDRAWN
4
$350,860
10
$364,685
3
$175,153
0
$0
2
$310,650
0
$0
FILES CLOSED FOR INCOMPLETENESS
3
$513,163
7
$303,884
1
$289,170
0
$0
0
$0
0
$0
Aggregated Statistics For Year 2004 (Based on 2 partial tracts)
B) Conventional Home Purchase Loans
C) Refinancings
D) Home Improvement Loans
F) Non-occupant Loans on < 5 Family Dwellings (A B C & D)
Number
Average Value
Number
Average Value
Number
Average Value
Number
Average Value
LOANS ORIGINATED
26
$365,858
56
$273,610
7
$138,801
4
$316,298
APPLICATIONS APPROVED, NOT ACCEPTED
3
$383,173
9
$283,540
3
$85,740
0
$0
APPLICATIONS DENIED
4
$274,850
9
$394,006
2
$185,895
0
$0
APPLICATIONS WITHDRAWN
2
$215,915
15
$277,567
2
$140,455
1
$220,320
FILES CLOSED FOR INCOMPLETENESS
1
$261,630
6
$341,312
0
$0
0
$0
Aggregated Statistics For Year 2003 (Based on 2 partial tracts)
A) FHA, FSA/RHS & VA Home Purchase Loans
B) Conventional Home Purchase Loans
C) Refinancings
D) Home Improvement Loans
F) Non-occupant Loans on < 5 Family Dwellings (A B C & D)
Number
Average Value
Number
Average Value
Number
Average Value
Number
Average Value
Number
Average Value
LOANS ORIGINATED
1
$418,610
25
$342,443
100
$237,720
2
$57,835
2
$236,570
APPLICATIONS APPROVED, NOT ACCEPTED
0
$0
3
$150,183
18
$217,566
2
$101,900
1
$165,240
APPLICATIONS DENIED
0
$0
1
$396,580
17
$278,251
2
$85,650
1
$331,030
APPLICATIONS WITHDRAWN
0
$0
2
$425,495
21
$288,042
1
$58,380
1
$71,600
FILES CLOSED FOR INCOMPLETENESS
0
$0
1
$462,670
7
$192,466
2
$66,095
1
$114,020
Aggregated Statistics For Year 2002 (Based on 2 partial tracts)
B) Conventional Home Purchase Loans
C) Refinancings
D) Home Improvement Loans
F) Non-occupant Loans on < 5 Family Dwellings (A B C & D)
Number
Average Value
Number
Average Value
Number
Average Value
Number
Average Value
LOANS ORIGINATED
24
$291,075
77
$231,171
7
$89,230
2
$206,825
APPLICATIONS APPROVED, NOT ACCEPTED
6
$249,972
15
$301,251
1
$41,310
0
$0
APPLICATIONS DENIED
2
$461,295
11
$289,671
2
$146,515
1
$330,480
APPLICATIONS WITHDRAWN
1
$278,150
17
$264,319
2
$70,500
1
$342,050
FILES CLOSED FOR INCOMPLETENESS
0
$0
7
$243,139
0
$0
0
$0
Aggregated Statistics For Year 2001 (Based on 2 partial tracts)
A) FHA, FSA/RHS & VA Home Purchase Loans
B) Conventional Home Purchase Loans
C) Refinancings
D) Home Improvement Loans
F) Non-occupant Loans on < 5 Family Dwellings (A B C & D)
Number
Average Value
Number
Average Value
Number
Average Value
Number
Average Value
Number
Average Value
LOANS ORIGINATED
0
$0
21
$329,588
51
$219,823
6
$65,453
0
$0
APPLICATIONS APPROVED, NOT ACCEPTED
0
$0
3
$520,323
9
$241,128
1
$41,310
1
$133,840
APPLICATIONS DENIED
0
$0
3
$291,373
12
$368,302
3
$37,637
1
$96,390
APPLICATIONS WITHDRAWN
0
$0
3
$256,490
9
$241,618
1
$63,340
0
$0
FILES CLOSED FOR INCOMPLETENESS
1
$94,740
0
$0
3
$184,517
1
$27,540
0
$0
Aggregated Statistics For Year 2000 (Based on 2 partial tracts)
B) Conventional Home Purchase Loans
C) Refinancings
D) Home Improvement Loans
Number
Average Value
Number
Average Value
Number
Average Value
LOANS ORIGINATED
20
$244,941
16
$120,798
4
$73,258
APPLICATIONS APPROVED, NOT ACCEPTED
2
$230,785
3
$248,227
3
$47,000
APPLICATIONS DENIED
2
$430,725
7
$309,707
2
$44,615
APPLICATIONS WITHDRAWN
3
$216,647
7
$94,737
1
$115,670
FILES CLOSED FOR INCOMPLETENESS
1
$379,500
2
$172,950
1
$23,680
Aggregated Statistics For Year 1999 (Based on 1 partial tract)


 Nearest zip codes: 11579, 11548, 11576, 11542, 11577, 11050.