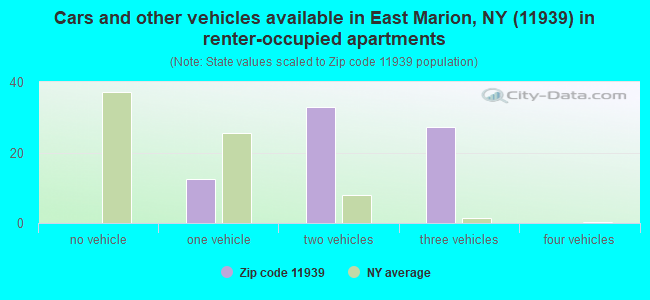
Estimated zip code population in 2022: 1,539 Zip code population in 2010: 926 Zip code population in 2000: 777
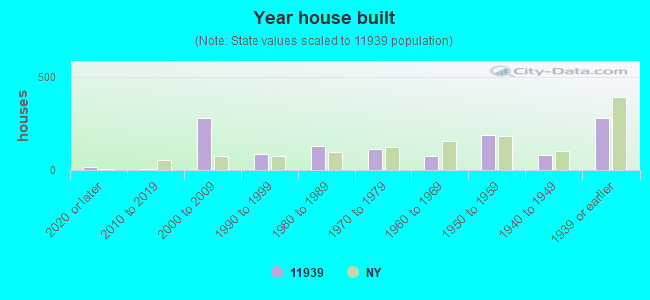
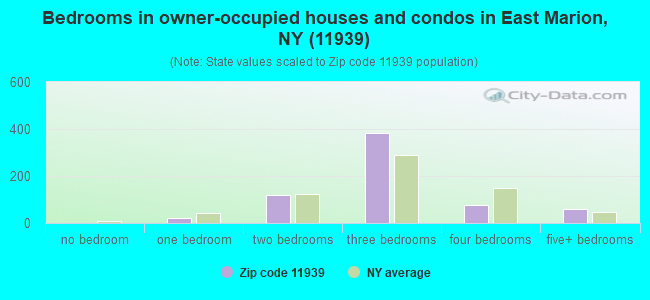
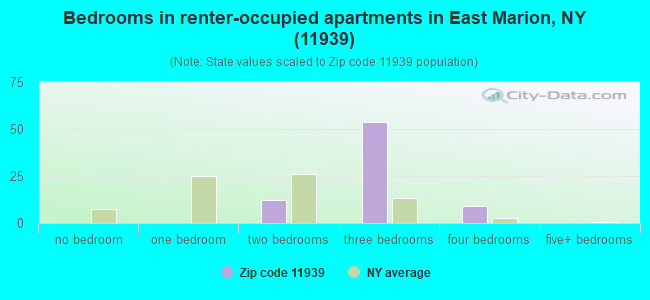
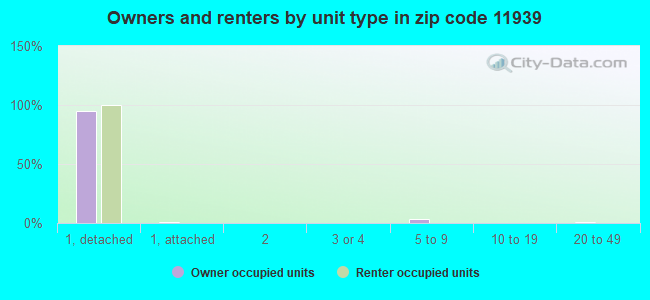
Houses and condos: 1,276 Renter-occupied apartments: 74
% of renters here:
10%
State:
46%
March 2022 cost of living index in zip code 11939: 155.6 (very high, U.S. average is 100)
Land area: 2.2 sq. mi. Water area: 5.2 sq. mi.
Population density: 688 people per square mile
(low).
OSM Map
General Map
Google Map
MSN Map
OSM Map
General Map
Google Map
MSN Map
OSM Map
General Map
Google Map
MSN Map
OSM Map
General Map
Google Map
MSN Map
Please wait while loading the map...
Real estate property taxes paid for housing units in 2022:
This zip code:
0.6% ($4,641)
New York:
1.5% ($6,180)
Median real estate property taxes paid for housing units with mortgages in 2022: $6,177 (0.7%) Median real estate property taxes paid for housing units with no mortgage in 2022: $4,304 (0.6%)
Business Search- 14 Million verified businesses
Males: 676
(43.9%)
Females: 862
(56.1%)
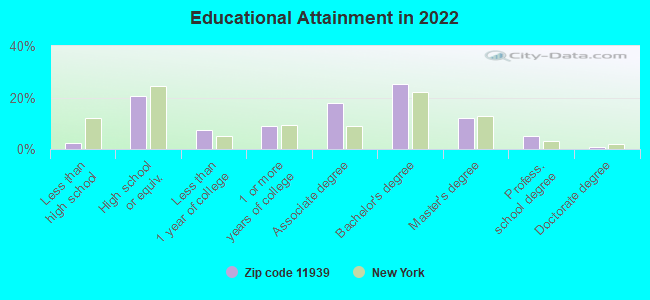
For population 25 years and over in 11939:
High school or higher: 98.1%
Bachelor's degree or higher: 43.3%
Graduate or professional degree: 18.0%
Unemployed: 0.9%
Mean travel time to work (commute): 28.4 minutes
For population 15 years and over in 11939:
Never married: 20.8%
Now married: 62.7%
Separated: 0.0%
Widowed: 7.3%
Divorced: 9.2%
Zip code 11939 compared to state average:
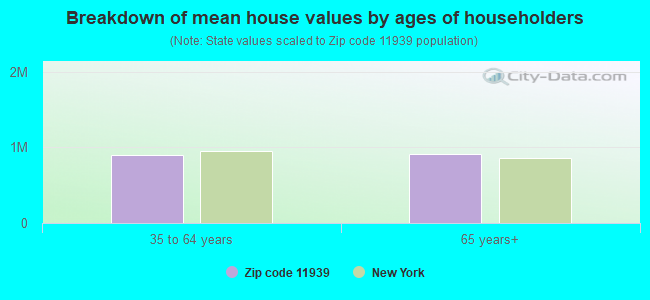
Median house value above state average.
Unemployed percentage significantly below state average.
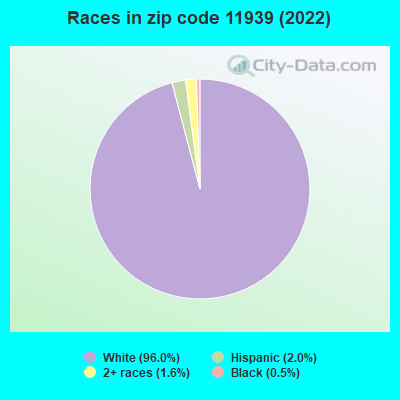
Black race population percentage significantly below state average.
Hispanic race population percentage significantly below state average.
Median age significantly above state average.
Foreign-born population percentage significantly below state average.
Renting percentage significantly below state average.
Length of stay since moving in above state average.
Estimated median house/condo value in 2022: $826,861
11939:
$826,861
New York:
$400,400
Median resident age:
This zip code:
62.4 years
New York median age:
40.0 years
Average household size:
This zip code:
2.1 people
New York:
2.5 people
Averages for the 2020 tax year for zip code 11939, filed in 2021:
Average Adjusted Gross Income (AGI) in 2020: $141,978 (Individual Income Tax Returns)
Here:
$141,978
State:
$90,930
Salary/wage: $101,728 (reported on 61.0% of returns)
Here:
$101,728
State:
$72,104
(% of AGI for various income ranges: 2105.0% for AGIs below $25k, 3804.0% for AGIs $25k-50k, 7770.0% for AGIs $50k-75k, 10676.7% for AGIs $75k-100k, 14896.0% for AGIs $100k-200k, 102375.0% for AGIs over 200k)
Taxable interest for individuals: $3,015 (reported on 55.9% of returns)
This zip code:
$3,015
New York:
$3,075
(% of AGI for various income ranges: 101.7% for AGIs below $25k, 70.0% for AGIs $25k-50k, 96.7% for AGIs $50k-75k, 133.3% for AGIs $75k-100k, 308.0% for AGIs $100k-200k, 3380.0% for AGIs over 200k)
Ordinary dividends: $9,756 (reported on 45.8% of returns)
Here:
$9,756
State:
$11,095
(% of AGI for various income ranges: 146.7% for AGIs below $25k, 170.0% for AGIs $25k-50k, 546.7% for AGIs $50k-75k, 510.0% for AGIs $75k-100k, 1520.0% for AGIs $100k-200k, 6920.0% for AGIs over 200k)
Net capital gain/loss in AGI: +$79,578 (reported on 39.0% of returns)
Here:
+$79,578
State:
+$44,925
(% of AGI for various income ranges: 208.3% for AGIs below $25k, 180.0% for AGIs $50k-75k, 570.0% for AGIs $75k-100k, 1326.0% for AGIs $100k-200k, 86450.0% for AGIs over 200k)
Profit/loss from business: +$17,340 (reported on 16.9% of returns)
Here:
+$17,340
State:
+$14,940
(% of AGI for various income ranges: 853.3% for AGIs below $25k, 1456.7% for AGIs $50k-75k, 1570.0% for AGIs $100k-200k)
Taxable individual retirement arrangement distribution: $26,633 (reported on 15.3% of returns)
11939:
$26,633
New York:
$19,609
(% of AGI for various income ranges: 241.7% for AGIs below $25k, 1033.3% for AGIs $50k-75k, 3884.0% for AGIs $100k-200k)
Total itemized deductions: $33,257 (reported on 23.7% of returns)
Here:
$33,257
State:
$39,326
(% of AGI for various income ranges: 3956.7% for AGIs $50k-75k, 2046.0% for AGIs $100k-200k, 12230.0% for AGIs over 200k)
Charity contributions: $4,683 (reported on 20.3% of returns)
Here:
$4,683
State:
$15,420
(% of AGI for various income ranges: 393.3% for AGIs $50k-75k, 244.0% for AGIs $100k-200k, 1610.0% for AGIs over 200k)
Taxes paid: $8,264 (reported on 23.7% of returns)
11939:
$8,264
State:
$9,183
(% of AGI for various income ranges: 1256.7% for AGIs $50k-75k, 474.0% for AGIs $100k-200k, 2715.0% for AGIs over 200k)
Earned income credit: $1,175 (reported on 6.8% of returns)
Here:
$1,175
State:
$2,138
(% of AGI for various income ranges: 78.3% for AGIs below $25k)
Percentage of individuals using paid preparers for their 2020 taxes: 93.2%
Here:
93%
State:
95%
(% for various income ranges: 93.3% for AGIs below $25k, 100.0% for AGIs $25k-50k, 85.7% for AGIs $50k-75k, 85.7% for AGIs $75k-100k, 100.0% for AGIs $100k-200k, 90.0% for AGIs over 200k)
Averages for the 2012 tax year for zip code 11939, filed in 2013:
Average Adjusted Gross Income (AGI) in 2012: $97,946 (Individual Income Tax Returns)
Here:
$97,946
State:
$77,088
Salary/wage: $63,062 (reported on 63.0% of returns)
Here:
$63,062
State:
$60,593
(% of AGI for various income ranges: 54.9% for AGIs below $25k, 52.4% for AGIs $25k-50k, 45.6% for AGIs $50k-75k, 49.4% for AGIs $75k-100k, 63.2% for AGIs $100k-200k, 24.4% for AGIs over 200k)
Taxable interest for individuals: $2,278 (reported on 59.3% of returns)
This zip code:
$2,278
New York:
$3,125
(% of AGI for various income ranges: 5.7% for AGIs below $25k, 2.1% for AGIs $25k-50k, 2.6% for AGIs $50k-75k, 2.9% for AGIs $75k-100k, 0.5% for AGIs $100k-200k, 0.8% for AGIs over 200k)
Ordinary dividends: $6,110 (reported on 38.9% of returns)
Here:
$6,110
State:
$10,299
(% of AGI for various income ranges: 3.4% for AGIs below $25k, 4.4% for AGIs $25k-50k, 4.0% for AGIs $50k-75k, 2.9% for AGIs $75k-100k, 1.0% for AGIs $100k-200k, 2.3% for AGIs over 200k)
Net capital gain/loss in AGI: +$16,407 (reported on 25.9% of returns)
Here:
+$16,407
State:
+$42,474
(% of AGI for various income ranges: 0.2% for AGIs below $25k, 22.0% for AGIs $25k-50k, 0.2% for AGIs $100k-200k, 8.9% for AGIs over 200k)
Profit/loss from business: +$8,475 (reported on 14.8% of returns)
Here:
+$8,475
State:
+$16,168
(% of AGI for various income ranges: 7.9% for AGIs below $25k, 12.6% for AGIs $25k-50k, 1.0% for AGIs $75k-100k)
Taxable individual retirement arrangement distribution: $17,458 (reported on 22.2% of returns)
11939:
$17,458
New York:
$17,621
(% of AGI for various income ranges: 8.5% for AGIs below $25k, 6.4% for AGIs $25k-50k, 4.9% for AGIs $50k-75k, 5.0% for AGIs $75k-100k, 10.1% for AGIs $100k-200k)
Total itemized deductions: $35,208 (21% of AGI, reported on 46.3% of returns)
Here:
$35,208
State:
$34,985
Here:
21.5% of AGI
State:
21.3% of AGI
(% of AGI for various income ranges: 22.2% for AGIs below $25k, 20.6% for AGIs $25k-50k, 20.9% for AGIs $50k-75k, 16.2% for AGIs $75k-100k, 19.6% for AGIs $100k-200k, 13.5% for AGIs over 200k)
Charity contributions: $2,632 (reported on 40.7% of returns)
Here:
$2,632
State:
$5,572
(% of AGI for various income ranges: 1.2% for AGIs below $25k, 1.7% for AGIs $25k-50k, 1.6% for AGIs $50k-75k, 1.1% for AGIs $75k-100k, 1.6% for AGIs $100k-200k, 0.6% for AGIs over 200k)
Taxes paid: $19,296 (reported on 46.3% of returns)
11939:
$19,296
State:
$18,656
(% of AGI for various income ranges: 7.6% for AGIs below $25k, 7.0% for AGIs $25k-50k, 7.3% for AGIs $50k-75k, 6.8% for AGIs $75k-100k, 9.6% for AGIs $100k-200k, 10.1% for AGIs over 200k)
Earned income credit: $1,925 (reported on 7.4% of returns)
Here:
$1,925
State:
$2,230
(% of AGI for various income ranges: 3.5% for AGIs below $25k)
Percentage of individuals using paid preparers for their 2012 taxes: 75.9%
Here:
76%
State:
66%
(% for various income ranges: 72.2% for AGIs below $25k, 80.0% for AGIs $25k-50k, 75.0% for AGIs $50k-75k, 80.0% for AGIs $75k-100k, 77.8% for AGIs $100k-200k, 75.0% for AGIs over 200k)
Averages for the 2004 tax year for zip code 11939, filed in 2005:
Average Adjusted Gross Income (AGI) in 2004: $64,846 (Individual Income Tax Returns)
Here:
$64,846
State:
$59,519
Salary/wage: $54,363 (reported on 60.4% of returns)
Here:
$54,363
State:
$50,673
(% of AGI for various income ranges: 128.5% for AGIs below $10k, 44.9% for AGIs $10k-25k, 48.2% for AGIs $25k-50k, 54.9% for AGIs $50k-75k, 57.6% for AGIs $75k-100k, 48.1% for AGIs over 100k)
Taxable interest for individuals: $3,103 (reported on 70.9% of returns)
This zip code:
$3,103
New York:
$2,377
(% of AGI for various income ranges: 14.6% for AGIs below $10k, 8.0% for AGIs $10k-25k, 4.1% for AGIs $25k-50k, 2.2% for AGIs $50k-75k, 1.7% for AGIs $75k-100k, 3.4% for AGIs over 100k)
Taxable dividends: $3,711 (reported on 50.7% of returns)
Here:
$3,711
State:
$5,394
(% of AGI for various income ranges: 17.2% for AGIs below $10k, 6.7% for AGIs $10k-25k, 3.6% for AGIs $25k-50k, 2.3% for AGIs $50k-75k, 1.9% for AGIs $75k-100k, 2.6% for AGIs over 100k)
Net capital gain/loss: +$10,469 (reported on 42.0% of returns)
Here:
+$10,469
State:
+$23,581
(% of AGI for various income ranges: -24.7% for AGIs below $10k, -1.4% for AGIs $10k-25k, -1.2% for AGIs $25k-50k, 0.3% for AGIs $50k-75k, 3.7% for AGIs $75k-100k, 12.1% for AGIs over 100k)
Profit/loss from business: +$8,826 (reported on 17.3% of returns)
Here:
+$8,826
State:
+$13,809
(% of AGI for various income ranges: 46.9% for AGIs below $10k, 12.9% for AGIs $25k-50k, 2.2% for AGIs $50k-75k, 0.1% for AGIs over 100k)
IRA payment deduction: $4,043 (reported on 4.3% of returns)
11939:
$4,043
New York:
$3,115
Total itemized deductions: $21,729 (21% of AGI, reported on 47.8% of returns)
Here:
$21,729
State:
$25,864
Here:
20.8% of AGI
State:
21.9% of AGI
(% of AGI for various income ranges: 33.7% for AGIs $10k-25k, 18.6% for AGIs $25k-50k, 14.8% for AGIs $50k-75k, 15.7% for AGIs $75k-100k, 14.5% for AGIs over 100k)
Charity contributions deductions: $2,584 (2% of AGI, reported on 43.7% of returns)
Here:
$2,584
State:
$4,439
Here:
2.4% of AGI
State:
3.6% of AGI
(% of AGI for various income ranges: 3.6% for AGIs $10k-25k, 2.3% for AGIs $25k-50k, 1.8% for AGIs $50k-75k, 2.2% for AGIs $75k-100k, 1.4% for AGIs over 100k)
Total tax: $11,458 (reported on 79.0% of returns)
11939:
$11,458
State:
$11,730
(% of AGI for various income ranges: 5.4% for AGIs below $10k, 3.5% for AGIs $10k-25k, 8.1% for AGIs $25k-50k, 9.9% for AGIs $50k-75k, 11.0% for AGIs $75k-100k, 18.0% for AGIs over 100k)
Earned income credit: $1,423 (reported on 4.9% of returns)
Here:
$1,423
State:
$1,757
Percentage of individuals using paid preparers for their 2004 taxes: 73.4%
Here:
73%
State:
67%
(% for various income ranges: 63.7% for AGIs below $10k, 73.4% for AGIs $10k-25k, 75.4% for AGIs $25k-50k, 75.9% for AGIs $50k-75k, 70.0% for AGIs $75k-100k, 81.4% for AGIs over 100k)
Likely homosexual households (counted as self-reported same-sex unmarried-partner households)
Lesbian couples: 1.1% of all households
Gay men: 0.0% of all households
Household received Food Stamps/SNAP in the past 12 months: 0 Household did not receive Food Stamps/SNAP in the past 12 months: 724
Women who did not have a birth in the past 12 months: 224 (78 now married, 145 unmarried)
Housing units in zip code 11939 with a mortgage: 225 (68 second mortgage, 56 both second mortgage and home equity loan) Median monthly owner costs for units with a mortgage: $3,363 Median monthly owner costs for units without a mortgage: $757
Residents with income below the poverty level in 2022:
This zip code:
1.8%
Whole state:
14.3%
Residents with income below 50% of the poverty level in 2022:
This zip code:
0.4%
Whole state:
6.8%
Median number of rooms in houses and condos:
Here:
6.3
State:
6.3
Median number of rooms in apartments:
Here:
5.7
State:
3.8
Notable locations in this zip code not listed on our city pages
Size of family households: 299 2-persons, 95 3-persons, 79 4-persons, 5 6-persons
Size of nonfamily households: 205 1-person, 51 2-persons, 2 3-persons
125 married couples with children.
7 single-parent households (7 men).
89.4% of residents of 11939 zip code speak English at home.
8.9% of residents speak other Indo-European language at home (57% very well, 34% well, 9% not well).
3.3% of residents speak Asian or Pacific Island language at home (12% very well, 78% well, 10% not well).
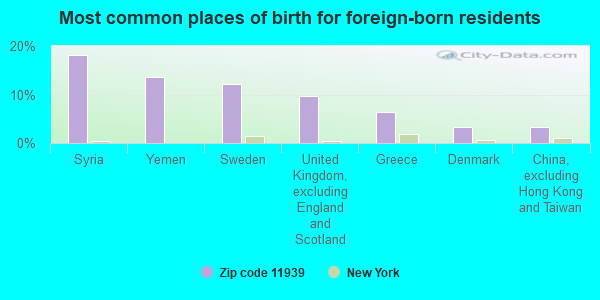
Foreign born population: 158 (10.3%) (100.0% of them are naturalized citizens)
This zip code:
10.3%
Whole state:
22.7%
18%Syria
14%Yemen
12%Sweden
10%United Kingdom, excluding England and Scotland
6%Greece
3%Denmark
3%China, excluding Hong Kong and Taiwan
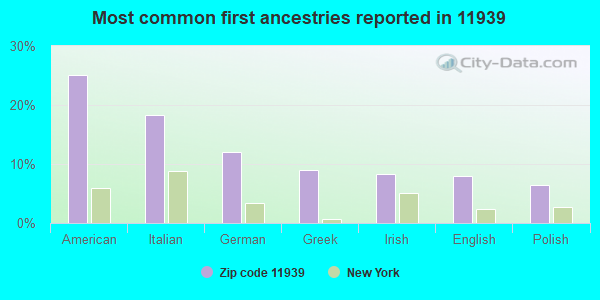
25%American
18%Italian
12%German
9%Greek
8%Irish
8%English
6%Polish
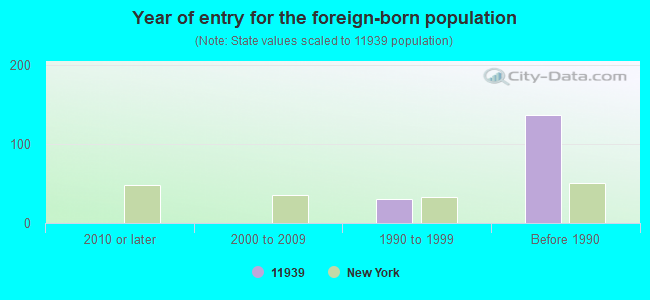
Year of entry for the foreign-born population
02010 or later
02000 to 2009
301990 to 1999
137Before 1990
Housing units lacking complete plumbing facilities: 0.2% Housing units lacking complete kitchen facilities: 0.8%
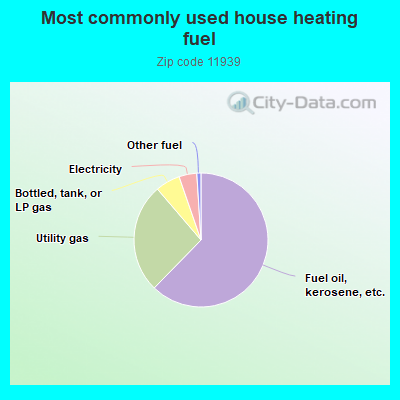
62.5%Fuel oil, kerosene, etc.
26.5%Utility gas
6.0%Bottled, tank, or LP gas
4.3%Electricity
1.0%Other fuel
Population in 1990: 717. Population change in the 1990s: +60 (+8.4%).
Place of birth for U.S.-born residents:
This state: 1,170
Northeast: 68
Midwest: 115
South: 7
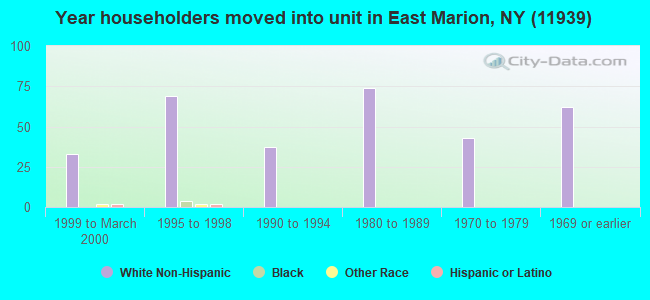
68% of the 11939 zip code residents lived in the same house 5 years ago. Out of people who lived in different houses, 76% lived in this county. Out of people who lived in different counties, 50% lived in New York.
99% of the 11939 zip code residents lived in the same house 1 year ago. Out of people who lived in different houses, 92% moved from different county within same state.
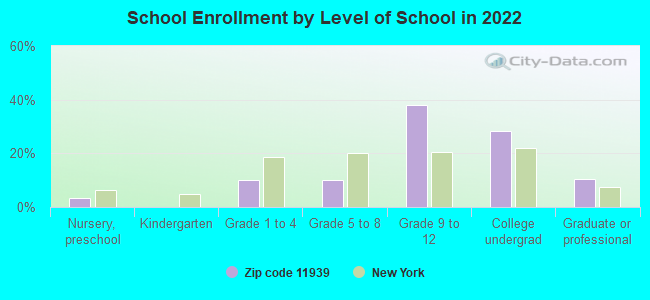
Private vs. public school enrollment:
Students in private schools in grades 1 to 8 (elementary and middle school):
Here:
0.0%
New York:
15.6%
Students in private schools in grades 9 to 12 (high school):
Here:
0.0%
New York:
15.0%
Students in private undergraduate colleges: 26
Here:
49.8%
New York:
39.2%
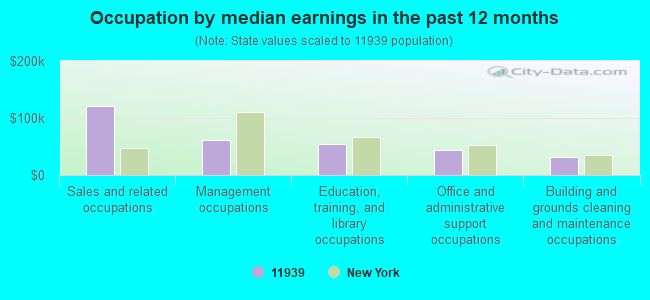
Occupation by median earnings in the past 12 months ($)
120,612Sales and related occupations
62,277Management occupations
54,953Education, training, and library occupations
43,079Office and administrative support occupations
32,186Building and grounds cleaning and maintenance occupations
Top industries in this zip code by the number of employees in 2005:
Professional, Scientific, and Technical Services: Human Resources and Executive Search Consulting Services (1-4: 1)
Accommodation and Food Services: Hotels (except Casino Hotels) and Motels (1-4: 1)
Administrative and Support and Waste Management and Remediation Services: Janitorial Services (1-4: 1)
Administrative and Support and Waste Management and Remediation Services: Employment Placement Agencies (1-4: 1)
Professional, Scientific, and Technical Services: Other Specialized Design Services (1-4: 1)
Information: Motion Picture and Video Production (1-4: 1)
Construction: Glass and Glazing Contractors (1-4: 1)
Accommodation and Food Services: Bed-and-Breakfast Inns (1-4: 1)
Other Services (except Public Administration): Other Similar Organizations (except Business, Professional, Labor, and Political Organizations) (1-4: 1)
Home Mortgage Disclosure Act Aggregated Statistics For Year 2009 (Based on 2 partial tracts)
A) FHA, FSA/RHS & VA Home Purchase Loans
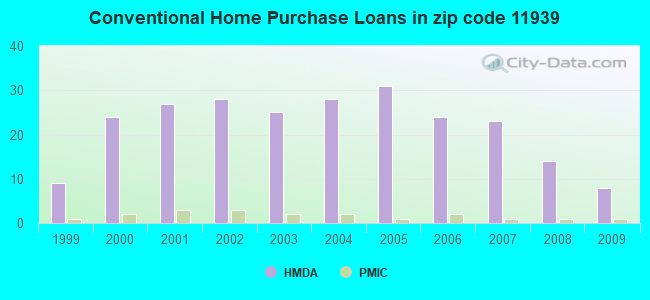
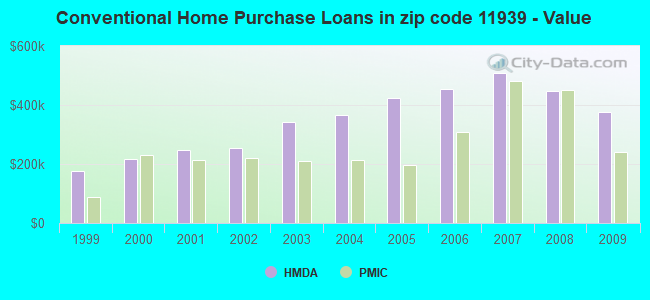
B) Conventional Home Purchase Loans
C) Refinancings
D) Home Improvement Loans
F) Non-occupant Loans on < 5 Family Dwellings (A B C & D)
Number
Average Value
Number
Average Value
Number
Average Value
Number
Average Value
Number
Average Value
LOANS ORIGINATED
1
$379,250
8
$376,461
24
$345,621
4
$218,198
17
$367,799
APPLICATIONS APPROVED, NOT ACCEPTED
0
$0
1
$468,790
2
$523,950
0
$0
2
$417,755
APPLICATIONS DENIED
0
$0
2
$617,465
17
$412,218
1
$47,980
10
$445,381
APPLICATIONS WITHDRAWN
0
$0
1
$272,900
11
$410,810
1
$112,770
6
$456,108
FILES CLOSED FOR INCOMPLETENESS
0
$0
1
$608,140
2
$620,825
0
$0
1
$1,318,050
Aggregated Statistics For Year 2008 (Based on 2 partial tracts)
B) Conventional Home Purchase Loans
C) Refinancings
D) Home Improvement Loans
F) Non-occupant Loans on < 5 Family Dwellings (A B C & D)
Number
Average Value
Number
Average Value
Number
Average Value
Number
Average Value
LOANS ORIGINATED
14
$447,420
15
$316,418
3
$155,143
15
$435,501
APPLICATIONS APPROVED, NOT ACCEPTED
2
$511,575
3
$208,217
0
$0
2
$435,785
APPLICATIONS DENIED
3
$305,397
6
$318,740
2
$226,145
3
$383,427
APPLICATIONS WITHDRAWN
1
$293,680
2
$461,000
0
$0
1
$522,880
FILES CLOSED FOR INCOMPLETENESS
1
$450,760
2
$212,390
0
$0
1
$476,430
Aggregated Statistics For Year 2007 (Based on 2 partial tracts)
B) Conventional Home Purchase Loans
C) Refinancings
D) Home Improvement Loans
F) Non-occupant Loans on < 5 Family Dwellings (A B C & D)
Number
Average Value
Number
Average Value
Number
Average Value
Number
Average Value
LOANS ORIGINATED
23
$508,930
24
$445,387
6
$123,157
18
$645,071
APPLICATIONS APPROVED, NOT ACCEPTED
3
$718,363
4
$304,072
1
$239,280
2
$698,295
APPLICATIONS DENIED
5
$503,506
12
$500,853
2
$103,905
4
$575,062
APPLICATIONS WITHDRAWN
2
$593,630
7
$477,521
1
$297,040
3
$538,367
FILES CLOSED FOR INCOMPLETENESS
1
$967,530
2
$245,700
0
$0
1
$434,260
Aggregated Statistics For Year 2006 (Based on 2 partial tracts)
B) Conventional Home Purchase Loans
C) Refinancings
D) Home Improvement Loans
F) Non-occupant Loans on < 5 Family Dwellings (A B C & D)
Number
Average Value
Number
Average Value
Number
Average Value
Number
Average Value
LOANS ORIGINATED
24
$454,848
30
$411,012
6
$157,027
20
$549,454
APPLICATIONS APPROVED, NOT ACCEPTED
3
$394,630
5
$582,168
2
$133,855
2
$1,212,775
APPLICATIONS DENIED
6
$343,800
12
$345,939
2
$88,625
3
$533,273
APPLICATIONS WITHDRAWN
1
$448,620
10
$322,989
1
$60,510
2
$479,945
FILES CLOSED FOR INCOMPLETENESS
0
$0
3
$290,727
0
$0
0
$0
Aggregated Statistics For Year 2005 (Based on 2 partial tracts)
B) Conventional Home Purchase Loans
C) Refinancings
D) Home Improvement Loans
F) Non-occupant Loans on < 5 Family Dwellings (A B C & D)
Number
Average Value
Number
Average Value
Number
Average Value
Number
Average Value
LOANS ORIGINATED
31
$423,601
32
$314,930
8
$214,875
26
$459,552
APPLICATIONS APPROVED, NOT ACCEPTED
4
$297,350
5
$328,276
2
$169,610
2
$461,915
APPLICATIONS DENIED
6
$276,873
13
$396,716
3
$105,023
3
$507,500
APPLICATIONS WITHDRAWN
5
$315,502
9
$338,266
2
$168,385
4
$336,848
FILES CLOSED FOR INCOMPLETENESS
2
$540,605
6
$281,050
0
$0
0
$0
Aggregated Statistics For Year 2004 (Based on 2 partial tracts)
B) Conventional Home Purchase Loans
C) Refinancings
D) Home Improvement Loans
F) Non-occupant Loans on < 5 Family Dwellings (A B C & D)
Number
Average Value
Number
Average Value
Number
Average Value
Number
Average Value
LOANS ORIGINATED
28
$364,461
39
$351,221
5
$148,032
25
$457,165
APPLICATIONS APPROVED, NOT ACCEPTED
2
$263,735
9
$291,882
0
$0
2
$565,055
APPLICATIONS DENIED
5
$340,438
17
$324,134
3
$175,720
5
$499,594
APPLICATIONS WITHDRAWN
2
$266,790
10
$293,896
1
$90,150
2
$461,915
FILES CLOSED FOR INCOMPLETENESS
1
$242,950
7
$329,480
0
$0
1
$514,020
Aggregated Statistics For Year 2003 (Based on 2 partial tracts)
B) Conventional Home Purchase Loans
C) Refinancings
D) Home Improvement Loans
F) Non-occupant Loans on < 5 Family Dwellings (A B C & D)
Number
Average Value
Number
Average Value
Number
Average Value
Number
Average Value
LOANS ORIGINATED
25
$341,111
76
$271,341
4
$92,902
38
$326,469
APPLICATIONS APPROVED, NOT ACCEPTED
2
$612,730
14
$226,209
1
$97,790
3
$526,347
APPLICATIONS DENIED
2
$240,965
14
$231,317
2
$63,870
2
$148,980
APPLICATIONS WITHDRAWN
3
$293,273
14
$254,805
1
$29,030
3
$140,677
FILES CLOSED FOR INCOMPLETENESS
1
$141,490
5
$270,090
0
$0
2
$309,265
Aggregated Statistics For Year 2002 (Based on 2 partial tracts)
B) Conventional Home Purchase Loans
C) Refinancings
D) Home Improvement Loans
F) Non-occupant Loans on < 5 Family Dwellings (A B C & D)
Number
Average Value
Number
Average Value
Number
Average Value
Number
Average Value
LOANS ORIGINATED
28
$254,161
48
$241,367
6
$70,645
28
$302,620
APPLICATIONS APPROVED, NOT ACCEPTED
3
$273,920
7
$273,424
1
$51,950
3
$381,897
APPLICATIONS DENIED
3
$264,650
8
$199,786
4
$96,952
3
$323,630
APPLICATIONS WITHDRAWN
4
$321,110
8
$223,050
1
$103,290
2
$213,155
FILES CLOSED FOR INCOMPLETENESS
1
$394,220
3
$272,697
0
$0
1
$314,770
Aggregated Statistics For Year 2001 (Based on 2 partial tracts)
B) Conventional Home Purchase Loans
C) Refinancings
D) Home Improvement Loans
F) Non-occupant Loans on < 5 Family Dwellings (A B C & D)
Number
Average Value
Number
Average Value
Number
Average Value
Number
Average Value
LOANS ORIGINATED
27
$248,826
31
$205,639
6
$66,265
18
$303,495
APPLICATIONS APPROVED, NOT ACCEPTED
1
$422,340
4
$193,445
2
$57,760
2
$203,530
APPLICATIONS DENIED
2
$328,215
8
$179,808
1
$54,400
3
$179,490
APPLICATIONS WITHDRAWN
3
$234,803
5
$222,600
1
$294,900
3
$304,277
FILES CLOSED FOR INCOMPLETENESS
2
$288,640
3
$223,597
0
$0
1
$159,220
Aggregated Statistics For Year 2000 (Based on 2 partial tracts)
A) FHA, FSA/RHS & VA Home Purchase Loans
B) Conventional Home Purchase Loans
C) Refinancings
D) Home Improvement Loans
F) Non-occupant Loans on < 5 Family Dwellings (A B C & D)
Number
Average Value
Number
Average Value
Number
Average Value
Number
Average Value
Number
Average Value
LOANS ORIGINATED
1
$83,120
24
$216,785
12
$164,463
3
$42,070
11
$250,565
APPLICATIONS APPROVED, NOT ACCEPTED
0
$0
2
$167,165
3
$242,747
0
$0
2
$215,450
APPLICATIONS DENIED
0
$0
3
$404,817
4
$289,710
2
$60,965
2
$423,865
APPLICATIONS WITHDRAWN
0
$0
2
$238,060
3
$73,040
1
$19,860
1
$208,420
FILES CLOSED FOR INCOMPLETENESS
0
$0
1
$318,130
2
$238,370
0
$0
0
$0
Aggregated Statistics For Year 1999 (Based on 1 partial tract)
B) Conventional Home Purchase Loans
C) Refinancings
D) Home Improvement Loans
F) Non-occupant Loans on < 5 Family Dwellings (A B C & D)

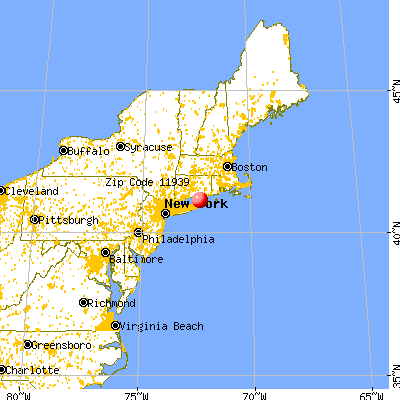


 Nearest zip codes: 11965, 11944, 11964, 11963, 11971, 11958.