Estimated zip code population in 2022: 6,186 Zip code population in 2010: 5,818 Zip code population in 2000: 5,575
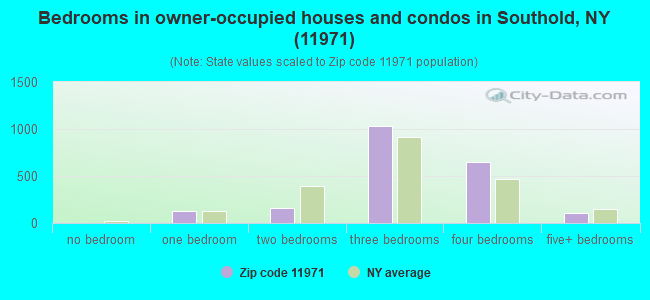
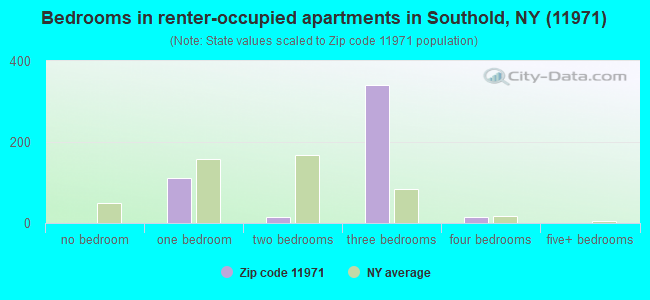
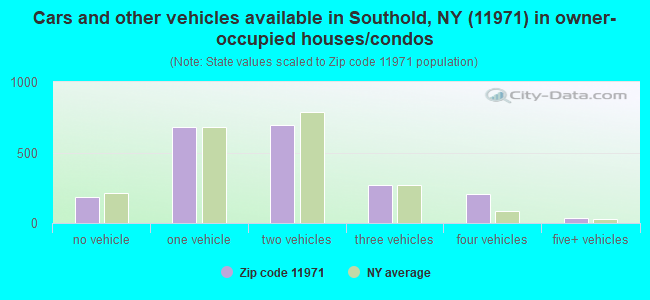
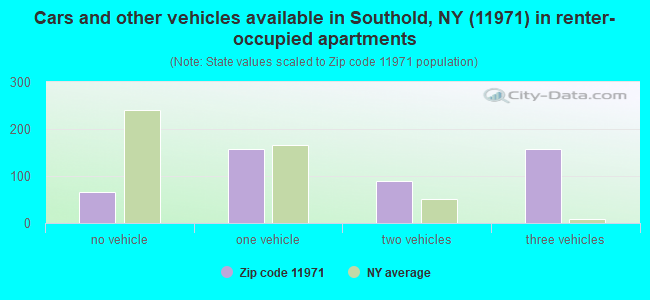
Houses and condos: 4,000 Renter-occupied apartments: 479
% of renters here:
19%
State:
46%
March 2022 cost of living index in zip code 11971: 153.4 (very high, U.S. average is 100)
Land area: 11.1 sq. mi. Water area: 4.1 sq. mi.
Population density: 559 people per square mile
(low).
OSM Map
General Map
Google Map
MSN Map
OSM Map
General Map
Google Map
MSN Map
OSM Map
General Map
Google Map
MSN Map
OSM Map
General Map
Google Map
MSN Map
Please wait while loading the map...
Real estate property taxes paid for housing units in 2022:
This zip code:
1.0% ($7,185)
New York:
1.5% ($6,180)
Median real estate property taxes paid for housing units with mortgages in 2022: $8,025 (1.1%) Median real estate property taxes paid for housing units with no mortgage in 2022: $6,279 (0.9%)
Business Search- 14 Million verified businesses
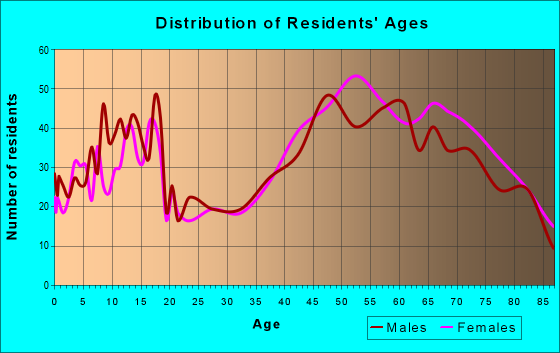
Males: 3,207
(51.8%)
Females: 2,979
(48.2%)
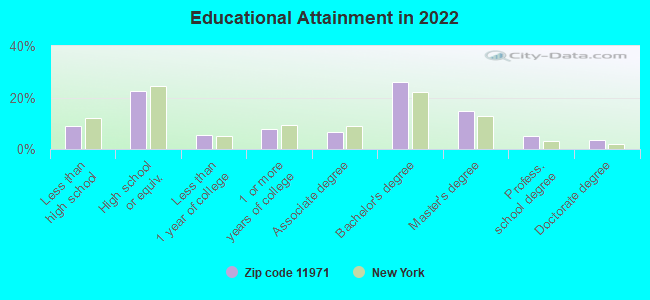
For population 25 years and over in 11971:
High school or higher: 91.5%
Bachelor's degree or higher: 49.1%
Graduate or professional degree: 23.1%
Unemployed: 7.2%
Mean travel time to work (commute): 25.9 minutes
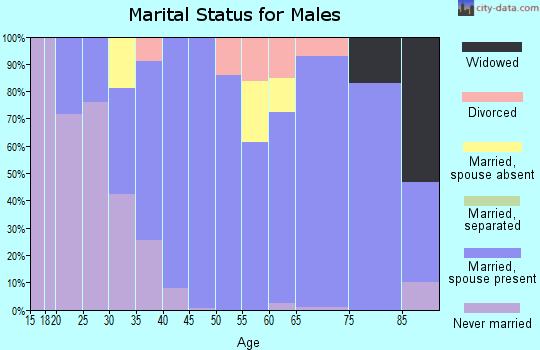
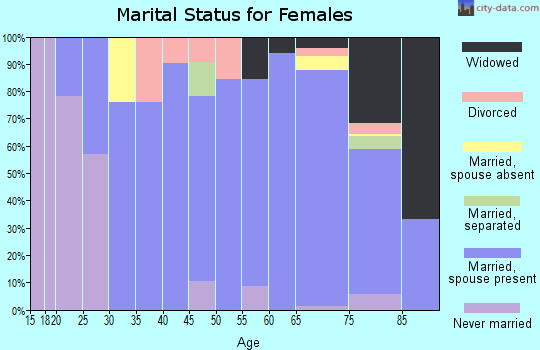
For population 15 years and over in 11971:
Never married: 19.2%
Now married: 68.3%
Separated: 1.5%
Widowed: 7.1%
Divorced: 3.8%
Zip code 11971 compared to state average:
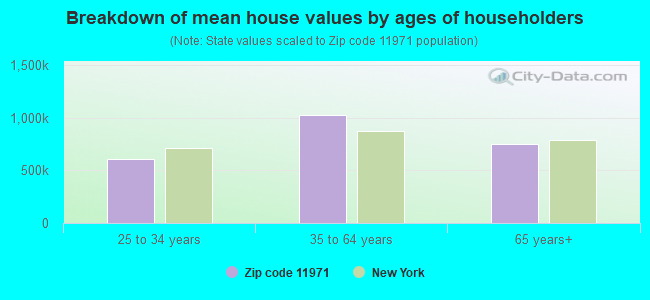
Median house value above state average.
Black race population percentage significantly below state average.
Median age significantly above state average.
Foreign-born population percentage below state average.
Renting percentage significantly below state average.
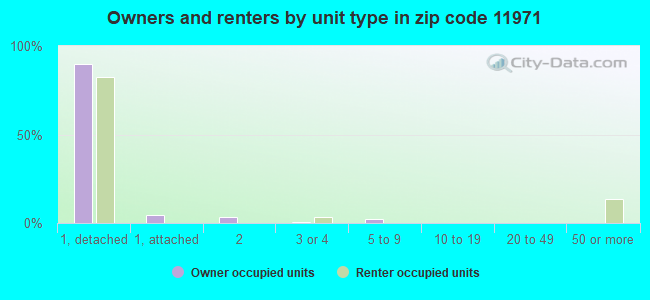
Number of rooms per house above state average.
Number of college students significantly below state average.
Estimated median house/condo value in 2022: $724,598
11971:
$724,598
New York:
$400,400
According to our research of New York and other state lists, there were 3 registered sex offenders living in 11971 zip code as of April 17, 2024. The ratio of all residents to sex offenders in zip code 11971 is 2,139 to 1. The ratio of registered sex offenders to all residents in this zip code is lower than the state average.
Median resident age:
This zip code:
50.3 years
New York median age:
40.0 years
Average household size:
This zip code:
2.4 people
New York:
2.5 people
Averages for the 2020 tax year for zip code 11971, filed in 2021:
Average Adjusted Gross Income (AGI) in 2020: $128,039 (Individual Income Tax Returns)
Here:
$128,039
State:
$90,930
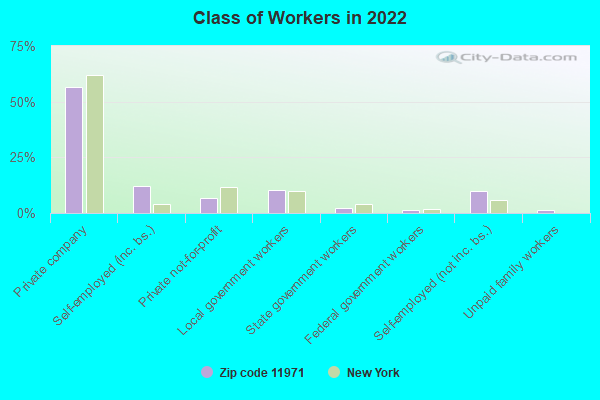
Salary/wage: $101,608 (reported on 69.2% of returns)
Here:
$101,608
State:
$72,104
(% of AGI for various income ranges: 1473.4% for AGIs below $25k, 3557.1% for AGIs $25k-50k, 6615.7% for AGIs $50k-75k, 8945.4% for AGIs $75k-100k, 17293.3% for AGIs $100k-200k, 142615.6% for AGIs over 200k)
Taxable interest for individuals: $3,164 (reported on 56.1% of returns)
This zip code:
$3,164
New York:
$3,075
(% of AGI for various income ranges: 45.1% for AGIs below $25k, 81.1% for AGIs $25k-50k, 220.4% for AGIs $50k-75k, 296.9% for AGIs $75k-100k, 391.7% for AGIs $100k-200k, 3508.9% for AGIs over 200k)
Ordinary dividends: $11,814 (reported on 42.7% of returns)
Here:
$11,814
State:
$11,095
(% of AGI for various income ranges: 126.3% for AGIs below $25k, 220.6% for AGIs $25k-50k, 305.2% for AGIs $50k-75k, 913.1% for AGIs $75k-100k, 1396.0% for AGIs $100k-200k, 9797.8% for AGIs over 200k)
Net capital gain/loss in AGI: +$33,915 (reported on 36.8% of returns)
Here:
+$33,915
State:
+$44,925
(% of AGI for various income ranges: 40.0% for AGIs below $25k, 76.3% for AGIs $25k-50k, 233.0% for AGIs $50k-75k, 593.8% for AGIs $75k-100k, 1516.0% for AGIs $100k-200k, 37481.1% for AGIs over 200k)
Profit/loss from business: +$26,532 (reported on 18.4% of returns)
Here:
+$26,532
State:
+$14,940
(% of AGI for various income ranges: 255.1% for AGIs below $25k, 406.3% for AGIs $25k-50k, 379.6% for AGIs $50k-75k, 803.8% for AGIs $75k-100k, 550.0% for AGIs $100k-200k, 10686.7% for AGIs over 200k)
Taxable individual retirement arrangement distribution: $26,502 (reported on 17.8% of returns)
11971:
$26,502
New York:
$19,609
(% of AGI for various income ranges: 102.4% for AGIs below $25k, 205.7% for AGIs $25k-50k, 544.8% for AGIs $50k-75k, 974.6% for AGIs $75k-100k, 1922.7% for AGIs $100k-200k, 6308.9% for AGIs over 200k)
Self-employed (Keogh) retirement plans: $33,740 (reported on 1.6% of returns)
11971:
$33,740
New York:
$32,497
(% of AGI for various income ranges: 209.2% for AGIs $75k-100k, 1572.2% for AGIs over 200k)
Total itemized deductions: $31,432 (reported on 20.6% of returns)
Here:
$31,432
State:
$39,326
(% of AGI for various income ranges: 217.6% for AGIs below $25k, 430.3% for AGIs $25k-50k, 680.9% for AGIs $50k-75k, 1586.2% for AGIs $75k-100k, 1940.3% for AGIs $100k-200k, 9886.7% for AGIs over 200k)
Charity contributions: $6,066 (reported on 18.1% of returns)
Here:
$6,066
State:
$15,420
(% of AGI for various income ranges: 8.3% for AGIs below $25k, 26.6% for AGIs $25k-50k, 92.6% for AGIs $50k-75k, 180.8% for AGIs $75k-100k, 244.0% for AGIs $100k-200k, 2456.7% for AGIs over 200k)
Taxes paid: $8,812 (reported on 20.6% of returns)
11971:
$8,812
State:
$9,183
(% of AGI for various income ranges: 67.6% for AGIs below $25k, 119.4% for AGIs $25k-50k, 226.1% for AGIs $50k-75k, 511.5% for AGIs $75k-100k, 601.0% for AGIs $100k-200k, 2370.0% for AGIs over 200k)
Earned income credit: $1,795 (reported on 6.2% of returns)
Here:
$1,795
State:
$2,138
(% of AGI for various income ranges: 58.0% for AGIs below $25k, 34.6% for AGIs $25k-50k)
Percentage of individuals using paid preparers for their 2020 taxes: 95.0%
Here:
95%
State:
95%
(% for various income ranges: 91.4% for AGIs below $25k, 96.4% for AGIs $25k-50k, 95.3% for AGIs $50k-75k, 96.6% for AGIs $75k-100k, 97.1% for AGIs $100k-200k, 95.3% for AGIs over 200k)
Averages for the 2012 tax year for zip code 11971, filed in 2013:
Average Adjusted Gross Income (AGI) in 2012: $85,526 (Individual Income Tax Returns)
Here:
$85,526
State:
$77,088
Salary/wage: $62,688 (reported on 69.7% of returns)
Here:
$62,688
State:
$60,593
(% of AGI for various income ranges: 63.1% for AGIs below $25k, 59.2% for AGIs $25k-50k, 54.3% for AGIs $50k-75k, 45.7% for AGIs $75k-100k, 58.2% for AGIs $100k-200k, 42.9% for AGIs over 200k)
Taxable interest for individuals: $2,592 (reported on 62.7% of returns)
This zip code:
$2,592
New York:
$3,125
(% of AGI for various income ranges: 3.6% for AGIs below $25k, 2.3% for AGIs $25k-50k, 2.0% for AGIs $50k-75k, 2.0% for AGIs $75k-100k, 1.5% for AGIs $100k-200k, 1.9% for AGIs over 200k)
Ordinary dividends: $9,075 (reported on 41.7% of returns)
Here:
$9,075
State:
$10,299
(% of AGI for various income ranges: 6.4% for AGIs below $25k, 4.4% for AGIs $25k-50k, 4.2% for AGIs $50k-75k, 3.4% for AGIs $75k-100k, 3.4% for AGIs $100k-200k, 5.4% for AGIs over 200k)
Net capital gain/loss in AGI: +$17,521 (reported on 32.2% of returns)
Here:
+$17,521
State:
+$42,474
(% of AGI for various income ranges: 1.0% for AGIs $75k-100k, 2.3% for AGIs $100k-200k, 15.6% for AGIs over 200k)
Profit/loss from business: +$19,953 (reported on 18.2% of returns)
Here:
+$19,953
State:
+$16,168
(% of AGI for various income ranges: 7.6% for AGIs below $25k, 5.6% for AGIs $25k-50k, 4.5% for AGIs $50k-75k, 3.0% for AGIs $75k-100k, 3.2% for AGIs $100k-200k, 4.7% for AGIs over 200k)
Taxable individual retirement arrangement distribution: $18,969 (reported on 21.3% of returns)
11971:
$18,969
New York:
$17,621
(% of AGI for various income ranges: 6.8% for AGIs below $25k, 5.2% for AGIs $25k-50k, 4.4% for AGIs $50k-75k, 7.2% for AGIs $75k-100k, 5.3% for AGIs $100k-200k, 3.3% for AGIs over 200k)
Self-employment retirement plans: $18,360 (reported on 1.6% of returns)
11971:
$18,360
New York:
$27,330
Total itemized deductions: $30,143 (23% of AGI, reported on 53.2% of returns)
Here:
$30,143
State:
$34,985
Here:
22.6% of AGI
State:
21.3% of AGI
(% of AGI for various income ranges: 25.9% for AGIs below $25k, 20.0% for AGIs $25k-50k, 20.1% for AGIs $50k-75k, 21.2% for AGIs $75k-100k, 21.0% for AGIs $100k-200k, 14.8% for AGIs over 200k)
Charity contributions: $3,048 (reported on 47.5% of returns)
Here:
$3,048
State:
$5,572
(% of AGI for various income ranges: 1.6% for AGIs below $25k, 1.6% for AGIs $25k-50k, 2.0% for AGIs $50k-75k, 2.0% for AGIs $75k-100k, 1.9% for AGIs $100k-200k, 1.4% for AGIs over 200k)
Taxes paid: $14,938 (reported on 53.2% of returns)
11971:
$14,938
State:
$18,656
(% of AGI for various income ranges: 8.9% for AGIs below $25k, 8.1% for AGIs $25k-50k, 9.0% for AGIs $50k-75k, 9.6% for AGIs $75k-100k, 9.9% for AGIs $100k-200k, 9.0% for AGIs over 200k)
Earned income credit: $1,790 (reported on 6.4% of returns)
Here:
$1,790
State:
$2,230
(% of AGI for various income ranges: 2.2% for AGIs below $25k, 0.6% for AGIs $25k-50k)
Percentage of individuals using paid preparers for their 2012 taxes: 72.0%
Here:
72%
State:
66%
(% for various income ranges: 62.6% for AGIs below $25k, 69.5% for AGIs $25k-50k, 75.6% for AGIs $50k-75k, 75.8% for AGIs $75k-100k, 80.0% for AGIs $100k-200k, 86.4% for AGIs over 200k)
Averages for the 2004 tax year for zip code 11971, filed in 2005:
Average Adjusted Gross Income (AGI) in 2004: $73,699 (Individual Income Tax Returns)
Here:
$73,699
State:
$59,519
Salary/wage: $53,273 (reported on 66.7% of returns)
Here:
$53,273
State:
$50,673
(% of AGI for various income ranges: 136.6% for AGIs below $10k, 50.9% for AGIs $10k-25k, 60.9% for AGIs $25k-50k, 52.4% for AGIs $50k-75k, 61.0% for AGIs $75k-100k, 41.3% for AGIs over 100k)
Taxable interest for individuals: $3,074 (reported on 73.3% of returns)
This zip code:
$3,074
New York:
$2,377
(% of AGI for various income ranges: 22.9% for AGIs below $10k, 8.7% for AGIs $10k-25k, 3.9% for AGIs $25k-50k, 3.1% for AGIs $50k-75k, 2.6% for AGIs $75k-100k, 2.5% for AGIs over 100k)
Taxable dividends: $5,724 (reported on 50.2% of returns)
Here:
$5,724
State:
$5,394
(% of AGI for various income ranges: 21.8% for AGIs below $10k, 6.6% for AGIs $10k-25k, 3.9% for AGIs $25k-50k, 3.9% for AGIs $50k-75k, 3.4% for AGIs $75k-100k, 3.7% for AGIs over 100k)
Net capital gain/loss: +$24,276 (reported on 40.2% of returns)
Here:
+$24,276
State:
+$23,581
(% of AGI for various income ranges: -8.9% for AGIs below $10k, -0.6% for AGIs $10k-25k, 1.3% for AGIs $25k-50k, 1.4% for AGIs $50k-75k, 1.8% for AGIs $75k-100k, 21.6% for AGIs over 100k)
Profit/loss from business: +$16,664 (reported on 18.8% of returns)
Here:
+$16,664
State:
+$13,809
(% of AGI for various income ranges: 33.4% for AGIs below $10k, 8.9% for AGIs $10k-25k, 6.3% for AGIs $25k-50k, 5.6% for AGIs $50k-75k, 4.3% for AGIs $75k-100k, 3.0% for AGIs over 100k)
IRA payment deduction: $3,605 (reported on 5.3% of returns)
11971:
$3,605
New York:
$3,115
(% of AGI for various income ranges: 0.6% for AGIs $10k-25k, 0.6% for AGIs $25k-50k, 0.4% for AGIs $50k-75k, 0.4% for AGIs $75k-100k, 0.1% for AGIs over 100k)
Self-employed pension: $15,613 (reported on 2.0% of returns)
Here:
$15,613
New York:
$19,016
(% of AGI for various income ranges: 0.5% for AGIs $50k-75k, 0.4% for AGIs $75k-100k, 0.5% for AGIs over 100k)
Total itemized deductions: $25,455 (23% of AGI, reported on 54.6% of returns)
Here:
$25,455
State:
$25,864
Here:
22.6% of AGI
State:
21.9% of AGI
(% of AGI for various income ranges: 52.2% for AGIs below $10k, 32.0% for AGIs $10k-25k, 21.9% for AGIs $25k-50k, 23.1% for AGIs $50k-75k, 22.1% for AGIs $75k-100k, 15.5% for AGIs over 100k)
Charity contributions deductions: $3,605 (3% of AGI, reported on 51.5% of returns)
Here:
$3,605
State:
$4,439
Here:
3.1% of AGI
State:
3.6% of AGI
(% of AGI for various income ranges: 2.4% for AGIs below $10k, 3.0% for AGIs $10k-25k, 2.1% for AGIs $25k-50k, 2.5% for AGIs $50k-75k, 2.4% for AGIs $75k-100k, 2.6% for AGIs over 100k)
Total tax: $13,000 (reported on 80.0% of returns)
11971:
$13,000
State:
$11,730
(% of AGI for various income ranges: 7.2% for AGIs below $10k, 4.3% for AGIs $10k-25k, 7.2% for AGIs $25k-50k, 9.0% for AGIs $50k-75k, 10.3% for AGIs $75k-100k, 18.0% for AGIs over 100k)
Earned income credit: $1,243 (reported on 5.5% of returns)
Here:
$1,243
State:
$1,757
Percentage of individuals using paid preparers for their 2004 taxes: 73.7%
Here:
74%
State:
67%
(% for various income ranges: 63.8% for AGIs below $10k, 69.6% for AGIs $10k-25k, 69.2% for AGIs $25k-50k, 81.3% for AGIs $50k-75k, 76.2% for AGIs $75k-100k, 84.0% for AGIs over 100k)
Household received Food Stamps/SNAP in the past 12 months: 196 Household did not receive Food Stamps/SNAP in the past 12 months: 2,348
Women who had a birth in the past 12 months: 71 (70 now married, 0 unmarried) Women who did not have a birth in the past 12 months: 806 (577 now married, 215 unmarried)
Housing units in zip code 11971 with a mortgage: 1,113 (120 second mortgage, 71 both second mortgage and home equity loan) Houses without a mortgage: 65
Median monthly owner costs for units with a mortgage: $3,151 Median monthly owner costs for units without a mortgage: $1,025
Residents with income below the poverty level in 2022:
This zip code:
4.1%
Whole state:
14.3%
Residents with income below 50% of the poverty level in 2022:
This zip code:
1.9%
Whole state:
6.8%
Median number of rooms in houses and condos:
Here:
6.4
State:
6.3
Median number of rooms in apartments:
Here:
5.0
State:
3.8
Notable locations in this zip code not listed on our city pages
Notable locations in zip code 11971: Pine Crest Dunes (A), Southold Yacht Club (B), Osprey's Dominion Vineyards (C), Mudd's Vineyard (D), Duck Walk Vineyards (E), Corey Creek Vineyards (F), Horton Lighthouse (G), Southold Town Hall (H), Southold Fire Department (I). Display/hide their locations on the map
Churches in zip code 11971 include: Shiloh Baptist Church (A), Saint Patrick's Roman Catholic Church (B), First Universalist Church (C), First Presbyterian Church (D), First Church of Christ Scientist (E). Display/hide their locations on the map
Cemeteries: Saint Patrick's Cemetery (1), First Presbyterian Church Cemetery (2), Arshamomaque Cemetery (3), Willow Hill Cemetery (4). Display/hide their locations on the map
Parks in zip code 11971 include: South Harbor Park (1), Cedar Beach County Park (2), Goldsmith's Inlet Park (3), Peconic Dunes County Park (4), Founders Landing Park (5), Southold Historic District (6). Display/hide their locations on the map
In group quarters: 49 (-1 institutionalized population)
Size of family households: 938 2-persons, 215 3-persons, 348 4-persons, 221 5-persons, 15 7-or-more-persons
Size of nonfamily households: 622 1-person, 213 2-persons
1,160 married couples with children.
143 single-parent households (74 men, 69 women).
83.3% of residents of 11971 zip code speak English at home.
8.8% of residents speak Spanish at home (50% very well, 17% well, 22% not well, 11% not at all).
5.5% of residents speak other Indo-European language at home (51% very well, 33% well, 16% not well).
2.8% of residents speak Asian or Pacific Island language at home (100% very well).
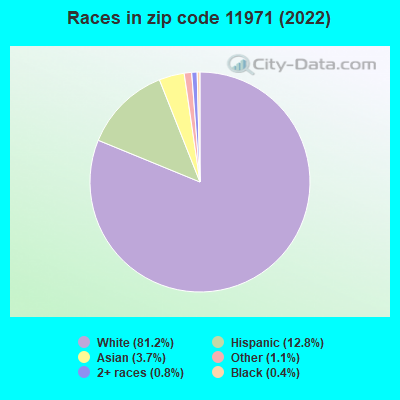
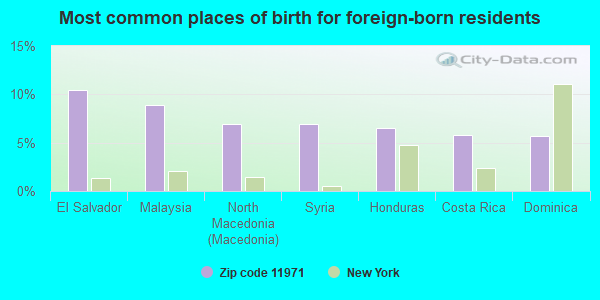
Foreign born population: 865 (14.0%) (65.8% of them are naturalized citizens)
This zip code:
14.0%
Whole state:
22.7%
10%El Salvador
9%Malaysia
7%North Macedonia (Macedonia)
7%Syria
6%Honduras
6%Costa Rica
6%Dominica
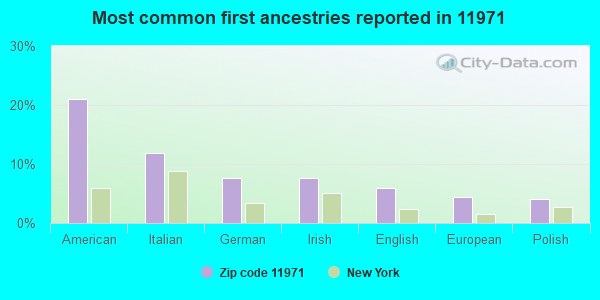
21%American
12%Italian
8%German
8%Irish
6%English
4%European
4%Polish
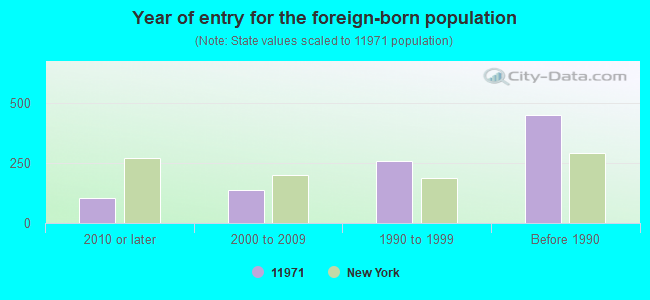
Year of entry for the foreign-born population
1052010 or later
1382000 to 2009
2581990 to 1999
450Before 1990
Facilities with environmental interests located in this zip code:
CONWAY RESIDENCE (1845 HORTONS LANE in SOUTHOLD, NY)
Large Quantity Generators, more that 1000 kg of hazardous waste/month (Resource Conservation and Recovery Act (tracking hazardous waste)) Organizations: ESTATE OF GEORGE T CONWAY (CONTACT/OPERATOR)
ACADEMY PRINTING SVC (HORTONS LN in SOUTHOLD, NY)
(Resource Conservation and Recovery Act (tracking hazardous waste))
CHIERCHIE STEVEN JN DR (WINDSWAY PROFESS CTR RTE 48F in SOUTHOLD, NY)
(Resource Conservation and Recovery Act (tracking hazardous waste))
AGWAY INC (1705 YOUNG AVE in SOUTHOLD, NY)
Conditionally Exempt Small Quantity Generators, less than 100 kg/month of hazardous waste (Resource Conservation and Recovery Act (tracking hazardous waste)) - notification
Housing units lacking complete plumbing facilities: 1.3% Housing units lacking complete kitchen facilities: 1.1%
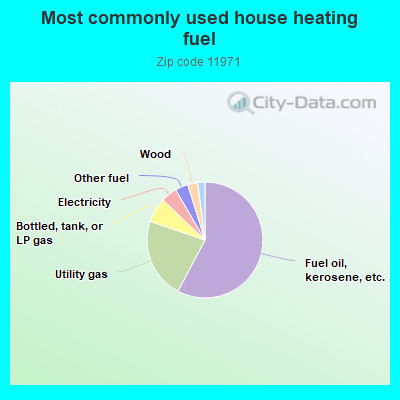
57.8%Fuel oil, kerosene, etc.
22.5%Utility gas
6.9%Bottled, tank, or LP gas
4.5%Electricity
3.6%Other fuel
2.8%Wood
2.0%No fuel used
Population in 1990: 5,788.
Place of birth for U.S.-born residents:
This state: 4,527
Northeast: 285
Midwest: 47
South: 92
West: 250
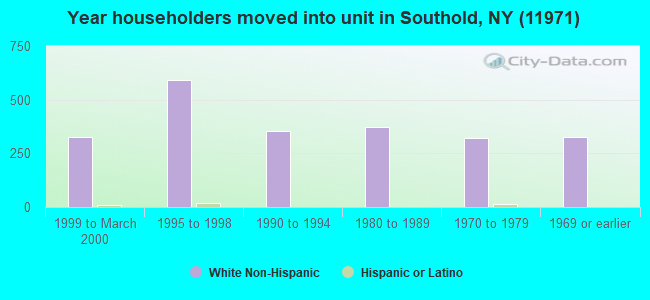
62% of the 11971 zip code residents lived in the same house 5 years ago. Out of people who lived in different houses, 67% lived in this county. Out of people who lived in different counties, 50% lived in New York.
93% of the 11971 zip code residents lived in the same house 1 year ago. Out of people who lived in different houses, 61% moved from this county. Out of people who lived in different houses, 31% moved from different county within same state. Out of people who lived in different houses, 6% moved from different state.
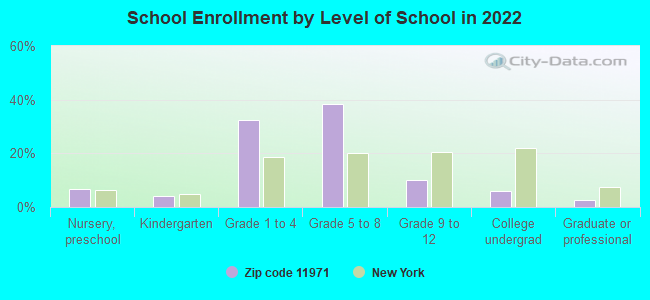
Private vs. public school enrollment:
Students in private schools in grades 1 to 8 (elementary and middle school): 98
Here:
11.0%
New York:
15.6%
Students in private schools in grades 9 to 12 (high school): 15
Here:
12.0%
New York:
15.0%
Students in private undergraduate colleges: 5
Here:
8.0%
New York:
39.2%
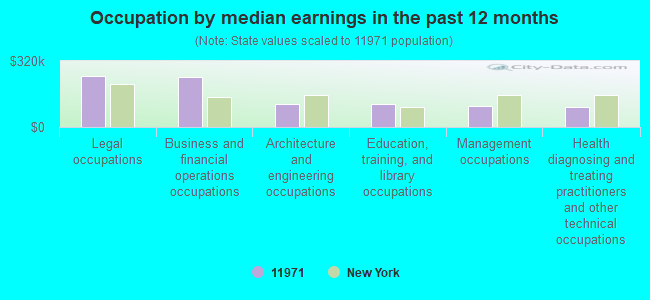
Occupation by median earnings in the past 12 months ($)
247,483Legal occupations
244,758Business and financial operations occupations
113,310Architecture and engineering occupations
112,857Education, training, and library occupations
100,269Management occupations
97,434Health diagnosing and treating practitioners and other technical occupations
Top industries in this zip code by the number of employees in 2005:
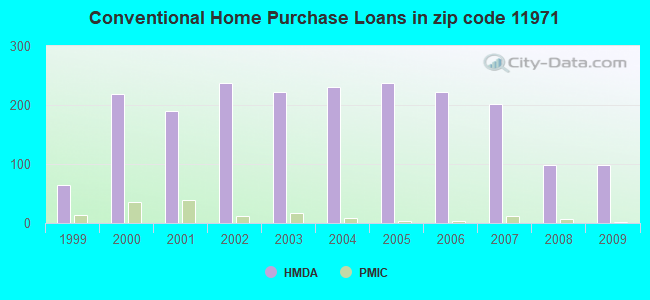
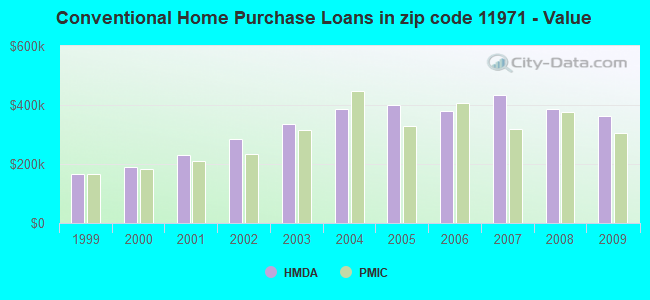
Detailed PMIC statistics for the following Tracts:1702.01
2002 - 2018 National Fire Incident Reporting System (NFIRS) incidents
According to the data from the years 2002 - 2018 the average number of fires per year is 11. The highest number of reported fire incidents - 31 took place in 2006, and the least - 0 in 2003. The data has an increasing trend.
When looking into fire subcategories, the most reports belonged to: Structure Fires (62.6%), and Outside Fires (20.7%).
Fire incident types reported to NFIRS in Zip Code 11971
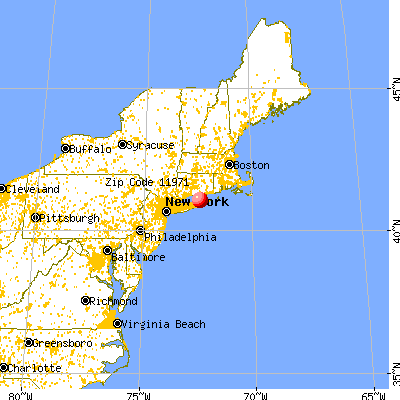


 Nearest zip codes: 11958, 11935, 11944, 11956, 11964, 11939.


 According to the data from the years 2002 - 2018 the average number of fires per year is 11. The highest number of reported fire incidents - 31 took place in 2006, and the least - 0 in 2003. The data has an increasing trend.
 When looking into fire subcategories, the most reports belonged to: Structure Fires (62.6%), and Outside Fires (20.7%).