Estimated zip code population in 2022: 16,725 Zip code population in 2010: 16,918 Zip code population in 2000: 16,421
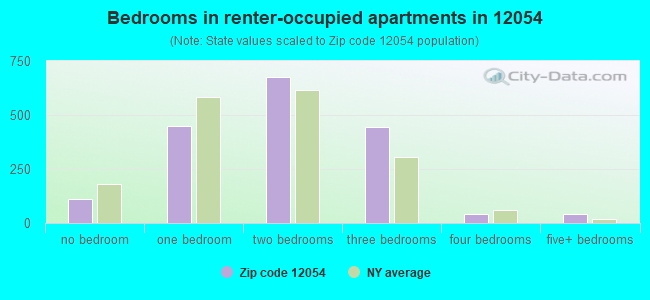
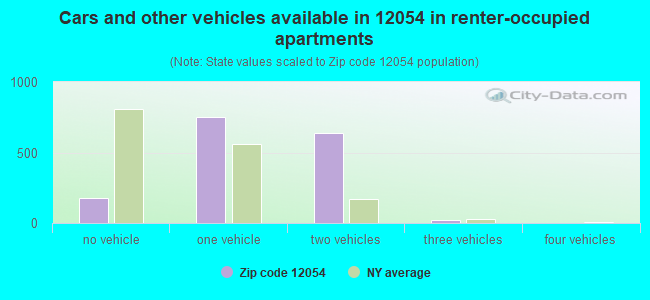
Houses and condos: 7,207 Renter-occupied apartments: 1,589
% of renters here:
22%
State:
46%
March 2022 cost of living index in zip code 12054: 106.3 (more than average, U.S. average is 100)
Land area: 15.4 sq. mi. Water area: 0.0 sq. mi.
Population density: 1,083 people per square mile
(low).
OSM Map
General Map
Google Map
MSN Map
OSM Map
General Map
Google Map
MSN Map
OSM Map
General Map
Google Map
MSN Map
OSM Map
General Map
Google Map
MSN Map
Please wait while loading the map...
Real estate property taxes paid for housing units in 2022:
This zip code:
2.1% ($6,823)
New York:
1.5% ($6,180)
Median real estate property taxes paid for housing units with mortgages in 2022: $6,632 (2.1%) Median real estate property taxes paid for housing units with no mortgage in 2022: $7,582 (2.2%)
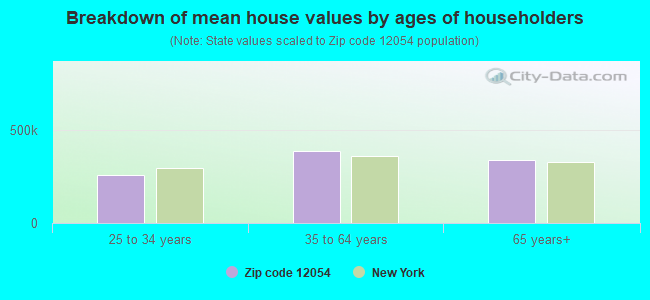
Estimated median house/condo value in 2022: $322,217
12054:
$322,217
New York:
$400,400
According to our research of New York and other state lists, there were 7 registered sex offenders living in 12054 zip code as of April 23, 2024. The ratio of all residents to sex offenders in zip code 12054 is 2,489 to 1. The ratio of registered sex offenders to all residents in this zip code is much lower than the state average.
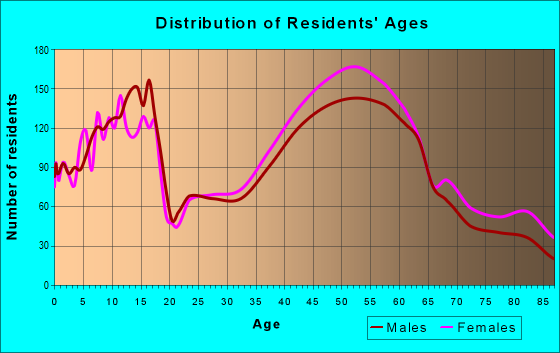
Median resident age:
This zip code:
44.6 years
New York median age:
40.0 years
Average household size:
This zip code:
2.3 people
New York:
2.5 people
Averages for the 2020 tax year for zip code 12054, filed in 2021:
Average Adjusted Gross Income (AGI) in 2020: $109,941 (Individual Income Tax Returns)
Here:
$109,941
State:
$90,930
Salary/wage: $92,558 (reported on 76.7% of returns)
Here:
$92,558
State:
$72,104
(% of AGI for various income ranges: 1167.8% for AGIs below $25k, 3475.6% for AGIs $25k-50k, 6138.2% for AGIs $50k-75k, 8606.6% for AGIs $75k-100k, 17348.4% for AGIs $100k-200k, 79670.3% for AGIs over 200k)
Taxable interest for individuals: $1,309 (reported on 55.3% of returns)
This zip code:
$1,309
New York:
$3,075
(% of AGI for various income ranges: 23.3% for AGIs below $25k, 38.2% for AGIs $25k-50k, 68.6% for AGIs $50k-75k, 88.9% for AGIs $75k-100k, 148.9% for AGIs $100k-200k, 857.6% for AGIs over 200k)
Ordinary dividends: $7,436 (reported on 38.0% of returns)
Here:
$7,436
State:
$11,095
(% of AGI for various income ranges: 70.9% for AGIs below $25k, 99.5% for AGIs $25k-50k, 179.9% for AGIs $50k-75k, 278.6% for AGIs $75k-100k, 556.1% for AGIs $100k-200k, 4011.5% for AGIs over 200k)
Net capital gain/loss in AGI: +$15,054 (reported on 32.9% of returns)
Here:
+$15,054
State:
+$44,925
(% of AGI for various income ranges: 56.7% for AGIs below $25k, 67.5% for AGIs $25k-50k, 113.6% for AGIs $50k-75k, 236.0% for AGIs $75k-100k, 644.4% for AGIs $100k-200k, 9860.9% for AGIs over 200k)
Profit/loss from business: +$25,478 (reported on 14.9% of returns)
Here:
+$25,478
State:
+$14,940
(% of AGI for various income ranges: 70.9% for AGIs below $25k, 78.6% for AGIs $25k-50k, 187.5% for AGIs $50k-75k, 334.3% for AGIs $75k-100k, 739.5% for AGIs $100k-200k, 5874.8% for AGIs over 200k)
Taxable individual retirement arrangement distribution: $19,675 (reported on 14.4% of returns)
12054:
$19,675
New York:
$19,609
(% of AGI for various income ranges: 64.0% for AGIs below $25k, 178.5% for AGIs $25k-50k, 350.5% for AGIs $50k-75k, 407.8% for AGIs $75k-100k, 810.2% for AGIs $100k-200k, 2167.3% for AGIs over 200k)
Self-employed (Keogh) retirement plans: $30,991 (reported on 2.4% of returns)
12054:
$30,991
New York:
$32,497
(% of AGI for various income ranges: 47.2% for AGIs $50k-75k, 59.8% for AGIs $100k-200k, 1715.2% for AGIs over 200k)
Total itemized deductions: $30,334 (reported on 11.7% of returns)
Here:
$30,334
State:
$39,326
(% of AGI for various income ranges: 105.6% for AGIs below $25k, 201.4% for AGIs $25k-50k, 422.3% for AGIs $50k-75k, 612.0% for AGIs $75k-100k, 845.6% for AGIs $100k-200k, 3142.4% for AGIs over 200k)
Charity contributions: $9,505 (reported on 9.4% of returns)
Here:
$9,505
State:
$15,420
(% of AGI for various income ranges: 5.9% for AGIs below $25k, 15.3% for AGIs $25k-50k, 45.1% for AGIs $50k-75k, 72.8% for AGIs $75k-100k, 186.6% for AGIs $100k-200k, 1401.2% for AGIs over 200k)
Taxes paid: $8,787 (reported on 11.5% of returns)
12054:
$8,787
State:
$9,183
(% of AGI for various income ranges: 20.6% for AGIs below $25k, 44.8% for AGIs $25k-50k, 136.1% for AGIs $50k-75k, 215.4% for AGIs $75k-100k, 263.8% for AGIs $100k-200k, 774.5% for AGIs over 200k)
Earned income credit: $1,668 (reported on 4.6% of returns)
Here:
$1,668
State:
$2,138
(% of AGI for various income ranges: 31.1% for AGIs below $25k, 34.5% for AGIs $25k-50k)
Percentage of individuals using paid preparers for their 2020 taxes: 94.0%
Here:
94%
State:
95%
(% for various income ranges: 92.2% for AGIs below $25k, 94.2% for AGIs $25k-50k, 93.8% for AGIs $50k-75k, 93.1% for AGIs $75k-100k, 94.6% for AGIs $100k-200k, 96.5% for AGIs over 200k)
Averages for the 2012 tax year for zip code 12054, filed in 2013:
Average Adjusted Gross Income (AGI) in 2012: $92,367 (Individual Income Tax Returns)
Here:
$92,367
State:
$77,088
Salary/wage: $75,683 (reported on 79.8% of returns)
Here:
$75,683
State:
$60,593
(% of AGI for various income ranges: 67.8% for AGIs below $25k, 72.9% for AGIs $25k-50k, 66.7% for AGIs $50k-75k, 68.9% for AGIs $75k-100k, 72.1% for AGIs $100k-200k, 55.6% for AGIs over 200k)
Taxable interest for individuals: $1,205 (reported on 58.4% of returns)
This zip code:
$1,205
New York:
$3,125
(% of AGI for various income ranges: 2.0% for AGIs below $25k, 0.8% for AGIs $25k-50k, 1.0% for AGIs $50k-75k, 0.7% for AGIs $75k-100k, 0.7% for AGIs $100k-200k, 0.7% for AGIs over 200k)
Ordinary dividends: $5,614 (reported on 40.5% of returns)
Here:
$5,614
State:
$10,299
(% of AGI for various income ranges: 5.0% for AGIs below $25k, 2.1% for AGIs $25k-50k, 2.6% for AGIs $50k-75k, 2.1% for AGIs $75k-100k, 2.0% for AGIs $100k-200k, 2.8% for AGIs over 200k)
Net capital gain/loss in AGI: +$11,954 (reported on 31.1% of returns)
Here:
+$11,954
State:
+$42,474
(% of AGI for various income ranges: 0.5% for AGIs below $25k, 0.5% for AGIs $25k-50k, 0.8% for AGIs $50k-75k, 1.0% for AGIs $75k-100k, 1.3% for AGIs $100k-200k, 9.7% for AGIs over 200k)
Profit/loss from business: +$25,951 (reported on 15.4% of returns)
Here:
+$25,951
State:
+$16,168
(% of AGI for various income ranges: 5.1% for AGIs below $25k, 2.7% for AGIs $25k-50k, 2.6% for AGIs $50k-75k, 3.1% for AGIs $75k-100k, 3.2% for AGIs $100k-200k, 6.6% for AGIs over 200k)
Taxable individual retirement arrangement distribution: $15,639 (reported on 15.0% of returns)
12054:
$15,639
New York:
$17,621
(% of AGI for various income ranges: 4.0% for AGIs below $25k, 2.9% for AGIs $25k-50k, 3.1% for AGIs $50k-75k, 2.8% for AGIs $75k-100k, 2.6% for AGIs $100k-200k, 2.1% for AGIs over 200k)
Self-employment retirement plans: $24,548 (reported on 2.8% of returns)
12054:
$24,548
New York:
$27,330
(% of AGI for various income ranges: 1.0% for AGIs below $25k, 0.3% for AGIs $75k-100k, 0.4% for AGIs $100k-200k, 1.6% for AGIs over 200k)
Total itemized deductions: $26,604 (18% of AGI, reported on 52.2% of returns)
Here:
$26,604
State:
$34,985
Here:
18.4% of AGI
State:
21.3% of AGI
(% of AGI for various income ranges: 14.8% for AGIs below $25k, 13.1% for AGIs $25k-50k, 15.2% for AGIs $50k-75k, 17.0% for AGIs $75k-100k, 16.6% for AGIs $100k-200k, 13.1% for AGIs over 200k)
Charity contributions: $3,165 (reported on 45.8% of returns)
Here:
$3,165
State:
$5,572
(% of AGI for various income ranges: 0.8% for AGIs below $25k, 1.0% for AGIs $25k-50k, 1.3% for AGIs $50k-75k, 1.7% for AGIs $75k-100k, 1.7% for AGIs $100k-200k, 1.6% for AGIs over 200k)
Taxes paid: $15,095 (reported on 51.9% of returns)
12054:
$15,095
State:
$18,656
(% of AGI for various income ranges: 3.6% for AGIs below $25k, 5.1% for AGIs $25k-50k, 7.0% for AGIs $50k-75k, 8.3% for AGIs $75k-100k, 9.4% for AGIs $100k-200k, 9.0% for AGIs over 200k)
Earned income credit: $1,549 (reported on 5.6% of returns)
Here:
$1,549
State:
$2,230
(% of AGI for various income ranges: 2.2% for AGIs below $25k, 0.4% for AGIs $25k-50k)
Percentage of individuals using paid preparers for their 2012 taxes: 53.6%
Here:
54%
State:
66%
(% for various income ranges: 46.1% for AGIs below $25k, 49.6% for AGIs $25k-50k, 55.1% for AGIs $50k-75k, 56.5% for AGIs $75k-100k, 55.9% for AGIs $100k-200k, 73.5% for AGIs over 200k)
Averages for the 2004 tax year for zip code 12054, filed in 2005:
Average Adjusted Gross Income (AGI) in 2004: $73,745 (Individual Income Tax Returns)
Here:
$73,745
State:
$59,519
Salary/wage: $64,155 (reported on 79.1% of returns)
Here:
$64,155
State:
$50,673
(% of AGI for various income ranges: 103.7% for AGIs below $10k, 60.8% for AGIs $10k-25k, 72.2% for AGIs $25k-50k, 72.7% for AGIs $50k-75k, 71.9% for AGIs $75k-100k, 66.6% for AGIs over 100k)
Taxable interest for individuals: $1,666 (reported on 73.5% of returns)
This zip code:
$1,666
New York:
$2,377
(% of AGI for various income ranges: 11.5% for AGIs below $10k, 4.2% for AGIs $10k-25k, 2.4% for AGIs $25k-50k, 1.5% for AGIs $50k-75k, 1.6% for AGIs $75k-100k, 1.3% for AGIs over 100k)
Taxable dividends: $3,323 (reported on 48.2% of returns)
Here:
$3,323
State:
$5,394
(% of AGI for various income ranges: 13.2% for AGIs below $10k, 3.8% for AGIs $10k-25k, 2.3% for AGIs $25k-50k, 2.0% for AGIs $50k-75k, 2.3% for AGIs $75k-100k, 2.0% for AGIs over 100k)
Net capital gain/loss: +$11,721 (reported on 38.7% of returns)
Here:
+$11,721
State:
+$23,581
(% of AGI for various income ranges: -6.7% for AGIs below $10k, 1.9% for AGIs $10k-25k, 0.6% for AGIs $25k-50k, 0.9% for AGIs $50k-75k, 2.1% for AGIs $75k-100k, 9.6% for AGIs over 100k)
Profit/loss from business: +$18,495 (reported on 16.1% of returns)
Here:
+$18,495
State:
+$13,809
(% of AGI for various income ranges: 4.4% for AGIs below $10k, 5.4% for AGIs $10k-25k, 2.9% for AGIs $25k-50k, 3.2% for AGIs $50k-75k, 3.3% for AGIs $75k-100k, 4.5% for AGIs over 100k)
IRA payment deduction: $2,965 (reported on 3.0% of returns)
12054:
$2,965
New York:
$3,115
(% of AGI for various income ranges: 0.4% for AGIs below $10k, 0.3% for AGIs $10k-25k, 0.3% for AGIs $25k-50k, 0.2% for AGIs $50k-75k, 0.1% for AGIs $75k-100k, 0.0% for AGIs over 100k)
Self-employed pension: $17,698 (reported on 3.1% of returns)
Here:
$17,698
New York:
$19,016
(% of AGI for various income ranges: 0.1% for AGIs $25k-50k, 0.2% for AGIs $50k-75k, 0.4% for AGIs $75k-100k, 1.1% for AGIs over 100k)
Total itemized deductions: $21,522 (18% of AGI, reported on 50.4% of returns)
Here:
$21,522
State:
$25,864
Here:
17.9% of AGI
State:
21.9% of AGI
(% of AGI for various income ranges: 13.1% for AGIs below $10k, 12.5% for AGIs $10k-25k, 13.1% for AGIs $25k-50k, 16.0% for AGIs $50k-75k, 17.0% for AGIs $75k-100k, 14.3% for AGIs over 100k)
Charity contributions deductions: $3,342 (3% of AGI, reported on 47.1% of returns)
Here:
$3,342
State:
$4,439
Here:
2.7% of AGI
State:
3.6% of AGI
(% of AGI for various income ranges: 0.7% for AGIs below $10k, 1.0% for AGIs $10k-25k, 1.3% for AGIs $25k-50k, 1.9% for AGIs $50k-75k, 2.3% for AGIs $75k-100k, 2.3% for AGIs over 100k)
Total tax: $13,108 (reported on 83.5% of returns)
12054:
$13,108
State:
$11,730
(% of AGI for various income ranges: 3.8% for AGIs below $10k, 4.9% for AGIs $10k-25k, 8.0% for AGIs $25k-50k, 9.5% for AGIs $50k-75k, 10.4% for AGIs $75k-100k, 18.8% for AGIs over 100k)
Earned income credit: $1,291 (reported on 4.1% of returns)
Here:
$1,291
State:
$1,757
Percentage of individuals using paid preparers for their 2004 taxes: 54.4%
Here:
54%
State:
67%
(% for various income ranges: 49.3% for AGIs below $10k, 54.0% for AGIs $10k-25k, 52.2% for AGIs $25k-50k, 55.6% for AGIs $50k-75k, 53.6% for AGIs $75k-100k, 60.5% for AGIs over 100k)
Likely homosexual households (counted as self-reported same-sex unmarried-partner households)
Lesbian couples: 0.1% of all households
Gay men: 0.0% of all households
Household received Food Stamps/SNAP in the past 12 months: 161 Household did not receive Food Stamps/SNAP in the past 12 months: 6,844
Women who had a birth in the past 12 months: 179 (155 now married, 22 unmarried) Women who did not have a birth in the past 12 months: 3,502 (1,511 now married, 1,979 unmarried)
Housing units in zip code 12054 with a mortgage: 3,664 (592 second mortgage, 550 both second mortgage and home equity loan) Houses without a mortgage: 571
Median monthly owner costs for units with a mortgage: $1,988 Median monthly owner costs for units without a mortgage: $995
Residents with income below the poverty level in 2022:
This zip code:
3.3%
Whole state:
14.3%
Residents with income below 50% of the poverty level in 2022:
This zip code:
1.2%
Whole state:
6.8%
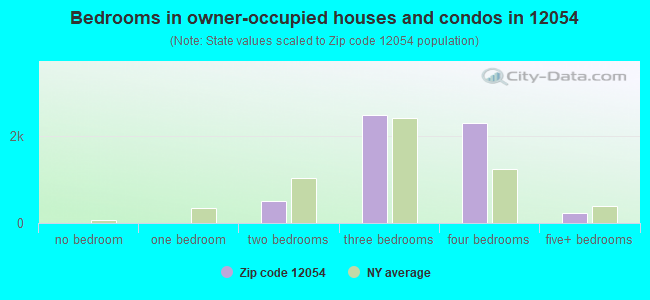
Median number of rooms in houses and condos:
Here:
7.2
State:
6.3
Median number of rooms in apartments:
Here:
4.4
State:
3.8
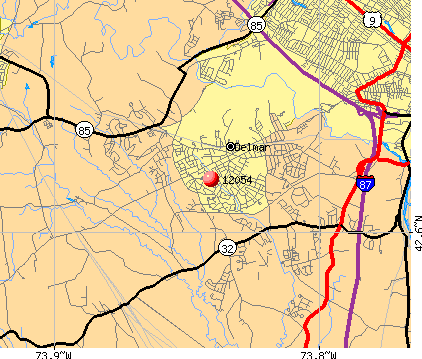
Notable locations in this zip code not listed on our city pages
Notable locations in zip code 12054: Normanside Country Club (A), Sleigh Bell Farm (B), Elsmere Fire District (C), Delmar Fire District (D), Delmar Fire District Station 2 (E). Display/hide their locations on the map
Churches in zip code 12054 include: Unionville Reformed Church (A), Saint Thomas The Apostle Church (B), Saint Stephen's Episcopal Church (C), First United Methodist Church (D), First Church of Christ (E), Delmar Reformed Church (F), Delmar Presbyterian Church (G), Delmar Full Gospel Church (H), Bethlehem Lutheran Church (I). Display/hide their locations on the map
2,490 married couples with children.
733 single-parent households (195 men, 538 women).
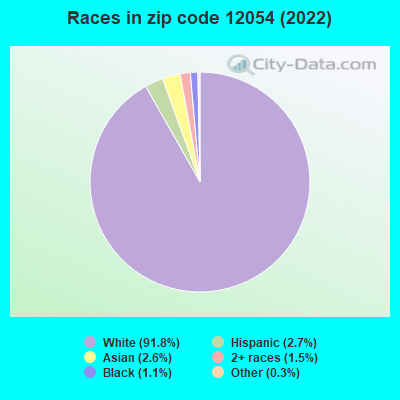
94.7% of residents of 12054 zip code speak English at home.
1.1% of residents speak Spanish at home (82% very well, 18% well).
2.3% of residents speak other Indo-European language at home (89% very well, 8% well, 3% not well).
1.6% of residents speak Asian or Pacific Island language at home (58% very well, 5% well, 38% not well).
0.3% of residents speak other language at home (44% very well, 16% well, 40% not well).
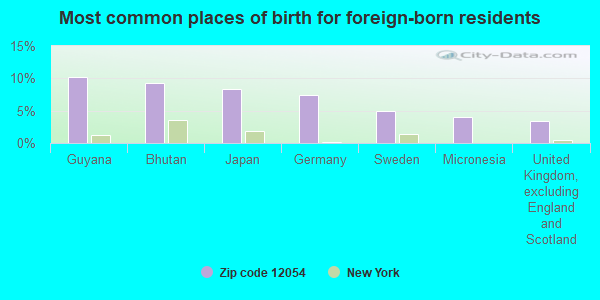
Foreign born population: 852 (5.1%) (82.3% of them are naturalized citizens)
This zip code:
5.1%
Whole state:
22.7%
10%Guyana
9%Bhutan
8%Japan
7%Germany
5%Sweden
4%Micronesia
3%United Kingdom, excluding England and Scotland
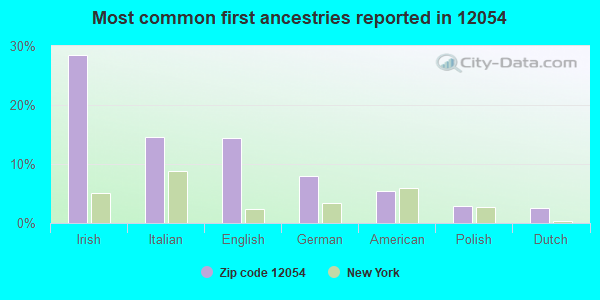
28%Irish
15%Italian
14%English
8%German
5%American
3%Polish
3%Dutch
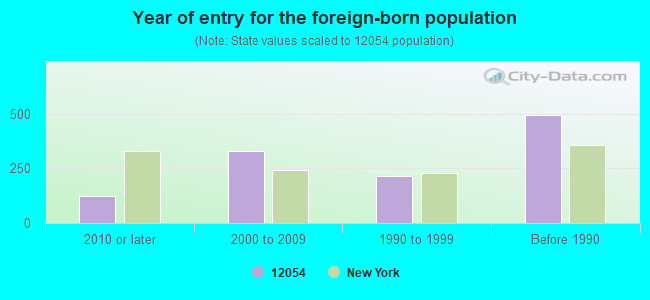
Year of entry for the foreign-born population
1222010 or later
3292000 to 2009
2171990 to 1999
495Before 1990
Major facilities with environmental interests located in this zip code:
HANDY DANDY CLEANERS (240 DELAWARE AVE in DELMAR, NY)
AIR SYNTHETIC MINOR (AIRS/AFS) STATE MASTER (New York facility tracking) - AIR PROGRAM Small Quantity Generators, between 100 kg and 1000 kg of hazardous waste/month (Resource Conservation and Recovery Act (tracking hazardous waste)) - notification TRANSPORTER (Resource Conservation and Recovery Act (tracking hazardous waste)) - notification Business SIC classification: DRYCLEANING PLANTS, EXCEPT RUG CLEANING Business NAICS classification: DRYCLEANING AND LAUNDRY SERVICES (EXCEPT COIN-OPERATED). Organizations: DAVID BEZJIAN (CONTACT/OWNER)
H LOUCKS BODY & FENDER WORKS INC (788 DELAWARE AVE in DELMAR, NY)
STATE MASTER (New York facility tracking) - AIR PROGRAM, HAZARDOUS WASTE PROGRAM Small Quantity Generators, between 100 kg and 1000 kg of hazardous waste/month (Resource Conservation and Recovery Act (tracking hazardous waste)) - notification Organizations: HOWARD LOUCKS (CONTACT/OWNER)
Alternative names: H LOUCKS BODY & FENDER INC
HAMAGRAEL ES ( in DELMAR, NY)
(National Center for Education Statistics) - STATE ID-010306060005 Organizations: BETHLEHEM CSD (SCHOOL DISTRICT)
BETHLEHEM CENTRAL MS ( in DELMAR, NY)
(National Center for Education Statistics) - STATE ID-010306060007 Organizations: BETHLEHEM CSD (SCHOOL DISTRICT)
BETHLEHEM CENTRAL SHS ( in DELMAR, NY)
(National Center for Education Statistics) - STATE ID-010306060008 Organizations: BETHLEHEM CSD (SCHOOL DISTRICT)
BETHLEHEM (T) SD WPCP CEDAR (445 DELAWARE AVENUE in DELMAR, NY)
CRITERIA AND HAZARDOUS AIR POLLUTANT INVENTORY (Inventory of air pollution sources) National Pollutant Discharge Elimination System MAJOR (Tracking pollutant discharge elimination systems) - permit Conditionally Exempt Small Quantity Generators, less than 100 kg/month of hazardous waste (Resource Conservation and Recovery Act (tracking hazardous waste)) Business SIC classification: SEWERAGE SYSTEMS; REFUSE SYSTEMS Business NAICS classification: SOLID WASTE LANDFILL. Alternative names: BETHLEHEM Sewage District Water Pollution control plant CEDAR, BETHLEHEM TOWN HALL
CHEVRON 204181 (624 DELAWARE AVE in DELMAR, NY)
Large Quantity Generators, more that 1000 kg of hazardous waste/month (Resource Conservation and Recovery Act (tracking hazardous waste)) Organizations: STEWARTS SHOP (CONTACT/OPERATOR)
BEST CLEANERS ELSMERE (156 DELAWARE AVE in ELSMERE, NY)
AIR MINOR (AIRS/AFS) Small Quantity Generators, between 100 kg and 1000 kg of hazardous waste/month (Resource Conservation and Recovery Act (tracking hazardous waste)) Business SIC classification: DRYCLEANING PLANTS, EXCEPT RUG CLEANING Alternative names: ROXY UNITED CLEANERS
HOSTETTER SUNOCO (594 DELAWARE AVE in DELMAR, NY)
(Resource Conservation and Recovery Act (tracking hazardous waste))
CRISAFULLI FRANK (500 KENWOOD AVE in DELMAR, NY)
(Resource Conservation and Recovery Act (tracking hazardous waste))
BETHLEHEM CENTRAL SCHOOL DIST (65 ELM AVE in DELMAR, NY)
COMPLIANCE ACTIVITY (Tracking inspections of insecticide, fungicide, and rodenticide, and toxic substances) Conditionally Exempt Small Quantity Generators, less than 100 kg/month of hazardous waste (Resource Conservation and Recovery Act (tracking hazardous waste)) - notification Alternative names: BETHLEHEM CENTRAL SCHOOL DISTRICT
BETHLEHEM SR HIGH SCHOOL (700 DELAWARE AVE in DELMAR, NY)
AIR MINOR (AIRS/AFS) Business SIC classification: ELEMENTARY AND SECONDARY SCHOOLS Alternative names: BETHLEHEM SCHL DIST
BETHLEHEM TOWN OF DPW SERVICE GARAGE (308 KENWOOD AVE in DELMAR, NY)
Small Quantity Generators, between 100 kg and 1000 kg of hazardous waste/month (Resource Conservation and Recovery Act (tracking hazardous waste)) Organizations: CHUCK WICKHAM (CONTACT/OPERATOR)
, UNKNOWN (CONTACT/OWNER)
Housing units lacking complete plumbing facilities: 0.2% Housing units lacking complete kitchen facilities: 1.6%
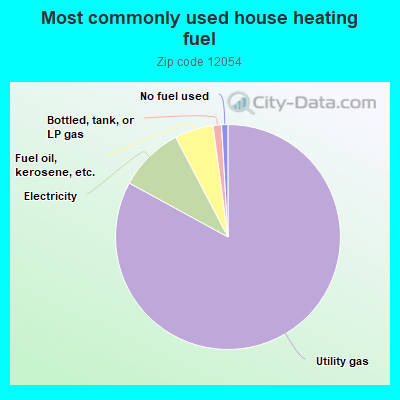
82.3%Utility gas
9.3%Electricity
5.5%Fuel oil, kerosene, etc.
1.2%Bottled, tank, or LP gas
0.9%No fuel used
Population in 1990: 15,502. Population change in the 1990s: +919 (+5.9%).
Place of birth for U.S.-born residents:
This state: 11,708
Northeast: 1,913
Midwest: 736
South: 754
West: 404
67% of the 12054 zip code residents lived in the same house 5 years ago. Out of people who lived in different houses, 63% lived in this county. Out of people who lived in different counties, 50% lived in New York.
90% of the 12054 zip code residents lived in the same house 1 year ago. Out of people who lived in different houses, 56% moved from this county. Out of people who lived in different houses, 24% moved from different county within same state. Out of people who lived in different houses, 16% moved from different state. Out of people who lived in different houses, 4% moved from abroad.
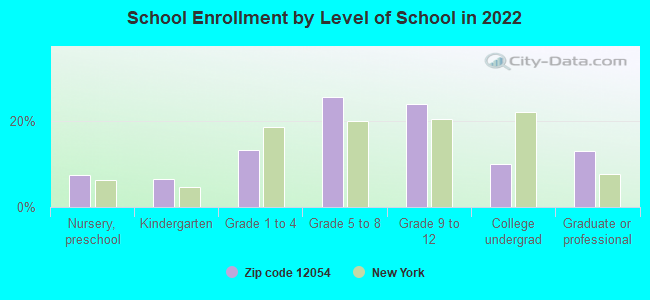
Private vs. public school enrollment:
Students in private schools in grades 1 to 8 (elementary and middle school): 98
Here:
6.5%
New York:
15.6%
Students in private schools in grades 9 to 12 (high school): 65
Here:
7.0%
New York:
15.0%
Students in private undergraduate colleges: 120
Here:
30.8%
New York:
39.2%
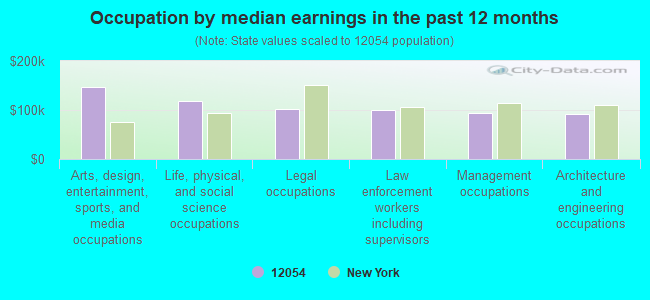
Occupation by median earnings in the past 12 months ($)
147,206Arts, design, entertainment, sports, and media occupations
118,249Life, physical, and social science occupations
101,385Legal occupations
99,545Law enforcement workers including supervisors
93,582Management occupations
91,824Architecture and engineering occupations
Companies with federal contracts located in this zip code (DELMAR, NY):
DA BENNETT INC (341 DELEWARE AVE; small business) : $108,600 in 2 contractsfrom 2001 to 2003
$68,600 with Navy for Construction of Structures and Facilities -- Other Non-Building Facilities. Signed on 2001-09-18. Completion date: 2001-11-02.
$40,000 with Army for Maintenance, Repair or Alteration of Real Property -- Food or Grain Storage Buildings. Signed on 2003-06-18. Completion date: 2003-07-25.
TELECOMMUNICATIONS ANALYSIS GR (266 DELAWARE AVENUE; small business)
$48,567 with Army for ADP Telecommunications and Transmission Services. Signed on 2000-06-06. Completion date: 2000-08-31.
WILLIAM HOWARD (155 CHERRY AVE; small business) : $13,506 in 3 contractsfrom 2005 to 2006
$5,740 with Army for Miscellaneous Maintenance and Repair Shop Specialized Equipment. Signed on 2005-12-27. Completion date: 2006-01-31.
$3,971 with Army for Sewage Treatment Equipment. Signed on 2005-03-15. Completion date: 2005-04-11.
$3,795 with Army for Miscellaneous Special Industry Machinery. Signed on 2006-04-12. Completion date: 2006-05-25.
FIERRO REALTY SERVICES INC (114A E POPLAR DR; small business)
$12,500 with U.S. Army Corps of Engineers - civil program financing only for Real Property Appraisals Services (SIC 6531). Taking place in MA. Signed on 2002-11-20. Completion date: 2003-01-03.
Top industries in this zip code by the number of employees in 2005:
2002 - 2018 National Fire Incident Reporting System (NFIRS) incidents
Based on the data from the years 2002 - 2018 the average number of fires per year is 33. The highest number of fire incidents - 58 took place in 2006, and the least - 21 in 2011. The data has a declining trend.
When looking into fire subcategories, the most incidents belonged to: Structure Fires (40.7%), and Outside Fires (27.9%).
Fire incident types reported to NFIRS in Zip Code 12054


 Nearest zip codes: 12159, 12208, 12203, 12161, 12067, 12158.
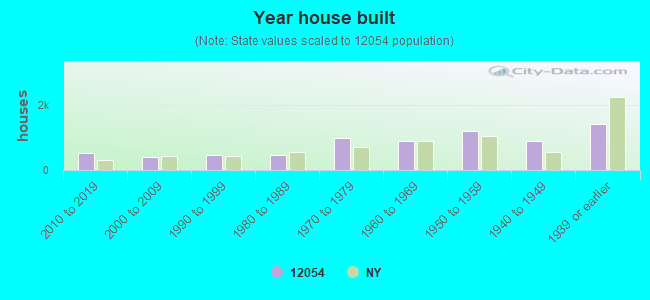


 Based on the data from the years 2002 - 2018 the average number of fires per year is 33. The highest number of fire incidents - 58 took place in 2006, and the least - 21 in 2011. The data has a declining trend.
 When looking into fire subcategories, the most incidents belonged to: Structure Fires (40.7%), and Outside Fires (27.9%).