Estimated zip code population in 2022: 1,258 Zip code population in 2010: 1,073 Zip code population in 2000: 504
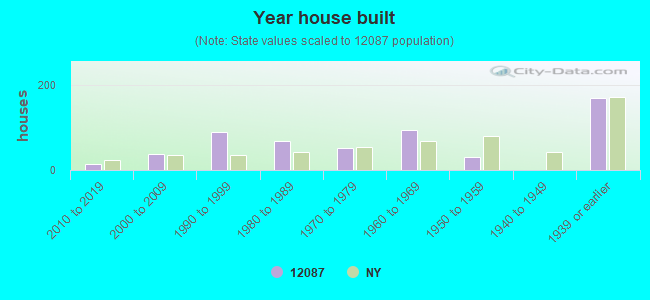
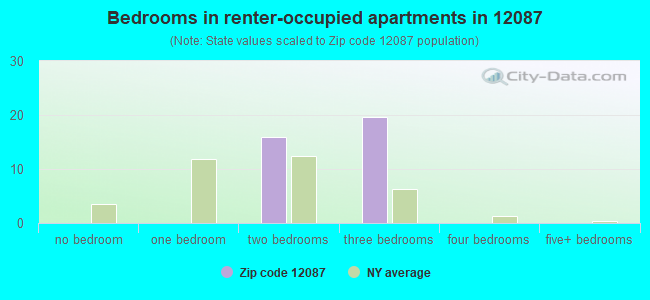
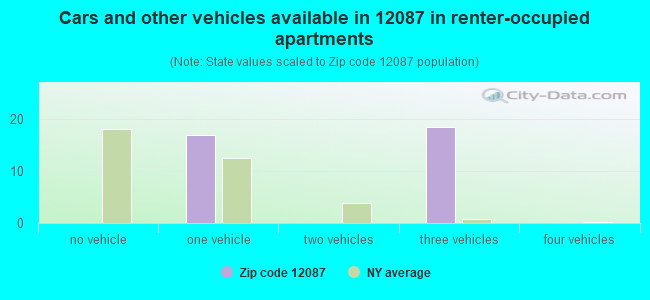
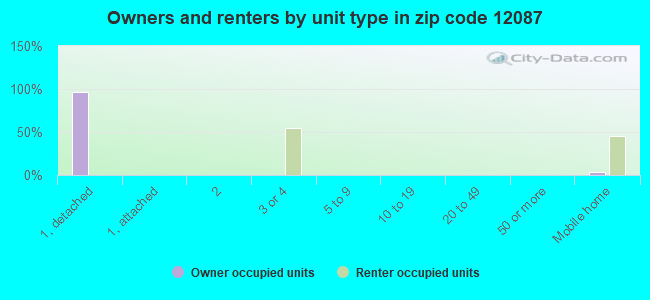
Houses and condos: 560 Renter-occupied apartments: 35
% of renters here:
8%
State:
46%
March 2022 cost of living index in zip code 12087: 93.5 (less than average, U.S. average is 100)
Land area: 19.7 sq. mi. Water area: 0.3 sq. mi.
Population density: 64 people per square mile
(very low).
OSM Map
General Map
Google Map
MSN Map
OSM Map
General Map
Google Map
MSN Map
OSM Map
General Map
Google Map
MSN Map
OSM Map
General Map
Google Map
MSN Map
Please wait while loading the map...
Real estate property taxes paid for housing units in 2022:
This zip code:
1.9% ($4,608)
New York:
1.5% ($6,180)
Median real estate property taxes paid for housing units with mortgages in 2022: $4,624 (1.6%) Median real estate property taxes paid for housing units with no mortgage in 2022: $4,633 (2.1%)
Business Search- 14 Million verified businesses
Males: 710
(56.5%)
Females: 548
(43.5%)
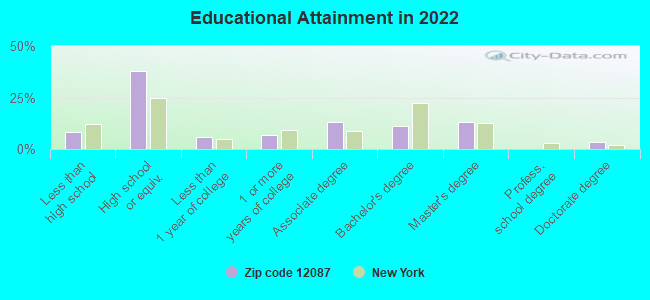
For population 25 years and over in 12087:
High school or higher: 91.8%
Bachelor's degree or higher: 28.1%
Graduate or professional degree: 16.8%
Mean travel time to work (commute): 28.4 minutes
For population 15 years and over in 12087:
Never married: 28.4%
Now married: 67.3%
Separated: 0.0%
Widowed: 0.0%
Divorced: 4.3%
Zip code 12087 compared to state average:
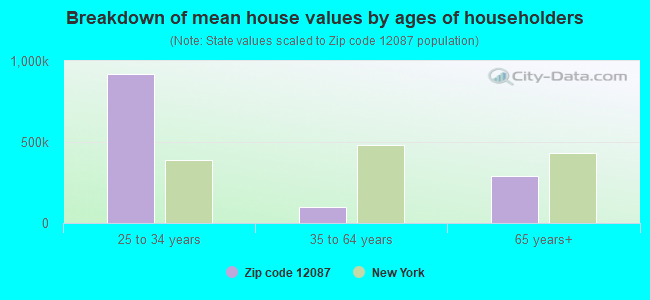
Median house value below state average.
Unemployed percentage significantly below state average.
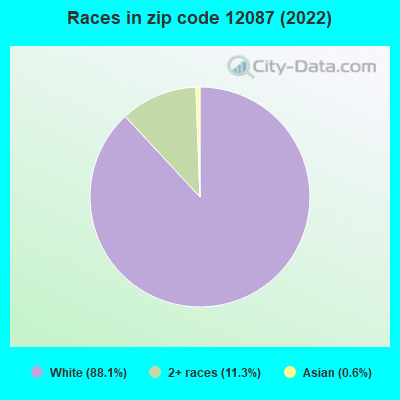
Black race population percentage significantly below state average.
Hispanic race population percentage significantly below state average.
Median age above state average.
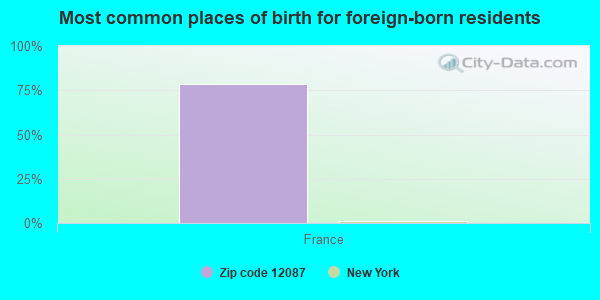
Foreign-born population percentage significantly below state average.
Renting percentage significantly below state average.
Length of stay since moving in significantly above state average.
Averages for the 2020 tax year for zip code 12087, filed in 2021:
Average Adjusted Gross Income (AGI) in 2020: $65,323 (Individual Income Tax Returns)
Here:
$65,323
State:
$90,930
Salary/wage: $57,721 (reported on 77.4% of returns)
Here:
$57,721
State:
$72,104
(% of AGI for various income ranges: 972.7% for AGIs below $25k, 3160.8% for AGIs $25k-50k, 6020.0% for AGIs $50k-75k, 9066.7% for AGIs $75k-100k, 21455.0% for AGIs $100k-200k)
Taxable interest for individuals: $519 (reported on 51.6% of returns)
This zip code:
$519
New York:
$3,075
(% of AGI for various income ranges: 9.1% for AGIs below $25k, 25.4% for AGIs $25k-50k, 31.4% for AGIs $50k-75k, 53.3% for AGIs $75k-100k, 115.0% for AGIs $100k-200k)
Ordinary dividends: $2,769 (reported on 21.0% of returns)
Here:
$2,769
State:
$11,095
(% of AGI for various income ranges: 22.7% for AGIs below $25k, 7.7% for AGIs $25k-50k, 98.6% for AGIs $50k-75k, 426.7% for AGIs $100k-200k)
Net capital gain/loss in AGI: +$6,180 (reported on 16.1% of returns)
Here:
+$6,180
State:
+$44,925
(% of AGI for various income ranges: 41.5% for AGIs $25k-50k, 182.9% for AGIs $50k-75k, 726.7% for AGIs $100k-200k)
Profit/loss from business: +$14,543 (reported on 11.3% of returns)
Here:
+$14,543
State:
+$14,940
(% of AGI for various income ranges: 212.3% for AGIs $25k-50k, 1236.7% for AGIs $75k-100k)
Taxable individual retirement arrangement distribution: $11,000 (reported on 11.3% of returns)
12087:
$11,000
New York:
$19,609
(% of AGI for various income ranges: 218.5% for AGIs $25k-50k, 810.0% for AGIs $75k-100k)
Total itemized deductions: $20,350 (reported on 6.5% of returns)
Here:
$20,350
State:
$39,326
(% of AGI for various income ranges: 1356.7% for AGIs $75k-100k)
Taxes paid: $7,875 (reported on 6.5% of returns)
12087:
$7,875
State:
$9,183
(% of AGI for various income ranges: 525.0% for AGIs $75k-100k)
Earned income credit: $1,843 (reported on 11.3% of returns)
Here:
$1,843
State:
$2,138
(% of AGI for various income ranges: 66.4% for AGIs below $25k, 43.1% for AGIs $25k-50k)
Percentage of individuals using paid preparers for their 2020 taxes: 96.8%
Here:
97%
State:
95%
(% for various income ranges: 87.5% for AGIs below $25k, 100.0% for AGIs $25k-50k, 100.0% for AGIs $50k-75k, 100.0% for AGIs $75k-100k, 100.0% for AGIs $100k-200k)
Averages for the 2012 tax year for zip code 12087, filed in 2013:
Average Adjusted Gross Income (AGI) in 2012: $50,479 (Individual Income Tax Returns)
Here:
$50,479
State:
$77,088
Salary/wage: $47,806 (reported on 77.8% of returns)
Here:
$47,806
State:
$60,593
(% of AGI for various income ranges: 62.8% for AGIs below $25k, 73.8% for AGIs $25k-50k, 72.7% for AGIs $50k-75k, 69.2% for AGIs $75k-100k, 79.3% for AGIs $100k-200k)
Taxable interest for individuals: $616 (reported on 50.8% of returns)
This zip code:
$616
New York:
$3,125
(% of AGI for various income ranges: 1.1% for AGIs below $25k, 0.5% for AGIs $25k-50k, 1.1% for AGIs $50k-75k, 0.6% for AGIs $75k-100k, 0.3% for AGIs $100k-200k)
Ordinary dividends: $1,808 (reported on 20.6% of returns)
Here:
$1,808
State:
$10,299
(% of AGI for various income ranges: 3.4% for AGIs below $25k, 0.3% for AGIs $25k-50k, 0.5% for AGIs $50k-75k, 0.5% for AGIs $75k-100k, 0.6% for AGIs $100k-200k)
Net capital gain/loss in AGI: +$1,088 (reported on 12.7% of returns)
Here:
+$1,088
State:
+$42,474
(% of AGI for various income ranges: 1.1% for AGIs $50k-75k, 0.1% for AGIs $100k-200k)
Profit/loss from business: +$4,720 (reported on 15.9% of returns)
Here:
+$4,720
State:
+$16,168
(% of AGI for various income ranges: 5.7% for AGIs below $25k, 5.2% for AGIs $25k-50k, 1.1% for AGIs $75k-100k)
Taxable individual retirement arrangement distribution: $8,217 (reported on 9.5% of returns)
12087:
$8,217
New York:
$17,621
Total itemized deductions: $19,080 (21% of AGI, reported on 31.7% of returns)
Here:
$19,080
State:
$34,985
Here:
20.7% of AGI
State:
21.3% of AGI
(% of AGI for various income ranges: 11.8% for AGIs $25k-50k, 10.5% for AGIs $50k-75k, 14.6% for AGIs $75k-100k, 14.6% for AGIs $100k-200k)
Charity contributions: $1,860 (reported on 23.8% of returns)
Here:
$1,860
State:
$5,572
(% of AGI for various income ranges: 0.5% for AGIs $25k-50k, 0.8% for AGIs $50k-75k, 0.7% for AGIs $75k-100k, 1.4% for AGIs $100k-200k)
Taxes paid: $10,060 (reported on 31.7% of returns)
12087:
$10,060
State:
$18,656
(% of AGI for various income ranges: 5.5% for AGIs $25k-50k, 4.7% for AGIs $50k-75k, 7.5% for AGIs $75k-100k, 8.6% for AGIs $100k-200k)
Earned income credit: $2,033 (reported on 9.5% of returns)
Here:
$2,033
State:
$2,230
(% of AGI for various income ranges: 4.7% for AGIs below $25k)
Percentage of individuals using paid preparers for their 2012 taxes: 63.5%
Here:
63%
State:
66%
(% for various income ranges: 63.6% for AGIs below $25k, 57.1% for AGIs $25k-50k, 66.7% for AGIs $50k-75k, 71.4% for AGIs $75k-100k, 62.5% for AGIs $100k-200k)
Averages for the 2004 tax year for zip code 12087, filed in 2005:
Average Adjusted Gross Income (AGI) in 2004: $42,988 (Individual Income Tax Returns)
Here:
$42,988
State:
$59,519
Salary/wage: $40,935 (reported on 82.6% of returns)
Here:
$40,935
State:
$50,673
(% of AGI for various income ranges: 68.5% for AGIs below $10k, 65.0% for AGIs $10k-25k, 79.8% for AGIs $25k-50k, 81.6% for AGIs $50k-75k, 85.9% for AGIs $75k-100k, 74.1% for AGIs over 100k)
Taxable interest for individuals: $916 (reported on 56.1% of returns)
This zip code:
$916
New York:
$2,377
(% of AGI for various income ranges: 7.0% for AGIs below $10k, 2.8% for AGIs $10k-25k, 1.9% for AGIs $25k-50k, 0.9% for AGIs $50k-75k, 0.3% for AGIs $75k-100k, 0.4% for AGIs over 100k)
Taxable dividends: $1,640 (reported on 26.1% of returns)
Here:
$1,640
State:
$5,394
(% of AGI for various income ranges: 7.0% for AGIs below $10k, 0.6% for AGIs $10k-25k, 0.5% for AGIs $25k-50k, 0.2% for AGIs $50k-75k, 0.5% for AGIs $75k-100k, 2.5% for AGIs over 100k)
Net capital gain/loss: +$1,546 (reported on 16.9% of returns)
Here:
+$1,546
State:
+$23,581
(% of AGI for various income ranges: -6.1% for AGIs below $10k, -0.8% for AGIs $10k-25k, 0.1% for AGIs $25k-50k, 0.1% for AGIs $50k-75k, -0.1% for AGIs $75k-100k, 3.3% for AGIs over 100k)
Profit/loss from business: +$6,469 (reported on 14.1% of returns)
Here:
+$6,469
State:
+$13,809
(% of AGI for various income ranges: 9.4% for AGIs $10k-25k, 3.9% for AGIs $25k-50k, 1.2% for AGIs $50k-75k, 0.7% for AGIs $75k-100k)
IRA payment deduction: $3,043 (reported on 4.0% of returns)
12087:
$3,043
New York:
$3,115
Total itemized deductions: $14,318 (20% of AGI, reported on 33.4% of returns)
Here:
$14,318
State:
$25,864
Here:
19.7% of AGI
State:
21.9% of AGI
(% of AGI for various income ranges: 8.6% for AGIs $10k-25k, 5.7% for AGIs $25k-50k, 12.3% for AGIs $50k-75k, 15.4% for AGIs $75k-100k, 14.1% for AGIs over 100k)
Charity contributions deductions: $1,703 (2% of AGI, reported on 30.5% of returns)
Here:
$1,703
State:
$4,439
Here:
2.3% of AGI
State:
3.6% of AGI
(% of AGI for various income ranges: 1.6% for AGIs below $10k, 0.5% for AGIs $25k-50k, 1.2% for AGIs $50k-75k, 2.1% for AGIs $75k-100k, 1.7% for AGIs over 100k)
Total tax: $5,156 (reported on 81.4% of returns)
12087:
$5,156
State:
$11,730
(% of AGI for various income ranges: 2.1% for AGIs below $10k, 5.3% for AGIs $10k-25k, 8.0% for AGIs $25k-50k, 9.0% for AGIs $50k-75k, 10.4% for AGIs $75k-100k, 14.2% for AGIs over 100k)
Earned income credit: $1,373 (reported on 8.9% of returns)
Here:
$1,373
State:
$1,757
Percentage of individuals using paid preparers for their 2004 taxes: 62.5%
Here:
63%
State:
67%
(% for various income ranges: 56.8% for AGIs below $10k, 63.0% for AGIs $10k-25k, 62.0% for AGIs $25k-50k, 66.1% for AGIs $50k-75k, 66.7% for AGIs $75k-100k, 62.2% for AGIs over 100k)
Household received Food Stamps/SNAP in the past 12 months: 13 Household did not receive Food Stamps/SNAP in the past 12 months: 430
Women who had a birth in the past 12 months: 9 (9 now married, 0 unmarried) Women who did not have a birth in the past 12 months: 162 (99 now married, 61 unmarried)
Housing units in zip code 12087 with a mortgage: 204 (6 second mortgage, 6 both second mortgage and home equity loan) Houses without a mortgage: 28
Median monthly owner costs for units with a mortgage: $1,768 Median monthly owner costs for units without a mortgage: $746
Residents with income below the poverty level in 2022:
This zip code:
1.9%
Whole state:
14.3%
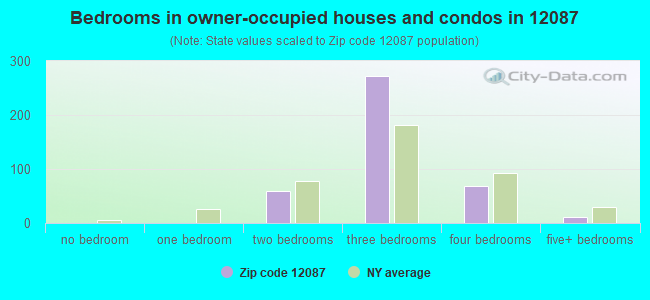
Median number of rooms in houses and condos:
Here:
6.1
State:
6.3
Notable locations in this zip code not listed on our city pages
Size of family households: 177 2-persons, 91 3-persons, 112 4-persons, 19 5-persons
Size of nonfamily households: 29 1-person, 14 2-persons
184 married couples with children.
0 single-parent households ().
95.9% of residents of 12087 zip code speak English at home.
0.4% of residents speak Spanish at home (100% very well).
3.2% of residents speak other Indo-European language at home (28% very well, 72% well).
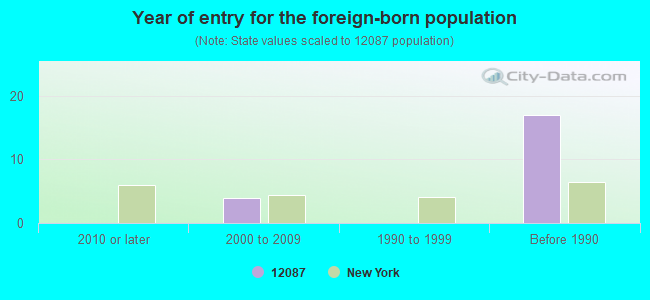
Foreign born population: 24 (1.9%) (100.0% of them are naturalized citizens)
This zip code:
1.9%
Whole state:
22.7%
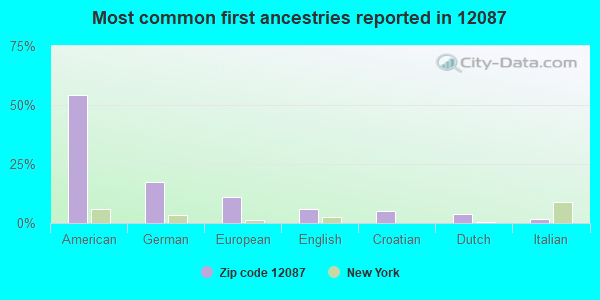
78%France
54%American
17%German
11%European
6%English
5%Croatian
4%Dutch
2%Italian
Year of entry for the foreign-born population
02010 or later
42000 to 2009
01990 to 1999
17Before 1990
Housing units lacking complete plumbing facilities: 1.6% Housing units lacking complete kitchen facilities: 1.7%
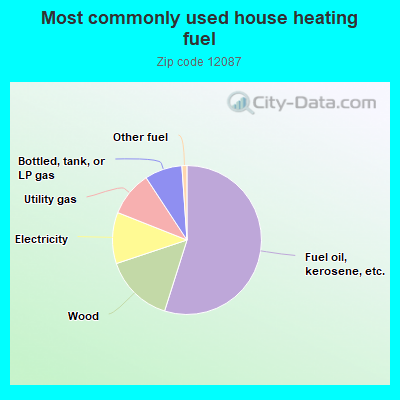
55.2%Fuel oil, kerosene, etc.
15.1%Wood
11.2%Electricity
9.8%Utility gas
8.2%Bottled, tank, or LP gas
1.1%Other fuel
Population in 1990: 1,665.
Place of birth for U.S.-born residents:
This state: 1,084
Northeast: 62
Midwest: 47
South: 9
West: 28
62% of the 12087 zip code residents lived in the same house 5 years ago. Out of people who lived in different houses, 36% lived in this county. Out of people who lived in different counties, 50% lived in New York.
96% of the 12087 zip code residents lived in the same house 1 year ago. Out of people who lived in different houses, 63% moved from this county. Out of people who lived in different houses, 33% moved from different county within same state.
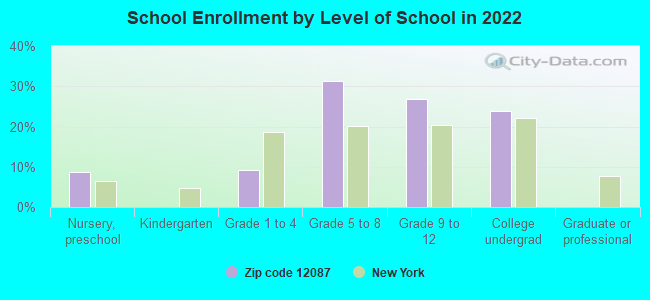
Private vs. public school enrollment:
Students in private schools in grades 1 to 8 (elementary and middle school): 9
Here:
10.9%
New York:
15.6%
Students in private schools in grades 9 to 12 (high school): 37
Here:
64.5%
New York:
15.0%
Students in private undergraduate colleges: 38
Here:
76.5%
New York:
39.2%
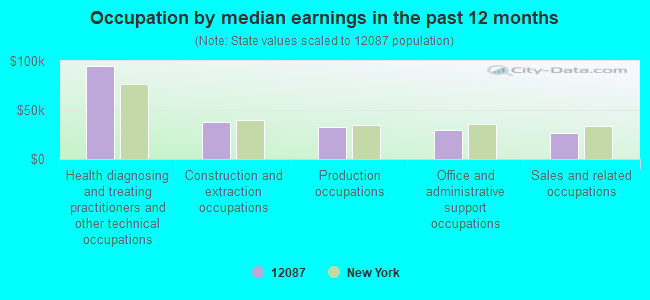
Occupation by median earnings in the past 12 months ($)
94,398Health diagnosing and treating practitioners and other technical occupations
37,897Construction and extraction occupations
32,420Production occupations
30,020Office and administrative support occupations
26,281Sales and related occupations
Top industries in this zip code by the number of employees in 2005:
Construction: Plumbing, Heating, and Air-Conditioning Contractors (5-9 employees: 1 establishment)
Other Services (except Public Administration): Cemeteries and Crematories (1-4: 1)
Professional, Scientific, and Technical Services: Offices of Lawyers (1-4: 1)
Administrative and Support and Waste Management and Remediation Services: Septic Tank and Related Services (1-4: 1)
Home Mortgage Disclosure Act Aggregated Statistics For Year 2009 (Based on 2 partial tracts)
A) FHA, FSA/RHS & VA Home Purchase Loans
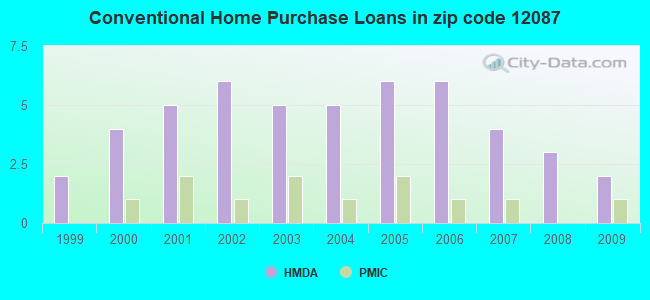
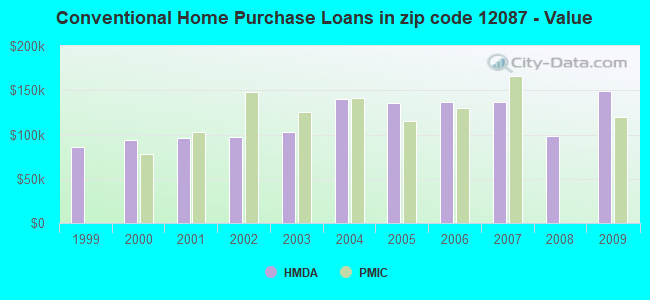
B) Conventional Home Purchase Loans
C) Refinancings
D) Home Improvement Loans
F) Non-occupant Loans on < 5 Family Dwellings (A B C & D)
Number
Average Value
Number
Average Value
Number
Average Value
Number
Average Value
Number
Average Value
LOANS ORIGINATED
2
$124,125
2
$148,710
7
$173,384
2
$34,000
1
$101,750
APPLICATIONS APPROVED, NOT ACCEPTED
0
$0
0
$0
1
$203,630
0
$0
0
$0
APPLICATIONS DENIED
1
$66,360
1
$115,280
4
$142,928
1
$18,710
0
$0
APPLICATIONS WITHDRAWN
0
$0
0
$0
2
$140,555
0
$0
0
$0
FILES CLOSED FOR INCOMPLETENESS
0
$0
0
$0
0
$0
0
$0
0
$0
Aggregated Statistics For Year 2008 (Based on 2 partial tracts)
A) FHA, FSA/RHS & VA Home Purchase Loans
B) Conventional Home Purchase Loans
C) Refinancings
D) Home Improvement Loans
F) Non-occupant Loans on < 5 Family Dwellings (A B C & D)
G) Loans On Manufactured Home Dwelling (A B C & D)
Number
Average Value
Number
Average Value
Number
Average Value
Number
Average Value
Number
Average Value
Number
Average Value
LOANS ORIGINATED
1
$184,800
3
$98,340
6
$148,837
3
$50,350
1
$49,930
1
$28,310
APPLICATIONS APPROVED, NOT ACCEPTED
0
$0
0
$0
1
$79,250
0
$0
0
$0
0
$0
APPLICATIONS DENIED
0
$0
1
$92,270
4
$144,698
3
$38,257
0
$0
1
$9,480
APPLICATIONS WITHDRAWN
0
$0
0
$0
3
$179,530
1
$88,610
0
$0
0
$0
FILES CLOSED FOR INCOMPLETENESS
0
$0
0
$0
1
$107,950
0
$0
0
$0
0
$0
Aggregated Statistics For Year 2007 (Based on 2 partial tracts)
A) FHA, FSA/RHS & VA Home Purchase Loans
B) Conventional Home Purchase Loans
C) Refinancings
D) Home Improvement Loans
F) Non-occupant Loans on < 5 Family Dwellings (A B C & D)
G) Loans On Manufactured Home Dwelling (A B C & D)
Number
Average Value
Number
Average Value
Number
Average Value
Number
Average Value
Number
Average Value
Number
Average Value
LOANS ORIGINATED
1
$228,780
4
$136,860
6
$133,983
4
$68,288
1
$46,260
1
$33,620
APPLICATIONS APPROVED, NOT ACCEPTED
0
$0
1
$144,980
1
$91,510
1
$58,020
0
$0
0
$0
APPLICATIONS DENIED
0
$0
3
$129,180
7
$155,364
4
$43,702
0
$0
0
$0
APPLICATIONS WITHDRAWN
0
$0
1
$59,160
6
$129,645
1
$48,030
0
$0
0
$0
FILES CLOSED FOR INCOMPLETENESS
0
$0
1
$115,280
1
$244,960
0
$0
0
$0
0
$0
Aggregated Statistics For Year 2006 (Based on 2 partial tracts)
A) FHA, FSA/RHS & VA Home Purchase Loans
B) Conventional Home Purchase Loans
C) Refinancings
D) Home Improvement Loans
F) Non-occupant Loans on < 5 Family Dwellings (A B C & D)
Number
Average Value
Number
Average Value
Number
Average Value
Number
Average Value
Number
Average Value
LOANS ORIGINATED
1
$88,100
6
$136,385
7
$130,283
4
$39,785
1
$71,040
APPLICATIONS APPROVED, NOT ACCEPTED
0
$0
1
$73,690
2
$137,715
1
$98,720
0
$0
APPLICATIONS DENIED
0
$0
1
$161,160
6
$174,600
3
$40,110
0
$0
APPLICATIONS WITHDRAWN
0
$0
1
$90,630
4
$167,100
0
$0
0
$0
FILES CLOSED FOR INCOMPLETENESS
0
$0
0
$0
2
$128,105
0
$0
0
$0
Aggregated Statistics For Year 2005 (Based on 2 partial tracts)
A) FHA, FSA/RHS & VA Home Purchase Loans
B) Conventional Home Purchase Loans
C) Refinancings
D) Home Improvement Loans
F) Non-occupant Loans on < 5 Family Dwellings (A B C & D)
G) Loans On Manufactured Home Dwelling (A B C & D)
Number
Average Value
Number
Average Value
Number
Average Value
Number
Average Value
Number
Average Value
Number
Average Value
LOANS ORIGINATED
1
$63,330
6
$135,648
9
$130,937
4
$51,825
1
$86,200
1
$96,060
APPLICATIONS APPROVED, NOT ACCEPTED
0
$0
0
$0
2
$96,065
0
$0
0
$0
0
$0
APPLICATIONS DENIED
0
$0
1
$45,380
7
$117,949
3
$16,053
0
$0
1
$38,550
APPLICATIONS WITHDRAWN
0
$0
1
$76,600
7
$109,047
1
$98,590
0
$0
0
$0
FILES CLOSED FOR INCOMPLETENESS
0
$0
0
$0
2
$132,655
0
$0
0
$0
0
$0
Aggregated Statistics For Year 2004 (Based on 2 partial tracts)
A) FHA, FSA/RHS & VA Home Purchase Loans
B) Conventional Home Purchase Loans
C) Refinancings
D) Home Improvement Loans
F) Non-occupant Loans on < 5 Family Dwellings (A B C & D)
Number
Average Value
Number
Average Value
Number
Average Value
Number
Average Value
Number
Average Value
LOANS ORIGINATED
1
$85,450
5
$140,456
9
$94,618
3
$32,527
1
$45,630
APPLICATIONS APPROVED, NOT ACCEPTED
0
$0
0
$0
2
$124,630
1
$23,130
0
$0
APPLICATIONS DENIED
0
$0
1
$93,920
7
$101,030
3
$33,033
0
$0
APPLICATIONS WITHDRAWN
0
$0
1
$67,370
6
$118,922
1
$49,680
0
$0
FILES CLOSED FOR INCOMPLETENESS
0
$0
0
$0
1
$117,170
0
$0
0
$0
Aggregated Statistics For Year 2003 (Based on 2 partial tracts)
A) FHA, FSA/RHS & VA Home Purchase Loans
B) Conventional Home Purchase Loans
C) Refinancings
D) Home Improvement Loans
Number
Average Value
Number
Average Value
Number
Average Value
Number
Average Value
LOANS ORIGINATED
1
$51,070
5
$103,192
19
$101,466
1
$33,120
APPLICATIONS APPROVED, NOT ACCEPTED
0
$0
1
$50,690
5
$93,334
0
$0
APPLICATIONS DENIED
0
$0
1
$52,710
8
$91,119
1
$23,510
APPLICATIONS WITHDRAWN
0
$0
0
$0
6
$94,778
0
$0
FILES CLOSED FOR INCOMPLETENESS
0
$0
0
$0
1
$98,210
0
$0
Aggregated Statistics For Year 2002 (Based on 2 partial tracts)
B) Conventional Home Purchase Loans
C) Refinancings
D) Home Improvement Loans
F) Non-occupant Loans on < 5 Family Dwellings (A B C & D)
Number
Average Value
Number
Average Value
Number
Average Value
Number
Average Value
LOANS ORIGINATED
6
$96,675
10
$92,184
2
$19,845
1
$60,170
APPLICATIONS APPROVED, NOT ACCEPTED
1
$54,100
2
$85,255
1
$5,060
0
$0
APPLICATIONS DENIED
2
$81,530
5
$75,588
1
$6,190
0
$0
APPLICATIONS WITHDRAWN
1
$121,220
5
$83,172
0
$0
0
$0
FILES CLOSED FOR INCOMPLETENESS
0
$0
1
$52,840
0
$0
0
$0
Aggregated Statistics For Year 2001 (Based on 2 partial tracts)
A) FHA, FSA/RHS & VA Home Purchase Loans
B) Conventional Home Purchase Loans
C) Refinancings
D) Home Improvement Loans
Number
Average Value
Number
Average Value
Number
Average Value
Number
Average Value
LOANS ORIGINATED
2
$71,670
5
$95,736
8
$89,981
2
$18,960
APPLICATIONS APPROVED, NOT ACCEPTED
0
$0
1
$73,820
2
$76,280
0
$0
APPLICATIONS DENIED
0
$0
2
$56,815
5
$85,118
1
$11,380
APPLICATIONS WITHDRAWN
0
$0
1
$41,710
3
$95,433
0
$0
FILES CLOSED FOR INCOMPLETENESS
0
$0
0
$0
0
$0
0
$0
Aggregated Statistics For Year 2000 (Based on 2 partial tracts)
A) FHA, FSA/RHS & VA Home Purchase Loans
B) Conventional Home Purchase Loans
C) Refinancings
D) Home Improvement Loans
F) Non-occupant Loans on < 5 Family Dwellings (A B C & D)
Number
Average Value
Number
Average Value
Number
Average Value
Number
Average Value
Number
Average Value
LOANS ORIGINATED
1
$84,560
4
$94,042
4
$78,082
3
$25,743
1
$34,760
APPLICATIONS APPROVED, NOT ACCEPTED
0
$0
2
$54,480
1
$76,720
1
$13,780
0
$0
APPLICATIONS DENIED
0
$0
3
$46,893
4
$76,850
2
$15,295
0
$0
APPLICATIONS WITHDRAWN
0
$0
1
$52,960
1
$127,660
0
$0
0
$0
FILES CLOSED FOR INCOMPLETENESS
0
$0
0
$0
1
$71,040
0
$0
0
$0
Aggregated Statistics For Year 1999 (Based on 1 partial tract)

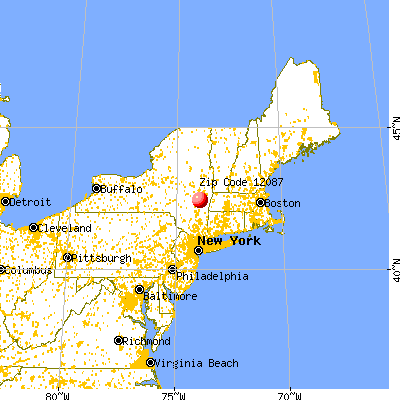


 Nearest zip codes: 12007, 12042, 12143, 12192, 12046, 12058.