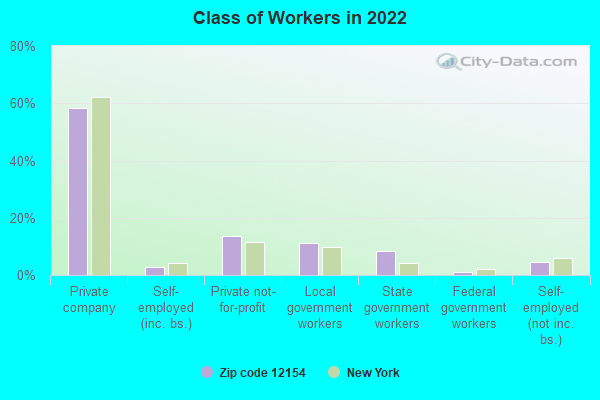
Estimated zip code population in 2022: 2,775 Zip code population in 2010: 2,818 Zip code population in 2000: 2,704
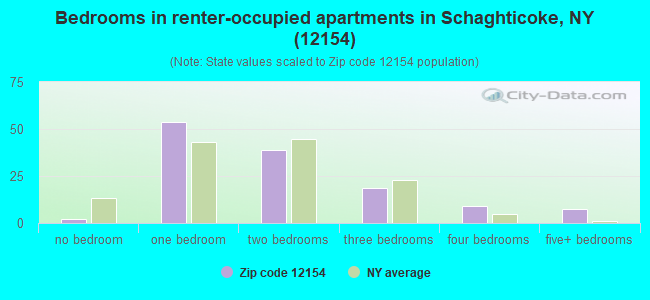
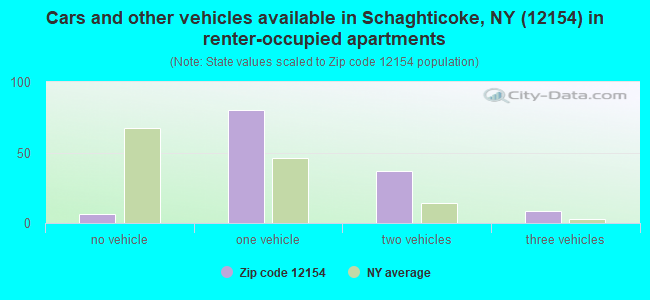
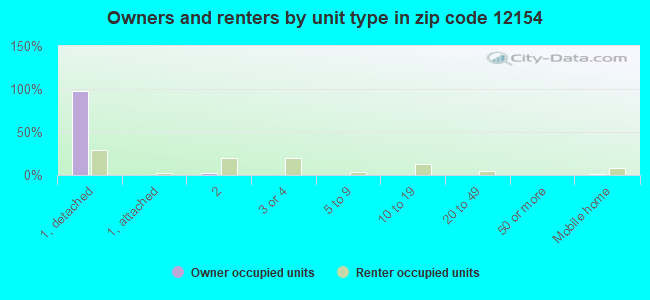
Houses and condos: 1,297 Renter-occupied apartments: 131
% of renters here:
11%
State:
46%
March 2022 cost of living index in zip code 12154: 94.1 (less than average, U.S. average is 100)
Land area: 41.7 sq. mi. Water area: 1.2 sq. mi.
Population density: 67 people per square mile
(very low).
OSM Map
General Map
Google Map
MSN Map
OSM Map
General Map
Google Map
MSN Map
OSM Map
General Map
Google Map
MSN Map
OSM Map
General Map
Google Map
MSN Map
Please wait while loading the map...
Real estate property taxes paid for housing units in 2022:
This zip code:
1.7% ($4,131)
New York:
1.5% ($6,180)
Median real estate property taxes paid for housing units with mortgages in 2022: $5,109 (2.1%) Median real estate property taxes paid for housing units with no mortgage in 2022: $3,059 (1.2%)
Business Search- 14 Million verified businesses
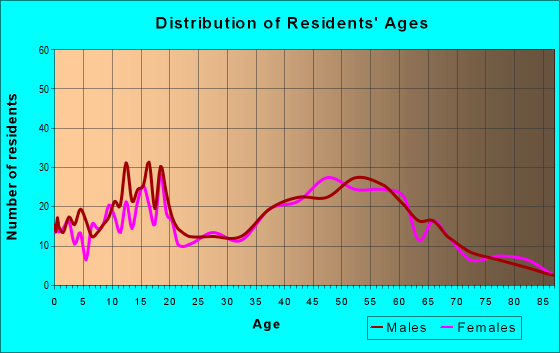
Males: 1,394
(50.3%)
Females: 1,380
(49.7%)
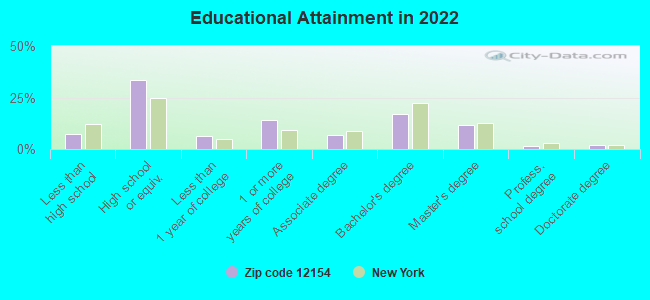
For population 25 years and over in 12154:
High school or higher: 91.5%
Bachelor's degree or higher: 31.5%
Graduate or professional degree: 14.9%
Unemployed: 2.6%
Mean travel time to work (commute): 26.9 minutes
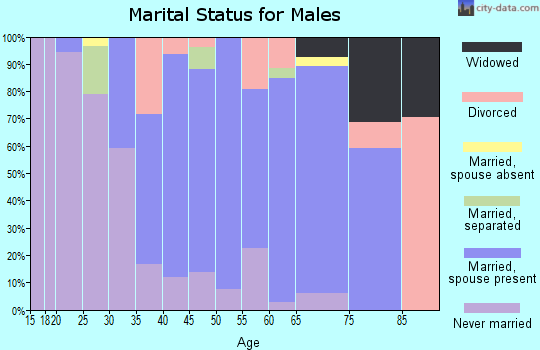
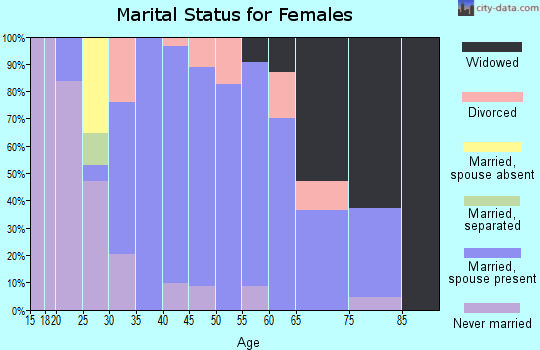
For population 15 years and over in 12154:
Never married: 23.5%
Now married: 63.8%
Separated: 0.5%
Widowed: 6.1%
Divorced: 6.0%
Zip code 12154 compared to state average:
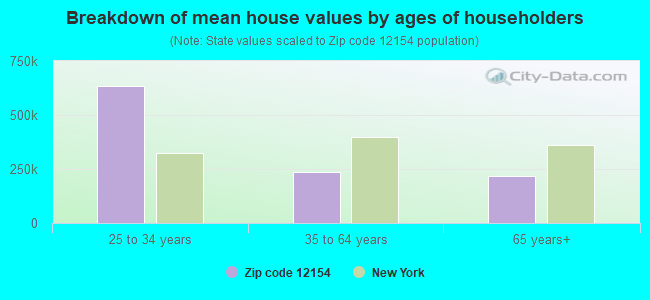
Median house value below state average.
Unemployed percentage below state average.
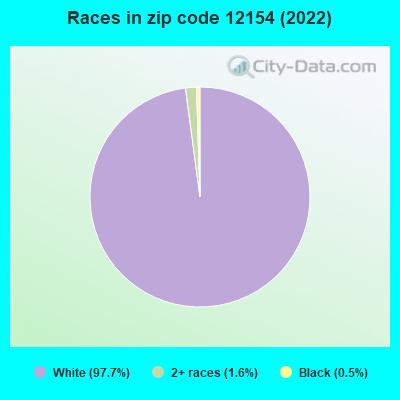
Black race population percentage significantly below state average.
Hispanic race population percentage significantly below state average.
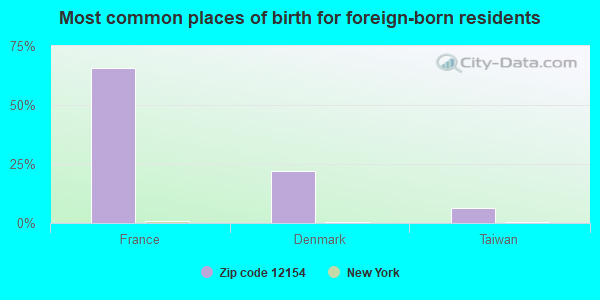
Foreign-born population percentage significantly below state average.
Renting percentage significantly below state average.
Length of stay since moving in significantly above state average.
Averages for the 2020 tax year for zip code 12154, filed in 2021:
Average Adjusted Gross Income (AGI) in 2020: $73,617 (Individual Income Tax Returns)
Here:
$73,617
State:
$90,930
Salary/wage: $65,243 (reported on 81.8% of returns)
Here:
$65,243
State:
$72,104
(% of AGI for various income ranges: 1238.6% for AGIs below $25k, 3400.4% for AGIs $25k-50k, 6274.1% for AGIs $50k-75k, 8810.8% for AGIs $75k-100k, 18293.5% for AGIs $100k-200k, 45343.3% for AGIs over 200k)
Taxable interest for individuals: $997 (reported on 40.5% of returns)
This zip code:
$997
New York:
$3,075
(% of AGI for various income ranges: 13.3% for AGIs below $25k, 19.6% for AGIs $25k-50k, 28.2% for AGIs $50k-75k, 43.1% for AGIs $75k-100k, 77.1% for AGIs $100k-200k, 933.3% for AGIs over 200k)
Ordinary dividends: $3,547 (reported on 21.6% of returns)
Here:
$3,547
State:
$11,095
(% of AGI for various income ranges: 47.1% for AGIs below $25k, 37.9% for AGIs $25k-50k, 82.9% for AGIs $50k-75k, 130.0% for AGIs $75k-100k, 248.2% for AGIs $100k-200k, 660.0% for AGIs over 200k)
Net capital gain/loss in AGI: +$6,215 (reported on 17.6% of returns)
Here:
+$6,215
State:
+$44,925
(% of AGI for various income ranges: 14.3% for AGIs $25k-50k, 37.1% for AGIs $50k-75k, 31.5% for AGIs $75k-100k, 431.8% for AGIs $100k-200k, 2473.3% for AGIs over 200k)
Profit/loss from business: +$6,244 (reported on 10.8% of returns)
Here:
+$6,244
State:
+$14,940
(% of AGI for various income ranges: 30.0% for AGIs below $25k, 37.9% for AGIs $25k-50k, 42.3% for AGIs $75k-100k, 455.9% for AGIs $100k-200k)
Taxable individual retirement arrangement distribution: $13,136 (reported on 9.5% of returns)
12154:
$13,136
New York:
$19,609
(% of AGI for various income ranges: 61.4% for AGIs below $25k, 77.5% for AGIs $25k-50k, 136.5% for AGIs $50k-75k, 297.7% for AGIs $75k-100k, 514.1% for AGIs $100k-200k)
Total itemized deductions: $26,270 (reported on 6.8% of returns)
Here:
$26,270
State:
$39,326
(% of AGI for various income ranges: 552.4% for AGIs $50k-75k, 398.5% for AGIs $75k-100k, 688.2% for AGIs $100k-200k)
Charity contributions: $6,283 (reported on 4.1% of returns)
Here:
$6,283
State:
$15,420
(% of AGI for various income ranges: 27.1% for AGIs $50k-75k, 194.7% for AGIs $100k-200k)
Taxes paid: $8,400 (reported on 6.8% of returns)
12154:
$8,400
State:
$9,183
(% of AGI for various income ranges: 147.6% for AGIs $50k-75k, 149.2% for AGIs $75k-100k, 232.4% for AGIs $100k-200k)
Earned income credit: $1,950 (reported on 8.1% of returns)
Here:
$1,950
State:
$2,138
(% of AGI for various income ranges: 50.0% for AGIs below $25k, 46.1% for AGIs $25k-50k)
Percentage of individuals using paid preparers for their 2020 taxes: 95.3%
Here:
95%
State:
95%
(% for various income ranges: 93.9% for AGIs below $25k, 94.4% for AGIs $25k-50k, 95.8% for AGIs $50k-75k, 94.7% for AGIs $75k-100k, 96.7% for AGIs $100k-200k, 100.0% for AGIs over 200k)
Averages for the 2012 tax year for zip code 12154, filed in 2013:
Average Adjusted Gross Income (AGI) in 2012: $57,210 (Individual Income Tax Returns)
Here:
$57,210
State:
$77,088
Salary/wage: $52,628 (reported on 85.4% of returns)
Here:
$52,628
State:
$60,593
(% of AGI for various income ranges: 76.2% for AGIs below $25k, 77.4% for AGIs $25k-50k, 72.3% for AGIs $50k-75k, 79.5% for AGIs $75k-100k, 81.9% for AGIs $100k-200k, 80.3% for AGIs over 200k)
Taxable interest for individuals: $692 (reported on 43.8% of returns)
This zip code:
$692
New York:
$3,125
(% of AGI for various income ranges: 1.1% for AGIs below $25k, 0.4% for AGIs $25k-50k, 0.9% for AGIs $50k-75k, 0.6% for AGIs $75k-100k, 0.4% for AGIs $100k-200k)
Ordinary dividends: $2,073 (reported on 25.7% of returns)
Here:
$2,073
State:
$10,299
(% of AGI for various income ranges: 1.3% for AGIs below $25k, 1.2% for AGIs $25k-50k, 1.3% for AGIs $50k-75k, 0.9% for AGIs $75k-100k, 0.7% for AGIs $100k-200k)
Net capital gain/loss in AGI: +$2,375 (reported on 13.9% of returns)
Here:
+$2,375
State:
+$42,474
(% of AGI for various income ranges: 0.3% for AGIs $50k-75k, 1.0% for AGIs $75k-100k, 0.9% for AGIs $100k-200k)
Profit/loss from business: +$6,117 (reported on 12.5% of returns)
Here:
+$6,117
State:
+$16,168
(% of AGI for various income ranges: 1.7% for AGIs below $25k, 1.0% for AGIs $25k-50k, 1.0% for AGIs $50k-75k, 0.4% for AGIs $75k-100k, 2.4% for AGIs $100k-200k)
Taxable individual retirement arrangement distribution: $9,287 (reported on 10.4% of returns)
12154:
$9,287
New York:
$17,621
(% of AGI for various income ranges: 3.3% for AGIs below $25k, 1.6% for AGIs $25k-50k, 3.2% for AGIs $50k-75k, 3.4% for AGIs $75k-100k)
Total itemized deductions: $20,145 (21% of AGI, reported on 38.2% of returns)
Here:
$20,145
State:
$34,985
Here:
21.4% of AGI
State:
21.3% of AGI
(% of AGI for various income ranges: 7.0% for AGIs below $25k, 8.1% for AGIs $25k-50k, 14.7% for AGIs $50k-75k, 13.9% for AGIs $75k-100k, 15.9% for AGIs $100k-200k, 14.7% for AGIs over 200k)
Charity contributions: $2,137 (reported on 29.9% of returns)
Here:
$2,137
State:
$5,572
(% of AGI for various income ranges: 0.8% for AGIs $25k-50k, 0.7% for AGIs $50k-75k, 1.5% for AGIs $75k-100k, 1.7% for AGIs $100k-200k)
Taxes paid: $10,341 (reported on 37.5% of returns)
12154:
$10,341
State:
$18,656
(% of AGI for various income ranges: 2.6% for AGIs below $25k, 3.8% for AGIs $25k-50k, 5.9% for AGIs $50k-75k, 6.7% for AGIs $75k-100k, 8.8% for AGIs $100k-200k, 9.7% for AGIs over 200k)
Earned income credit: $1,840 (reported on 10.4% of returns)
Here:
$1,840
State:
$2,230
(% of AGI for various income ranges: 3.9% for AGIs below $25k, 0.6% for AGIs $25k-50k)
Percentage of individuals using paid preparers for their 2012 taxes: 56.2%
Here:
56%
State:
66%
(% for various income ranges: 47.7% for AGIs below $25k, 57.1% for AGIs $25k-50k, 56.5% for AGIs $50k-75k, 63.2% for AGIs $75k-100k, 71.4% for AGIs $100k-200k)
Averages for the 2004 tax year for zip code 12154, filed in 2005:
Average Adjusted Gross Income (AGI) in 2004: $46,198 (Individual Income Tax Returns)
Here:
$46,198
State:
$59,519
Salary/wage: $43,003 (reported on 86.3% of returns)
Here:
$43,003
State:
$50,673
(% of AGI for various income ranges: 139.0% for AGIs below $10k, 72.2% for AGIs $10k-25k, 79.4% for AGIs $25k-50k, 80.7% for AGIs $50k-75k, 83.8% for AGIs $75k-100k, 77.5% for AGIs over 100k)
Taxable interest for individuals: $878 (reported on 59.8% of returns)
This zip code:
$878
New York:
$2,377
(% of AGI for various income ranges: 4.0% for AGIs below $10k, 2.3% for AGIs $10k-25k, 1.2% for AGIs $25k-50k, 0.7% for AGIs $50k-75k, 0.8% for AGIs $75k-100k, 1.3% for AGIs over 100k)
Taxable dividends: $1,618 (reported on 30.6% of returns)
Here:
$1,618
State:
$5,394
(% of AGI for various income ranges: 1.6% for AGIs below $10k, 1.9% for AGIs $10k-25k, 1.3% for AGIs $25k-50k, 0.8% for AGIs $50k-75k, 1.3% for AGIs $75k-100k, 0.7% for AGIs over 100k)
Net capital gain/loss: +$3,544 (reported on 21.5% of returns)
Here:
+$3,544
State:
+$23,581
(% of AGI for various income ranges: 3.5% for AGIs below $10k, 0.7% for AGIs $10k-25k, 0.4% for AGIs $25k-50k, 0.7% for AGIs $50k-75k, 1.8% for AGIs $75k-100k, 3.6% for AGIs over 100k)
Profit/loss from business: +$8,696 (reported on 13.9% of returns)
Here:
+$8,696
State:
+$13,809
(% of AGI for various income ranges: 3.0% for AGIs below $10k, 2.3% for AGIs $10k-25k, 1.5% for AGIs $25k-50k, 2.5% for AGIs $50k-75k, 2.7% for AGIs $75k-100k, 3.6% for AGIs over 100k)
IRA payment deduction: $2,846 (reported on 2.9% of returns)
12154:
$2,846
New York:
$3,115
Total itemized deductions: $15,845 (21% of AGI, reported on 37.6% of returns)
Here:
$15,845
State:
$25,864
Here:
20.7% of AGI
State:
21.9% of AGI
(% of AGI for various income ranges: 9.6% for AGIs $10k-25k, 11.2% for AGIs $25k-50k, 12.8% for AGIs $50k-75k, 13.9% for AGIs $75k-100k, 14.9% for AGIs over 100k)
Charity contributions deductions: $1,949 (2% of AGI, reported on 34.0% of returns)
Here:
$1,949
State:
$4,439
Here:
2.5% of AGI
State:
3.6% of AGI
(% of AGI for various income ranges: 0.5% for AGIs $10k-25k, 0.8% for AGIs $25k-50k, 1.3% for AGIs $50k-75k, 1.6% for AGIs $75k-100k, 2.3% for AGIs over 100k)
Total tax: $5,628 (reported on 81.4% of returns)
12154:
$5,628
State:
$11,730
(% of AGI for various income ranges: 3.0% for AGIs below $10k, 4.3% for AGIs $10k-25k, 7.1% for AGIs $25k-50k, 8.9% for AGIs $50k-75k, 10.1% for AGIs $75k-100k, 14.8% for AGIs over 100k)
Earned income credit: $1,508 (reported on 9.2% of returns)
Here:
$1,508
State:
$1,757
Percentage of individuals using paid preparers for their 2004 taxes: 61.1%
Here:
61%
State:
67%
(% for various income ranges: 47.2% for AGIs below $10k, 65.4% for AGIs $10k-25k, 61.5% for AGIs $25k-50k, 66.9% for AGIs $50k-75k, 57.7% for AGIs $75k-100k, 69.0% for AGIs over 100k)
Household received Food Stamps/SNAP in the past 12 months: 21 Household did not receive Food Stamps/SNAP in the past 12 months: 1,186
Women who had a birth in the past 12 months: 4 (4 now married, 0 unmarried) Women who did not have a birth in the past 12 months: 724 (410 now married, 306 unmarried)
Housing units in zip code 12154 with a mortgage: 695 (48 second mortgage, 5 home equity loan, 43 both second mortgage and home equity loan) Houses without a mortgage: 23
Median monthly owner costs for units with a mortgage: $1,797 Median monthly owner costs for units without a mortgage: $557
Residents with income below the poverty level in 2022:
This zip code:
6.8%
Whole state:
14.3%
Residents with income below 50% of the poverty level in 2022:
This zip code:
3.1%
Whole state:
6.8%
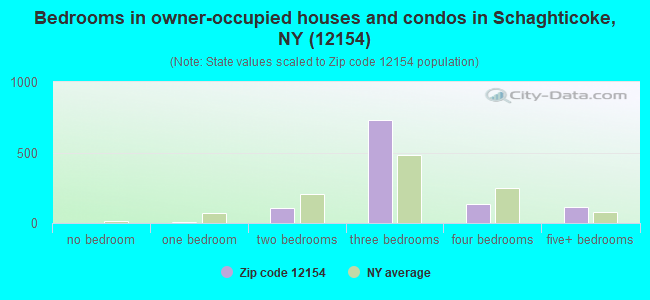
Median number of rooms in houses and condos:
Here:
6.3
State:
6.3
Median number of rooms in apartments:
Here:
4.0
State:
3.8
Notable locations in this zip code not listed on our city pages
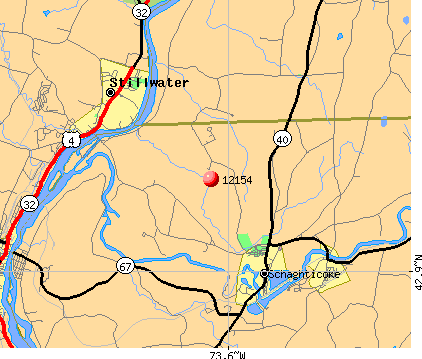
Notable locations in zip code 12154: Mechanicsville Golf Club (A), Viewmere Farm (B), Witenagemot Farm (C), East Schaghticoke (D), Borden's Orchard (E), River Edge Farm (F), Deer Run Campground (G), Liberty Ridge Farm (H), Arvilla E Diver Memorial Library (I), Schaghticoke Town Hall (J). Display/hide their locations on the map
Churches in zip code 12154 include: Saint John The Baptist Roman Catholic Church (A), Friends Church (B), Hoosic Valley Community Church (C), Presbyterian United Church (D). Display/hide their locations on the map
Size of family households: 546 2-persons, 218 3-persons, 123 4-persons, 28 5-persons, 4 7-or-more-persons
Size of nonfamily households: 231 1-person, 70 2-persons, 5 3-persons
280 married couples with children.
114 single-parent households (18 men, 96 women).
99.4% of residents of 12154 zip code speak English at home.
0.3% of residents speak other Indo-European language at home (100% very well).
0.2% of residents speak Asian or Pacific Island language at home (100% very well).
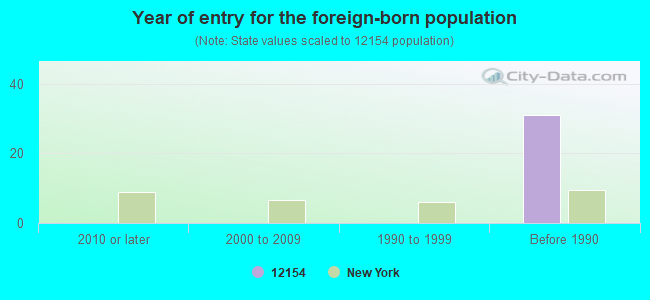
Foreign born population: 32 (1.2%) (34.5% of them are naturalized citizens)
This zip code:
1.2%
Whole state:
22.7%
66%France
22%Denmark
6%Taiwan
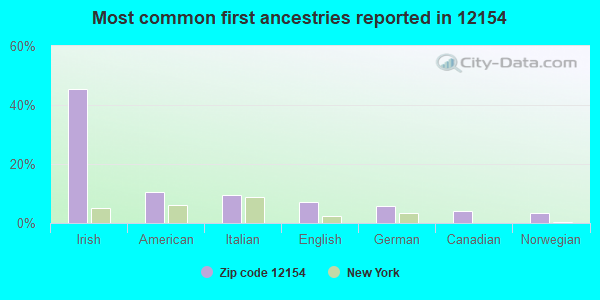
45%Irish
10%American
10%Italian
7%English
6%German
4%Canadian
3%Norwegian
Year of entry for the foreign-born population
02010 or later
02000 to 2009
01990 to 1999
31Before 1990
Facilities with environmental interests located in this zip code:
HOOSIC VALLEY ES ( in SCHAGHTICOKE, NY)
(National Center for Education Statistics) - STATE ID-491401040001 Organizations: HOOSIC VALLEY CSD (SCHOOL DISTRICT)
HOOSIC VALLEY MS ( in SCHAGHTICOKE, NY)
(National Center for Education Statistics) - STATE ID-491401040003 Organizations: HOOSIC VALLEY CSD (SCHOOL DISTRICT)
HOOSIC VALLEY SHS ( in SCHAGHTICOKE, NY)
(National Center for Education Statistics) - STATE ID-491401040002 Organizations: HOOSIC VALLEY CSD (SCHOOL DISTRICT)
COLSCOLSCOLSCOLSCOLS-4741 AGWA (249 SARLES FERRY ROAD in SCHAGHTICOKE, NY)
National Pollutant Discharge Elimination System NON-MAJOR (Tracking pollutant discharge elimination systems) - permit Business SIC classification: GENERAL FARMS, PRIMARILY LIVESTOCK AND ANIMAL SPECIALTIES Organizations: AGWAY, INC. (CONTACT/OWNER)
Alternative names: AGWAY INC./ENVIRONMENTAL QUALI
ALLENWAITE FARMS INC (414 WAITE ROAD in SCHAGHTICOKE, NY)
National Pollutant Discharge Elimination System NON-MAJOR (Tracking pollutant discharge elimination systems) - permit Business SIC classification: GENERAL FARMS, PRIMARILY LIVESTOCK AND ANIMAL SPECIALTIES Organizations: GEORGE E. ALLEN (CONTACT/OWNER)
Alternative names: GEORGE E. ALLEN
HOOSAC VALLEY FARMERS (212 MAIL STREET in SCHAGHTICOKE, NY)
COMPLIANCE ACTIVITY (Tracking inspections of insecticide, fungicide, and rodenticide, and toxic substances)
HOOSIC VALLEY CENTRAL SCHOOL (RTE 67 - 200 YDS W OF RTE 40 in SCHAGHTICOKE, NY)
Conditionally Exempt Small Quantity Generators, less than 100 kg/month of hazardous waste (Resource Conservation and Recovery Act (tracking hazardous waste)) - notification
HOOSIC VALLEY CENTRAL SCHOOL DISTRICT (RT 40 in SCHAGHTICOKE, NY)
COMPLIANCE ACTIVITY (Tracking inspections of insecticide, fungicide, and rodenticide, and toxic substances)
Housing units lacking complete plumbing facilities: 0.5% Housing units lacking complete kitchen facilities: 1.3%
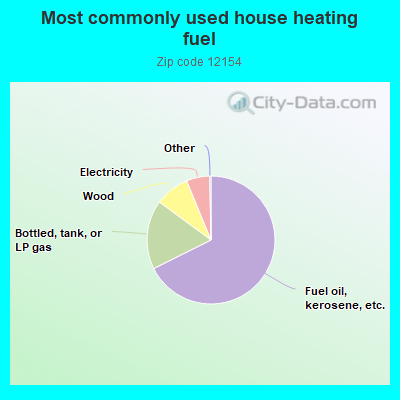
67.7%Fuel oil, kerosene, etc.
17.5%Bottled, tank, or LP gas
8.7%Wood
5.9%Electricity
Population in 1990: 3,035.
Place of birth for U.S.-born residents:
This state: 2,450
Northeast: 143
Midwest: 36
South: 26
West: 81
77% of the 12154 zip code residents lived in the same house 5 years ago. Out of people who lived in different houses, 55% lived in this county. Out of people who lived in different counties, 50% lived in New York.
96% of the 12154 zip code residents lived in the same house 1 year ago. Out of people who lived in different houses, 32% moved from this county. Out of people who lived in different houses, 66% moved from different county within same state. Out of people who lived in different houses, 1% moved from abroad.
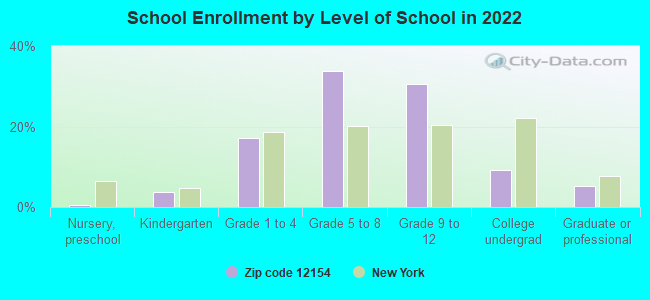
Private vs. public school enrollment:
Students in private schools in grades 1 to 8 (elementary and middle school): 25
Here:
11.1%
New York:
15.6%
Students in private schools in grades 9 to 12 (high school): 8
Here:
6.1%
New York:
15.0%
Students in private undergraduate colleges: 12
Here:
30.4%
New York:
39.2%
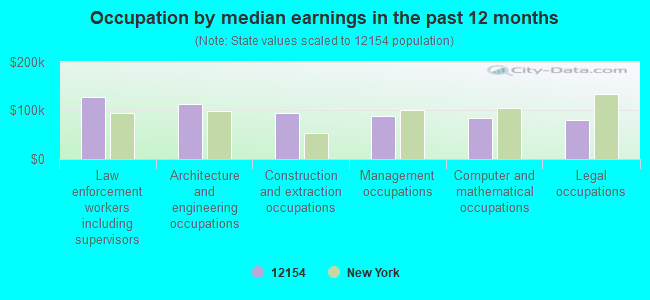
Occupation by median earnings in the past 12 months ($)
127,280Law enforcement workers including supervisors
112,285Architecture and engineering occupations
95,304Construction and extraction occupations
89,132Management occupations
84,402Computer and mathematical occupations
80,679Legal occupations
Companies with federal contracts located in this zip code:
HMA CONTRACTING CORP (1 BRICKYARD RD in SCHAGHTICOKE, NY; small business) 6 employees, $5500000 revenue.
$399,000 with Department of Veterans Affairs for Maintenance, Repair or Alteration of Real Property -- Highways, Roads, Streets, Bridges, and Railways (includes resurfacing). Signed on 2001-01-15. Completion date: 2001-08-15.
ZAYHOWSKI, WALTER G JR (250 SLITER RD in SCHAGHTICOKE, NY; small business) : $219,979 in 18 contractsfrom 2004 to 2005
Contracts for Technical Representation Services -- Vehicular Equipment Components, Technical Representation Services -- Special Industry Machinery by Army Signed by year:2000: $0; 2001: $0; 2002: $0; 2003: $0; 2004: $99,577; 2005: $120,402; 2006: $0.
Biggest contracts:
$45,000 with Army for Technical Representation Services -- Vehicular Equipment Components. Signed on 2005-06-15. Completion date: 2004-12-27.
$40,000, same as above.Signed on 2005-05-18. Completion date: 2004-12-27.
$30,420 with Army for Technical Representation Services -- Special Industry Machinery. Signed on 2004-01-26. Completion date: 2004-05-28.
$28,800 with Army for Technical Representation Services -- Vehicular Equipment Components. Signed on 2004-08-24. Completion date: 2004-12-27.
Top industries in this zip code by the number of employees in 2005:
Wholesale Trade: Farm and Garden Machinery and Equipment Merchant Wholesalers (20-49 employees: 1 establishment)
Accommodation and Food Services: Limited-Service Restaurants (20-49: 1)
Construction: All Other Specialty Trade Contractors (10-19: 1, 1-4: 1)
Construction: Site Preparation Contractors (10-19: 1, 1-4: 1)
Accommodation and Food Services: Full-Service Restaurants (5-9: 1, 1-4: 1)
Fatal accident statistics in 2011:
Fatal accident count: 1
Vehicles involved in fatal accidents: 1
Fatal accidents caused by drunken drivers: 1
Fatalities: 2
Persons involved in fatal accidents: 3
Pedestrians involved in fatal accidents: 0
Fatal accident statistics in 2010:
Fatal accident count: 1
Vehicles involved in fatal accidents: 2
Fatal accidents caused by drunken drivers: 0
Fatalities: 2
Persons involved in fatal accidents: 3
Pedestrians involved in fatal accidents: 0
Home Mortgage Disclosure Act Aggregated Statistics For Year 2009 (Based on 6 partial tracts)
A) FHA, FSA/RHS & VA Home Purchase Loans
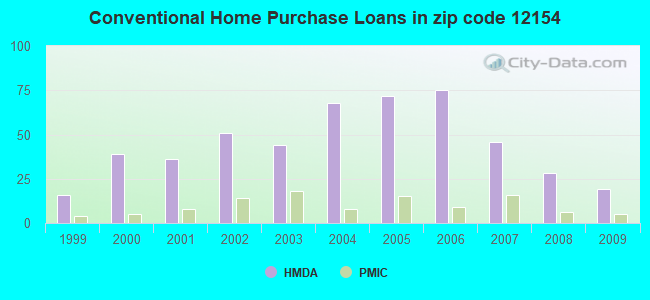
B) Conventional Home Purchase Loans
C) Refinancings
D) Home Improvement Loans
F) Non-occupant Loans on < 5 Family Dwellings (A B C & D)
G) Loans On Manufactured Home Dwelling (A B C & D)
Number
Average Value
Number
Average Value
Number
Average Value
Number
Average Value
Number
Average Value
Number
Average Value
LOANS ORIGINATED
22
$171,445
19
$161,683
78
$149,453
14
$36,108
2
$60,585
1
$48,170
APPLICATIONS APPROVED, NOT ACCEPTED
2
$129,855
1
$146,610
12
$148,479
4
$22,142
1
$125,660
0
$0
APPLICATIONS DENIED
1
$30,390
9
$93,260
44
$172,188
10
$50,677
2
$55,500
0
$0
APPLICATIONS WITHDRAWN
5
$166,622
1
$251,330
35
$157,969
1
$10,470
1
$34,660
0
$0
FILES CLOSED FOR INCOMPLETENESS
0
$0
2
$183,260
3
$147,657
1
$89,010
1
$116,240
0
$0
Aggregated Statistics For Year 2008 (Based on 6 partial tracts)
A) FHA, FSA/RHS & VA Home Purchase Loans
B) Conventional Home Purchase Loans
C) Refinancings
D) Home Improvement Loans
F) Non-occupant Loans on < 5 Family Dwellings (A B C & D)
G) Loans On Manufactured Home Dwelling (A B C & D)
Number
Average Value
Number
Average Value
Number
Average Value
Number
Average Value
Number
Average Value
Number
Average Value
LOANS ORIGINATED
16
$149,270
28
$161,187
64
$147,293
10
$45,408
3
$106,223
1
$78,540
APPLICATIONS APPROVED, NOT ACCEPTED
1
$108,910
4
$157,080
11
$141,586
4
$15,865
2
$123,570
0
$0
APPLICATIONS DENIED
3
$168,853
6
$185,732
49
$144,089
19
$42,565
4
$173,092
3
$64,287
APPLICATIONS WITHDRAWN
2
$216,770
3
$200,683
18
$156,437
4
$109,960
2
$102,110
1
$106,810
FILES CLOSED FOR INCOMPLETENESS
1
$151,840
0
$0
6
$164,282
2
$83,775
0
$0
0
$0
Aggregated Statistics For Year 2007 (Based on 6 partial tracts)
A) FHA, FSA/RHS & VA Home Purchase Loans
B) Conventional Home Purchase Loans
C) Refinancings
D) Home Improvement Loans
F) Non-occupant Loans on < 5 Family Dwellings (A B C & D)
G) Loans On Manufactured Home Dwelling (A B C & D)
Number
Average Value
Number
Average Value
Number
Average Value
Number
Average Value
Number
Average Value
Number
Average Value
LOANS ORIGINATED
7
$135,163
46
$190,833
86
$128,551
34
$42,531
10
$206,700
2
$79,800
APPLICATIONS APPROVED, NOT ACCEPTED
0
$0
6
$125,523
18
$115,018
7
$49,966
0
$0
1
$24,090
APPLICATIONS DENIED
0
$0
9
$132,456
38
$154,713
28
$50,007
4
$190,765
2
$27,225
APPLICATIONS WITHDRAWN
0
$0
4
$100,580
28
$149,274
5
$81,762
0
$0
0
$0
FILES CLOSED FOR INCOMPLETENESS
1
$76,780
1
$134,900
7
$167,963
4
$49,638
0
$0
0
$0
Aggregated Statistics For Year 2006 (Based on 6 partial tracts)
A) FHA, FSA/RHS & VA Home Purchase Loans
B) Conventional Home Purchase Loans
C) Refinancings
D) Home Improvement Loans
F) Non-occupant Loans on < 5 Family Dwellings (A B C & D)
G) Loans On Manufactured Home Dwelling (A B C & D)
Number
Average Value
Number
Average Value
Number
Average Value
Number
Average Value
Number
Average Value
Number
Average Value
LOANS ORIGINATED
7
$122,373
75
$119,197
98
$125,570
35
$67,852
6
$102,710
4
$78,278
APPLICATIONS APPROVED, NOT ACCEPTED
2
$183,260
6
$91,463
32
$115,762
7
$46,594
4
$77,885
2
$94,770
APPLICATIONS DENIED
0
$0
21
$89,410
58
$136,609
30
$54,238
6
$109,957
4
$50,790
APPLICATIONS WITHDRAWN
3
$127,060
7
$123,551
39
$130,509
3
$95,993
3
$68,040
0
$0
FILES CLOSED FOR INCOMPLETENESS
0
$0
6
$122,543
11
$118,009
3
$116,463
0
$0
0
$0
Aggregated Statistics For Year 2005 (Based on 6 partial tracts)
A) FHA, FSA/RHS & VA Home Purchase Loans
B) Conventional Home Purchase Loans
C) Refinancings
D) Home Improvement Loans
F) Non-occupant Loans on < 5 Family Dwellings (A B C & D)
G) Loans On Manufactured Home Dwelling (A B C & D)
Number
Average Value
Number
Average Value
Number
Average Value
Number
Average Value
Number
Average Value
Number
Average Value
LOANS ORIGINATED
9
$141,372
72
$147,798
109
$120,740
32
$45,214
3
$292,277
2
$66,495
APPLICATIONS APPROVED, NOT ACCEPTED
1
$76,450
14
$126,175
15
$116,944
6
$22,587
2
$65,920
3
$37,000
APPLICATIONS DENIED
1
$87,960
23
$102,772
76
$86,967
24
$47,722
0
$0
5
$46,358
APPLICATIONS WITHDRAWN
2
$175,405
4
$100,718
74
$125,068
8
$138,279
3
$90,407
0
$0
FILES CLOSED FOR INCOMPLETENESS
0
$0
5
$116,810
16
$140,592
1
$52,360
0
$0
0
$0
Aggregated Statistics For Year 2004 (Based on 6 partial tracts)
A) FHA, FSA/RHS & VA Home Purchase Loans
B) Conventional Home Purchase Loans
C) Refinancings
D) Home Improvement Loans
F) Non-occupant Loans on < 5 Family Dwellings (A B C & D)
G) Loans On Manufactured Home Dwelling (A B C & D)
Number
Average Value
Number
Average Value
Number
Average Value
Number
Average Value
Number
Average Value
Number
Average Value
LOANS ORIGINATED
9
$139,278
68
$119,704
120
$106,654
24
$32,653
12
$80,178
3
$99,833
APPLICATIONS APPROVED, NOT ACCEPTED
2
$111,525
7
$134,207
18
$96,301
6
$58,152
1
$41,060
1
$31,420
APPLICATIONS DENIED
0
$0
10
$92,055
76
$121,878
20
$40,340
2
$96,865
6
$44,628
APPLICATIONS WITHDRAWN
2
$115,190
9
$100,284
69
$105,527
8
$57,731
2
$45,965
4
$45,148
FILES CLOSED FOR INCOMPLETENESS
0
$0
4
$111,830
11
$128,483
1
$134,040
1
$67,020
0
$0
Aggregated Statistics For Year 2003 (Based on 6 partial tracts)
A) FHA, FSA/RHS & VA Home Purchase Loans
B) Conventional Home Purchase Loans
C) Refinancings
D) Home Improvement Loans
F) Non-occupant Loans on < 5 Family Dwellings (A B C & D)
Number
Average Value
Number
Average Value
Number
Average Value
Number
Average Value
Number
Average Value
LOANS ORIGINATED
13
$96,742
44
$116,557
167
$97,959
11
$12,129
4
$70,780
APPLICATIONS APPROVED, NOT ACCEPTED
0
$0
5
$119,250
33
$100,626
3
$39,137
1
$62,830
APPLICATIONS DENIED
2
$75,400
14
$100,336
79
$107,213
13
$24,891
5
$80,006
APPLICATIONS WITHDRAWN
5
$98,436
3
$157,237
46
$122,545
2
$9,865
1
$78,380
FILES CLOSED FOR INCOMPLETENESS
1
$87,960
0
$0
13
$102,715
1
$15,710
0
$0
Aggregated Statistics For Year 2002 (Based on 6 partial tracts)
A) FHA, FSA/RHS & VA Home Purchase Loans
B) Conventional Home Purchase Loans
C) Refinancings
D) Home Improvement Loans
F) Non-occupant Loans on < 5 Family Dwellings (A B C & D)
Number
Average Value
Number
Average Value
Number
Average Value
Number
Average Value
Number
Average Value
LOANS ORIGINATED
13
$96,614
51
$108,540
118
$92,488
16
$19,452
6
$65,388
APPLICATIONS APPROVED, NOT ACCEPTED
1
$82,730
3
$91,953
19
$83,372
3
$19,360
1
$57,600
APPLICATIONS DENIED
2
$96,340
8
$54,745
54
$100,208
13
$27,333
3
$74,183
APPLICATIONS WITHDRAWN
2
$72,165
3
$88,233
29
$96,797
3
$13,993
1
$42,120
FILES CLOSED FOR INCOMPLETENESS
0
$0
0
$0
5
$71,818
0
$0
0
$0
Aggregated Statistics For Year 2001 (Based on 6 partial tracts)
A) FHA, FSA/RHS & VA Home Purchase Loans
B) Conventional Home Purchase Loans
C) Refinancings
D) Home Improvement Loans
F) Non-occupant Loans on < 5 Family Dwellings (A B C & D)
Number
Average Value
Number
Average Value
Number
Average Value
Number
Average Value
Number
Average Value
LOANS ORIGINATED
16
$92,008
36
$106,060
84
$91,809
15
$10,435
2
$103,825
APPLICATIONS APPROVED, NOT ACCEPTED
0
$0
9
$79,202
18
$92,758
2
$10,845
2
$72,330
APPLICATIONS DENIED
0
$0
11
$48,630
47
$93,316
12
$10,577
0
$0
APPLICATIONS WITHDRAWN
2
$68,890
1
$47,990
33
$71,054
5
$48,590
0
$0
FILES CLOSED FOR INCOMPLETENESS
0
$0
0
$0
6
$140,038
0
$0
0
$0
Aggregated Statistics For Year 2000 (Based on 6 partial tracts)
A) FHA, FSA/RHS & VA Home Purchase Loans
B) Conventional Home Purchase Loans
C) Refinancings
D) Home Improvement Loans
E) Loans on Dwellings For 5+ Families
F) Non-occupant Loans on < 5 Family Dwellings (A B C & D)
Number
Average Value
Number
Average Value
Number
Average Value
Number
Average Value
Number
Average Value
Number
Average Value
LOANS ORIGINATED
16
$84,624
39
$90,641
34
$84,768
17
$12,879
1
$11,200
4
$62,155
APPLICATIONS APPROVED, NOT ACCEPTED
0
$0
9
$93,641
11
$51,228
7
$49,531
0
$0
1
$54,450
APPLICATIONS DENIED
2
$52,030
18
$64,562
49
$57,837
15
$17,713
0
$0
2
$83,250
APPLICATIONS WITHDRAWN
4
$78,480
6
$75,250
29
$67,857
2
$28,800
0
$0
0
$0
FILES CLOSED FOR INCOMPLETENESS
1
$125,660
0
$0
5
$62,608
2
$21,990
0
$0
0
$0
Aggregated Statistics For Year 1999 (Based on 3 partial tracts)
A) FHA, FSA/RHS & VA Home Purchase Loans
B) Conventional Home Purchase Loans
C) Refinancings
D) Home Improvement Loans
F) Non-occupant Loans on < 5 Family Dwellings (A B C & D)
Detailed PMIC statistics for the following Tracts:0519.01
, 0940.00
2002 - 2018 National Fire Incident Reporting System (NFIRS) incidents
Based on the data from the years 2002 - 2018 the average number of fire incidents per year is 11. The highest number of fire incidents - 28 took place in 2004, and the least - 1 in 2016. The data has a decreasing trend.
When looking into fire subcategories, the most reports belonged to: Structure Fires (46.8%), and Outside Fires (39.2%).
Fire incident types reported to NFIRS in Zip Code 12154
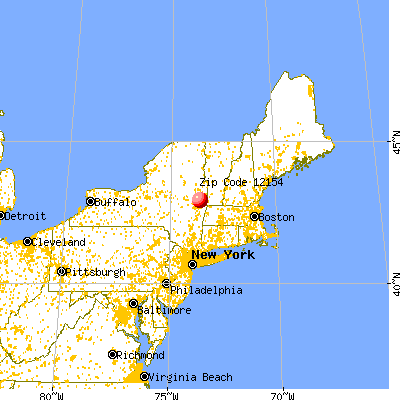


 Nearest zip codes: 12170, 12185, 12121, 12118, 12094, 12182.
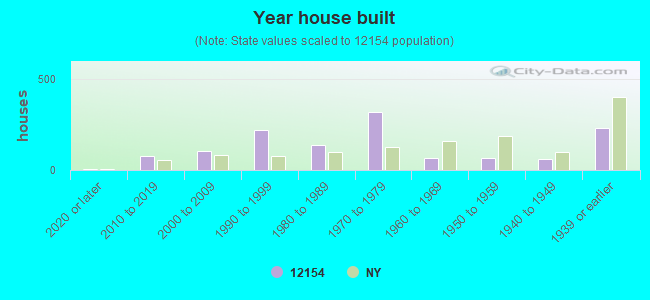


 Based on the data from the years 2002 - 2018 the average number of fire incidents per year is 11. The highest number of fire incidents - 28 took place in 2004, and the least - 1 in 2016. The data has a decreasing trend.
 When looking into fire subcategories, the most reports belonged to: Structure Fires (46.8%), and Outside Fires (39.2%).