Estimated zip code population in 2022: 2,375 Zip code population in 2010: 2,438 Zip code population in 2000: 2,499
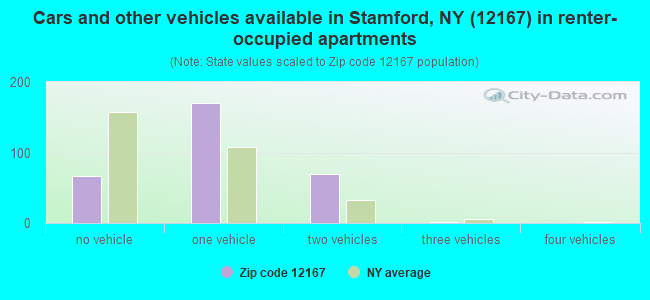
Houses and condos: 1,599 Renter-occupied apartments: 306
% of renters here:
29%
State:
46%
March 2022 cost of living index in zip code 12167: 95.0 (less than average, U.S. average is 100)
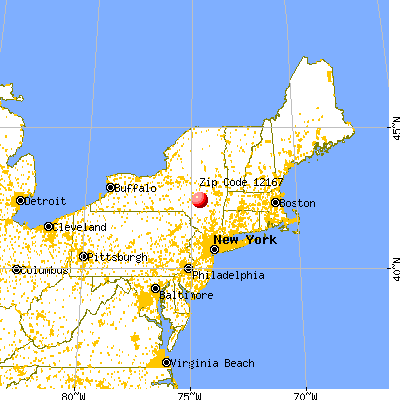
Land area: 45.7 sq. mi. Water area: 0.3 sq. mi.
Population density: 52 people per square mile
(very low).
OSM Map
General Map
Google Map
MSN Map
OSM Map
General Map
Google Map
MSN Map
OSM Map
General Map
Google Map
MSN Map
OSM Map
General Map
Google Map
MSN Map
Please wait while loading the map...
Real estate property taxes paid for housing units in 2022:
This zip code:
1.8% ($3,291)
New York:
1.5% ($6,180)
Median real estate property taxes paid for housing units with mortgages in 2022: $3,055 (1.7%) Median real estate property taxes paid for housing units with no mortgage in 2022: $3,425 (1.8%)
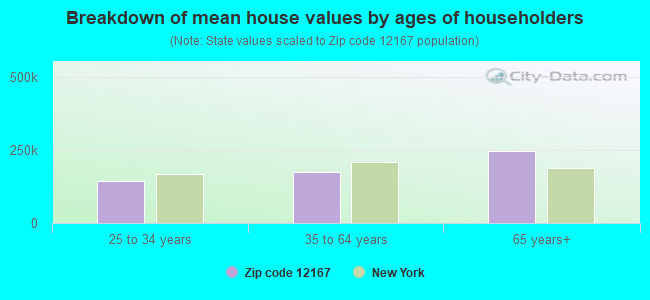
Estimated median house/condo value in 2022: $181,593
12167:
$181,593
New York:
$400,400
According to our research of New York and other state lists, there were 2 registered sex offenders living in 12167 zip code as of April 24, 2024. The ratio of all residents to sex offenders in zip code 12167 is 1,494 to 1. The ratio of registered sex offenders to all residents in this zip code is lower than the state average.
Median resident age:
This zip code:
53.0 years
New York median age:
40.0 years
Average household size:
This zip code:
2.2 people
New York:
2.5 people
Averages for the 2020 tax year for zip code 12167, filed in 2021:
Average Adjusted Gross Income (AGI) in 2020: $55,303 (Individual Income Tax Returns)
Here:
$55,303
State:
$90,930
Salary/wage: $46,513 (reported on 75.9% of returns)
Here:
$46,513
State:
$72,104
(% of AGI for various income ranges: 1091.7% for AGIs below $25k, 3570.0% for AGIs $25k-50k, 5447.7% for AGIs $50k-75k, 7597.1% for AGIs $75k-100k, 12373.3% for AGIs $100k-200k)
Taxable interest for individuals: $834 (reported on 40.7% of returns)
This zip code:
$834
New York:
$3,075
(% of AGI for various income ranges: 30.0% for AGIs below $25k, 38.0% for AGIs $25k-50k, 30.0% for AGIs $50k-75k, 80.0% for AGIs $75k-100k, 88.9% for AGIs $100k-200k)
Ordinary dividends: $3,488 (reported on 22.2% of returns)
Here:
$3,488
State:
$11,095
(% of AGI for various income ranges: 52.9% for AGIs below $25k, 59.5% for AGIs $25k-50k, 69.2% for AGIs $50k-75k, 178.6% for AGIs $75k-100k, 417.8% for AGIs $100k-200k)
Net capital gain/loss in AGI: +$3,255 (reported on 18.5% of returns)
Here:
+$3,255
State:
+$44,925
(% of AGI for various income ranges: 3.8% for AGIs below $25k, 21.0% for AGIs $25k-50k, 119.2% for AGIs $50k-75k, 124.3% for AGIs $75k-100k, 397.8% for AGIs $100k-200k)
Profit/loss from business: +$10,176 (reported on 15.7% of returns)
Here:
+$10,176
State:
+$14,940
(% of AGI for various income ranges: 88.8% for AGIs below $25k, 60.0% for AGIs $25k-50k, 523.8% for AGIs $50k-75k, 795.6% for AGIs $100k-200k)
Taxable individual retirement arrangement distribution: $12,900 (reported on 13.9% of returns)
12167:
$12,900
New York:
$19,609
(% of AGI for various income ranges: 87.9% for AGIs below $25k, 293.5% for AGIs $25k-50k, 768.6% for AGIs $75k-100k, 665.6% for AGIs $100k-200k)
Total itemized deductions: $20,475 (reported on 3.7% of returns)
Here:
$20,475
State:
$39,326
(% of AGI for various income ranges: 910.0% for AGIs $100k-200k)
Charity contributions: $2,400 (reported on 1.9% of returns)
Here:
$2,400
State:
$15,420
(% of AGI for various income ranges: 24.0% for AGIs $25k-50k)
Taxes paid: $7,575 (reported on 3.7% of returns)
12167:
$7,575
State:
$9,183
(% of AGI for various income ranges: 432.9% for AGIs $75k-100k)
Earned income credit: $2,100 (reported on 14.8% of returns)
Here:
$2,100
State:
$2,138
(% of AGI for various income ranges: 91.2% for AGIs below $25k, 58.5% for AGIs $25k-50k)
Percentage of individuals using paid preparers for their 2020 taxes: 95.4%
Here:
95%
State:
95%
(% for various income ranges: 94.6% for AGIs below $25k, 96.3% for AGIs $25k-50k, 94.4% for AGIs $50k-75k, 100.0% for AGIs $75k-100k, 92.3% for AGIs $100k-200k, 100.0% for AGIs over 200k)
Averages for the 2012 tax year for zip code 12167, filed in 2013:
Average Adjusted Gross Income (AGI) in 2012: $43,750 (Individual Income Tax Returns)
Here:
$43,750
State:
$77,088
Salary/wage: $37,726 (reported on 77.2% of returns)
Here:
$37,726
State:
$60,593
(% of AGI for various income ranges: 66.6% for AGIs below $25k, 75.7% for AGIs $25k-50k, 69.9% for AGIs $50k-75k, 69.4% for AGIs $75k-100k, 56.3% for AGIs $100k-200k)
Taxable interest for individuals: $980 (reported on 44.7% of returns)
This zip code:
$980
New York:
$3,125
(% of AGI for various income ranges: 2.3% for AGIs below $25k, 1.2% for AGIs $25k-50k, 0.7% for AGIs $50k-75k, 0.4% for AGIs $75k-100k, 0.9% for AGIs $100k-200k)
Ordinary dividends: $3,077 (reported on 22.8% of returns)
Here:
$3,077
State:
$10,299
(% of AGI for various income ranges: 2.8% for AGIs below $25k, 1.8% for AGIs $25k-50k, 1.4% for AGIs $50k-75k, 1.2% for AGIs $75k-100k, 1.4% for AGIs $100k-200k)
Net capital gain/loss in AGI: +$3,274 (reported on 16.7% of returns)
Here:
+$3,274
State:
+$42,474
(% of AGI for various income ranges: 0.5% for AGIs $50k-75k, 0.6% for AGIs $75k-100k, 3.6% for AGIs $100k-200k)
Profit/loss from business: +$9,847 (reported on 14.9% of returns)
Here:
+$9,847
State:
+$16,168
(% of AGI for various income ranges: 9.0% for AGIs below $25k, 1.2% for AGIs $25k-50k, 4.3% for AGIs $50k-75k, 3.8% for AGIs $100k-200k)
Taxable individual retirement arrangement distribution: $8,843 (reported on 12.3% of returns)
12167:
$8,843
New York:
$17,621
(% of AGI for various income ranges: 4.2% for AGIs below $25k, 3.1% for AGIs $25k-50k, 1.6% for AGIs $50k-75k, 6.0% for AGIs $75k-100k)
Total itemized deductions: $18,304 (22% of AGI, reported on 24.6% of returns)
Here:
$18,304
State:
$34,985
Here:
22.2% of AGI
State:
21.3% of AGI
(% of AGI for various income ranges: 10.1% for AGIs below $25k, 8.6% for AGIs $25k-50k, 9.1% for AGIs $50k-75k, 10.7% for AGIs $75k-100k, 12.0% for AGIs $100k-200k)
Charity contributions: $2,009 (reported on 20.2% of returns)
Here:
$2,009
State:
$5,572
(% of AGI for various income ranges: 0.6% for AGIs below $25k, 0.7% for AGIs $25k-50k, 0.9% for AGIs $50k-75k, 0.9% for AGIs $75k-100k, 1.3% for AGIs $100k-200k)
Taxes paid: $8,236 (reported on 24.6% of returns)
12167:
$8,236
State:
$18,656
(% of AGI for various income ranges: 2.6% for AGIs below $25k, 2.8% for AGIs $25k-50k, 3.6% for AGIs $50k-75k, 4.6% for AGIs $75k-100k, 7.5% for AGIs $100k-200k)
Earned income credit: $1,991 (reported on 19.3% of returns)
Here:
$1,991
State:
$2,230
(% of AGI for various income ranges: 5.8% for AGIs below $25k, 0.8% for AGIs $25k-50k)
Percentage of individuals using paid preparers for their 2012 taxes: 65.8%
Here:
66%
State:
66%
(% for various income ranges: 62.0% for AGIs below $25k, 64.3% for AGIs $25k-50k, 64.7% for AGIs $50k-75k, 70.0% for AGIs $75k-100k, 88.9% for AGIs $100k-200k)
Averages for the 2004 tax year for zip code 12167, filed in 2005:
Average Adjusted Gross Income (AGI) in 2004: $34,829 (Individual Income Tax Returns)
Here:
$34,829
State:
$59,519
Salary/wage: $31,757 (reported on 79.3% of returns)
Here:
$31,757
State:
$50,673
(% of AGI for various income ranges: 123.7% for AGIs below $10k, 71.3% for AGIs $10k-25k, 75.5% for AGIs $25k-50k, 73.0% for AGIs $50k-75k, 73.1% for AGIs $75k-100k, 62.5% for AGIs over 100k)
Taxable interest for individuals: $1,500 (reported on 51.7% of returns)
This zip code:
$1,500
New York:
$2,377
(% of AGI for various income ranges: 8.3% for AGIs below $10k, 2.6% for AGIs $10k-25k, 2.1% for AGIs $25k-50k, 1.4% for AGIs $50k-75k, 1.2% for AGIs $75k-100k, 3.5% for AGIs over 100k)
Taxable dividends: $2,102 (reported on 29.6% of returns)
Here:
$2,102
State:
$5,394
(% of AGI for various income ranges: 11.6% for AGIs below $10k, 2.0% for AGIs $10k-25k, 1.4% for AGIs $25k-50k, 1.8% for AGIs $50k-75k, 0.8% for AGIs $75k-100k, 1.9% for AGIs over 100k)
Net capital gain/loss: +$3,828 (reported on 22.0% of returns)
Here:
+$3,828
State:
+$23,581
(% of AGI for various income ranges: -1.4% for AGIs below $10k, 2.3% for AGIs $10k-25k, 0.0% for AGIs $25k-50k, 1.6% for AGIs $50k-75k, -0.4% for AGIs $75k-100k, 9.3% for AGIs over 100k)
Profit/loss from business: +$6,804 (reported on 16.2% of returns)
Here:
+$6,804
State:
+$13,809
(% of AGI for various income ranges: 2.0% for AGIs below $10k, 7.3% for AGIs $10k-25k, 2.9% for AGIs $25k-50k, 3.4% for AGIs $50k-75k, 2.5% for AGIs over 100k)
IRA payment deduction: $2,978 (reported on 3.9% of returns)
12167:
$2,978
New York:
$3,115
Total itemized deductions: $15,042 (22% of AGI, reported on 22.8% of returns)
Here:
$15,042
State:
$25,864
Here:
22.3% of AGI
State:
21.9% of AGI
(% of AGI for various income ranges: 8.2% for AGIs $10k-25k, 8.2% for AGIs $25k-50k, 9.4% for AGIs $50k-75k, 12.4% for AGIs $75k-100k, 13.0% for AGIs over 100k)
Charity contributions deductions: $1,974 (3% of AGI, reported on 19.9% of returns)
Here:
$1,974
State:
$4,439
Here:
2.8% of AGI
State:
3.6% of AGI
(% of AGI for various income ranges: 0.9% for AGIs $10k-25k, 0.8% for AGIs $25k-50k, 0.9% for AGIs $50k-75k, 1.8% for AGIs $75k-100k, 1.7% for AGIs over 100k)
Total tax: $4,396 (reported on 74.5% of returns)
12167:
$4,396
State:
$11,730
(% of AGI for various income ranges: 3.4% for AGIs below $10k, 4.3% for AGIs $10k-25k, 6.6% for AGIs $25k-50k, 9.7% for AGIs $50k-75k, 11.6% for AGIs $75k-100k, 15.6% for AGIs over 100k)
Earned income credit: $1,730 (reported on 16.8% of returns)
Here:
$1,730
State:
$1,757
Percentage of individuals using paid preparers for their 2004 taxes: 64.9%
Here:
65%
State:
67%
(% for various income ranges: 58.9% for AGIs below $10k, 63.7% for AGIs $10k-25k, 66.8% for AGIs $25k-50k, 70.9% for AGIs $50k-75k, 59.0% for AGIs $75k-100k, 77.4% for AGIs over 100k)
Household received Food Stamps/SNAP in the past 12 months: 220 Household did not receive Food Stamps/SNAP in the past 12 months: 842
Women who had a birth in the past 12 months: 16 (6 now married, 10 unmarried) Women who did not have a birth in the past 12 months: 442 (182 now married, 259 unmarried)
Housing units in zip code 12167 with a mortgage: 276 (30 second mortgage, 27 both second mortgage and home equity loan) Houses without a mortgage: 3
Median monthly owner costs for units with a mortgage: $1,212 Median monthly owner costs for units without a mortgage: $591
Residents with income below the poverty level in 2022:
This zip code:
18.4%
Whole state:
14.3%
Residents with income below 50% of the poverty level in 2022:
This zip code:
13.7%
Whole state:
6.8%
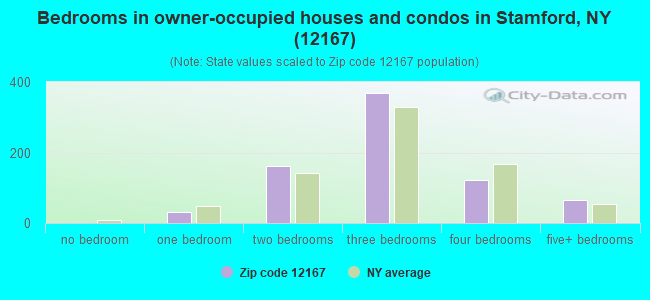
Median number of rooms in houses and condos:
Here:
6.0
State:
6.3
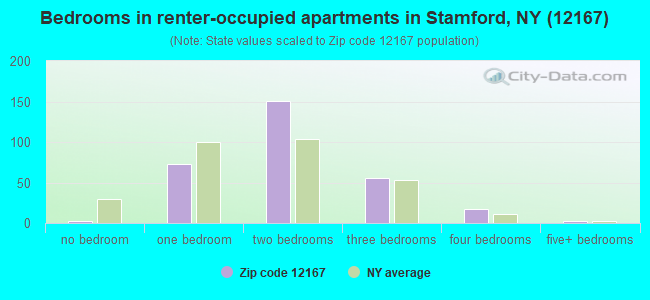
Median number of rooms in apartments:
Here:
4.2
State:
3.8
Notable locations in this zip code not listed on our city pages
Notable locations in zip code 12167: Welch Corners (A), Stamford Sewage Treatment Plant (B), Stamford Golf Club (C), Robinson Terrace (D), Seventh Heaven Assisted Living Center (E), Stamford Village Library (F). Display/hide their locations on the map
Churches in zip code 12167 include: Brimstone Church (A), Stamford Baptist Church (B), Stamford First Presbyterian Church (C), Stamford United Methodist Church (D), Trinity Lutheran Church (E), Kingdom Hall of Jehovahs Witnesses (F), Sacred Heart Church (G). Display/hide their locations on the map
Cemeteries: Ruliffson Cemetery (1), Sacred Heart Cemetery (2), Shew Cemetery (3), Stamford Cemetery (4), Stevens Cemetery (5), Maynard Cemetery (6), Potter Hill Cemetery (7). Display/hide their locations on the map
229 married couples with children.
96 single-parent households (35 men, 61 women).
93.6% of residents of 12167 zip code speak English at home.
2.1% of residents speak Spanish at home (96% very well, 4% not well).
4.4% of residents speak other Indo-European language at home (72% very well, 14% well, 14% not well).
0.2% of residents speak Asian or Pacific Island language at home (25% well, 75% not well).
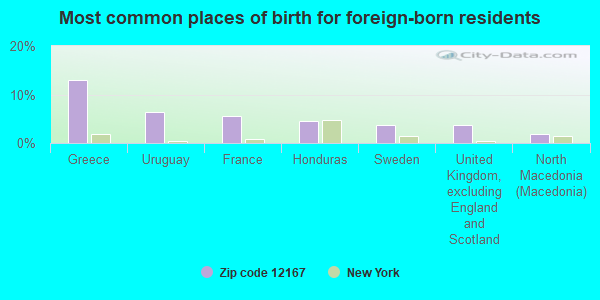
Foreign born population: 109 (4.6%) (65.7% of them are naturalized citizens)
This zip code:
4.6%
Whole state:
22.7%
13%Greece
6%Uruguay
6%France
5%Honduras
4%Sweden
4%United Kingdom, excluding England and Scotland
2%North Macedonia (Macedonia)
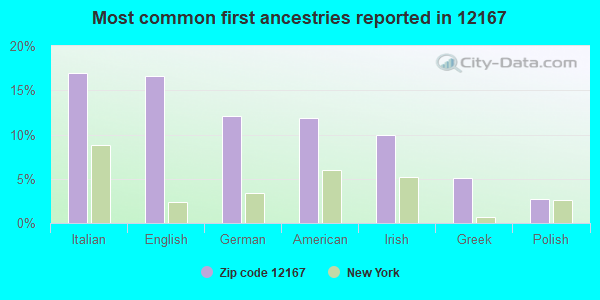
17%Italian
17%English
12%German
12%American
10%Irish
5%Greek
3%Polish
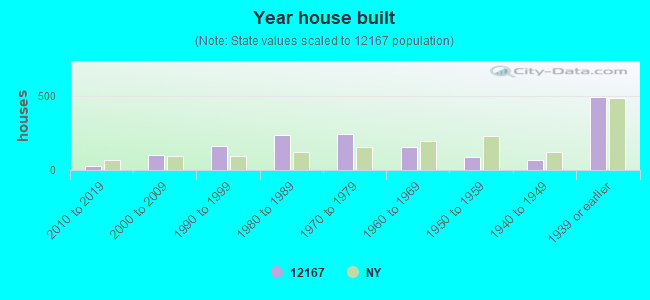
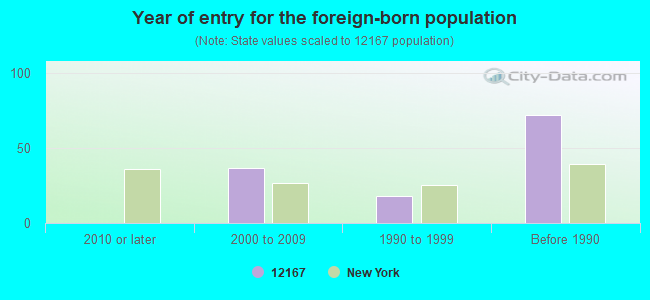
Year of entry for the foreign-born population
02010 or later
372000 to 2009
181990 to 1999
72Before 1990
Facilities with environmental interests located in this zip code:
HIGHWAY MAINTENANCE SUBHEAD (ROUTE 23 in STAMFORD, NY)
National Pollutant Discharge Elimination System NON-MAJOR (Tracking pollutant discharge elimination systems) - permit Business SIC classification: TERMINAL AND JOINT TERMINAL MAINTENANCE FACILITIES FOR MOTOR FREIGHT TRANSPORTATION Organizations: NYS DEPT OF TRANSPORTATION (CONTACT/OWNER)
Alternative names: NYS DEPT OF TRANSPORTATION
Housing units lacking complete plumbing facilities: 2.8% Housing units lacking complete kitchen facilities: 1.6%
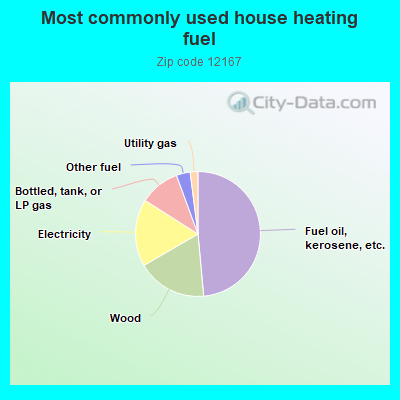
48.6%Fuel oil, kerosene, etc.
18.1%Wood
17.4%Electricity
10.4%Bottled, tank, or LP gas
3.6%Other fuel
2.0%Utility gas
Population in 1990: 2,734.
Place of birth for U.S.-born residents:
This state: 1,908
Northeast: 203
Midwest: 46
South: 55
West: 21
55% of the 12167 zip code residents lived in the same house 5 years ago. Out of people who lived in different houses, 38% lived in this county. Out of people who lived in different counties, 50% lived in New York.
88% of the 12167 zip code residents lived in the same house 1 year ago. Out of people who lived in different houses, 39% moved from this county. Out of people who lived in different houses, 35% moved from different county within same state. Out of people who lived in different houses, 27% moved from different state.
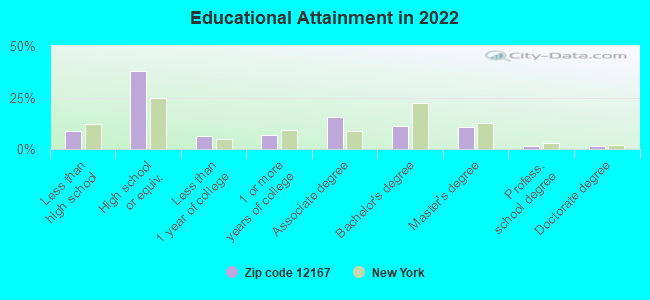
Private vs. public school enrollment:
Students in private schools in grades 1 to 8 (elementary and middle school): 2
Here:
1.7%
New York:
15.6%
Students in private schools in grades 9 to 12 (high school): 16
Here:
13.6%
New York:
15.0%
Students in private undergraduate colleges: 1
Here:
4.4%
New York:
39.2%
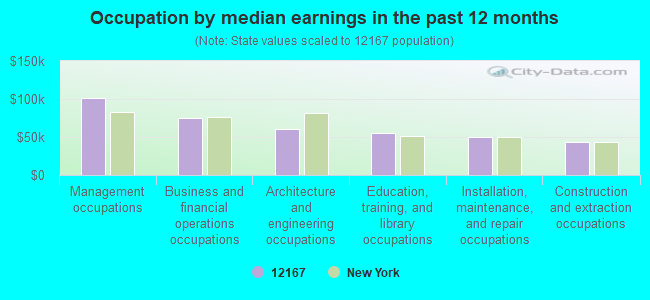
Occupation by median earnings in the past 12 months ($)
100,849Management occupations
75,059Business and financial operations occupations
61,091Architecture and engineering occupations
54,707Education, training, and library occupations
50,269Installation, maintenance, and repair occupations
43,647Construction and extraction occupations
Companies with federal contracts located in this zip code:
AUDIOSEARS CORPORATION (2 SOUTH STREET in STAMFORD, NY)
$51,325 with Defense Logistics Agency for Headsets, Handsets, Microphones and Speakers. Signed on 2004-06-29. Completion date: 2004-09-25.
Top industries in this zip code by the number of employees in 2005:
Other Services (except Public Administration): Environment, Conservation and Wildlife Organizations (250-499 employees: 1 establishment)
Health Care and Social Assistance: Nursing Care Facilities (100-249: 1, 5-9: 1)
Other Services (except Public Administration): Other Similar Organizations (except Business, Professional, Labor, and Political Organizations) (20-49: 1, 5-9: 1)
Finance and Insurance: Commercial Banking (20-49: 1)
Accommodation and Food Services: Full-Service Restaurants (10-19: 2, 1-4: 1)
People in group quarters in 2010:
115 people in nursing facilities/skilled-nursing facilities
4 people in group homes intended for adults
People in group quarters in 2000:
119 people in nursing homes
16 people in other noninstitutional group quarters
Fatal accident statistics in 2011:
Fatal accident count: 1
Vehicles involved in fatal accidents: 1
Fatal accidents caused by drunken drivers: 0
Fatalities: 1
Persons involved in fatal accidents: 1
Pedestrians involved in fatal accidents: 1
Home Mortgage Disclosure Act Aggregated Statistics For Year 2009 (Based on 2 partial tracts)
A) FHA, FSA/RHS & VA Home Purchase Loans
B) Conventional Home Purchase Loans
C) Refinancings
D) Home Improvement Loans
F) Non-occupant Loans on < 5 Family Dwellings (A B C & D)
G) Loans On Manufactured Home Dwelling (A B C & D)
Number
Average Value
Number
Average Value
Number
Average Value
Number
Average Value
Number
Average Value
Number
Average Value
LOANS ORIGINATED
1
$76,880
3
$127,280
7
$124,166
1
$111,110
4
$117,552
1
$45,000
APPLICATIONS APPROVED, NOT ACCEPTED
0
$0
0
$0
1
$145,800
0
$0
0
$0
0
$0
APPLICATIONS DENIED
0
$0
1
$119,080
5
$137,686
1
$12,420
1
$172,280
1
$106,890
APPLICATIONS WITHDRAWN
0
$0
0
$0
3
$144,000
0
$0
0
$0
0
$0
FILES CLOSED FOR INCOMPLETENESS
0
$0
0
$0
0
$0
0
$0
0
$0
0
$0
Aggregated Statistics For Year 2008 (Based on 2 partial tracts)
A) FHA, FSA/RHS & VA Home Purchase Loans
B) Conventional Home Purchase Loans
C) Refinancings
D) Home Improvement Loans
F) Non-occupant Loans on < 5 Family Dwellings (A B C & D)
G) Loans On Manufactured Home Dwelling (A B C & D)
Number
Average Value
Number
Average Value
Number
Average Value
Number
Average Value
Number
Average Value
Number
Average Value
LOANS ORIGINATED
1
$135,720
4
$132,962
8
$146,618
2
$51,450
4
$204,220
2
$64,810
APPLICATIONS APPROVED, NOT ACCEPTED
0
$0
1
$99,620
2
$151,890
1
$31,410
1
$146,270
1
$85,090
APPLICATIONS DENIED
0
$0
3
$72,663
10
$143,289
2
$43,835
2
$116,965
2
$67,860
APPLICATIONS WITHDRAWN
0
$0
0
$0
3
$157,283
0
$0
0
$0
0
$0
FILES CLOSED FOR INCOMPLETENESS
0
$0
0
$0
1
$191,500
0
$0
0
$0
0
$0
Aggregated Statistics For Year 2007 (Based on 2 partial tracts)
A) FHA, FSA/RHS & VA Home Purchase Loans
B) Conventional Home Purchase Loans
C) Refinancings
D) Home Improvement Loans
F) Non-occupant Loans on < 5 Family Dwellings (A B C & D)
G) Loans On Manufactured Home Dwelling (A B C & D)
Number
Average Value
Number
Average Value
Number
Average Value
Number
Average Value
Number
Average Value
Number
Average Value
LOANS ORIGINATED
1
$81,100
8
$127,074
13
$129,497
2
$47,700
4
$164,608
2
$69,150
APPLICATIONS APPROVED, NOT ACCEPTED
0
$0
2
$86,495
3
$130,717
1
$21,100
1
$123,060
1
$32,350
APPLICATIONS DENIED
0
$0
5
$110,214
14
$154,201
6
$85,400
3
$144,623
4
$64,402
APPLICATIONS WITHDRAWN
0
$0
1
$172,520
6
$130,990
0
$0
1
$59,300
1
$68,440
FILES CLOSED FOR INCOMPLETENESS
0
$0
0
$0
2
$148,490
0
$0
0
$0
0
$0
Aggregated Statistics For Year 2006 (Based on 2 partial tracts)
B) Conventional Home Purchase Loans
C) Refinancings
D) Home Improvement Loans
F) Non-occupant Loans on < 5 Family Dwellings (A B C & D)
G) Loans On Manufactured Home Dwelling (A B C & D)
Number
Average Value
Number
Average Value
Number
Average Value
Number
Average Value
Number
Average Value
LOANS ORIGINATED
8
$127,045
16
$98,829
4
$72,898
4
$144,098
3
$56,880
APPLICATIONS APPROVED, NOT ACCEPTED
1
$132,900
3
$129,937
0
$0
0
$0
0
$0
APPLICATIONS DENIED
3
$98,683
15
$111,746
3
$55,473
2
$99,620
2
$75,360
APPLICATIONS WITHDRAWN
0
$0
5
$148,704
0
$0
0
$0
0
$0
FILES CLOSED FOR INCOMPLETENESS
0
$0
4
$137,182
0
$0
1
$41,490
0
$0
Aggregated Statistics For Year 2005 (Based on 2 partial tracts)
A) FHA, FSA/RHS & VA Home Purchase Loans
B) Conventional Home Purchase Loans
C) Refinancings
D) Home Improvement Loans
F) Non-occupant Loans on < 5 Family Dwellings (A B C & D)
G) Loans On Manufactured Home Dwelling (A B C & D)
Number
Average Value
Number
Average Value
Number
Average Value
Number
Average Value
Number
Average Value
Number
Average Value
LOANS ORIGINATED
1
$159,630
11
$165,742
14
$95,200
3
$65,240
8
$145,445
3
$91,573
APPLICATIONS APPROVED, NOT ACCEPTED
0
$0
3
$166,813
5
$94,886
0
$0
2
$187,755
1
$69,850
APPLICATIONS DENIED
0
$0
4
$107,940
15
$79,883
2
$39,260
2
$99,970
4
$56,372
APPLICATIONS WITHDRAWN
0
$0
2
$122,590
9
$102,850
1
$164,780
2
$102,315
2
$66,570
FILES CLOSED FOR INCOMPLETENESS
0
$0
0
$0
4
$91,825
0
$0
0
$0
0
$0
Aggregated Statistics For Year 2004 (Based on 2 partial tracts)
A) FHA, FSA/RHS & VA Home Purchase Loans
B) Conventional Home Purchase Loans
C) Refinancings
D) Home Improvement Loans
F) Non-occupant Loans on < 5 Family Dwellings (A B C & D)
G) Loans On Manufactured Home Dwelling (A B C & D)
Number
Average Value
Number
Average Value
Number
Average Value
Number
Average Value
Number
Average Value
Number
Average Value
LOANS ORIGINATED
1
$75,240
10
$103,347
15
$89,009
3
$40,240
6
$121,967
3
$54,693
APPLICATIONS APPROVED, NOT ACCEPTED
0
$0
1
$40,320
2
$73,015
1
$18,750
0
$0
1
$33,750
APPLICATIONS DENIED
0
$0
3
$65,477
10
$75,828
4
$39,320
1
$79,230
0
$0
APPLICATIONS WITHDRAWN
0
$0
1
$99,150
8
$81,366
1
$131,970
1
$90,480
0
$0
FILES CLOSED FOR INCOMPLETENESS
0
$0
0
$0
2
$79,110
0
$0
0
$0
0
$0
Aggregated Statistics For Year 2003 (Based on 2 partial tracts)
A) FHA, FSA/RHS & VA Home Purchase Loans
B) Conventional Home Purchase Loans
C) Refinancings
D) Home Improvement Loans
F) Non-occupant Loans on < 5 Family Dwellings (A B C & D)
Number
Average Value
Number
Average Value
Number
Average Value
Number
Average Value
Number
Average Value
LOANS ORIGINATED
1
$69,620
8
$79,638
20
$82,720
0
$0
8
$73,221
APPLICATIONS APPROVED, NOT ACCEPTED
0
$0
4
$51,685
3
$67,897
0
$0
1
$113,450
APPLICATIONS DENIED
0
$0
2
$53,090
11
$105,075
2
$20,745
2
$92,820
APPLICATIONS WITHDRAWN
0
$0
2
$91,180
8
$86,200
0
$0
1
$49,220
FILES CLOSED FOR INCOMPLETENESS
0
$0
0
$0
0
$0
0
$0
0
$0
Aggregated Statistics For Year 2002 (Based on 2 partial tracts)
A) FHA, FSA/RHS & VA Home Purchase Loans
B) Conventional Home Purchase Loans
C) Refinancings
D) Home Improvement Loans
F) Non-occupant Loans on < 5 Family Dwellings (A B C & D)
Number
Average Value
Number
Average Value
Number
Average Value
Number
Average Value
Number
Average Value
LOANS ORIGINATED
1
$111,570
7
$61,916
11
$82,275
1
$37,970
4
$59,830
APPLICATIONS APPROVED, NOT ACCEPTED
0
$0
3
$49,223
3
$61,333
1
$18,750
0
$0
APPLICATIONS DENIED
0
$0
3
$42,347
7
$74,774
2
$20,395
1
$134,080
APPLICATIONS WITHDRAWN
0
$0
0
$0
3
$68,443
1
$32,820
0
$0
FILES CLOSED FOR INCOMPLETENESS
0
$0
1
$48,760
2
$64,810
0
$0
0
$0
Aggregated Statistics For Year 2001 (Based on 2 partial tracts)
A) FHA, FSA/RHS & VA Home Purchase Loans
B) Conventional Home Purchase Loans
C) Refinancings
D) Home Improvement Loans
F) Non-occupant Loans on < 5 Family Dwellings (A B C & D)
Number
Average Value
Number
Average Value
Number
Average Value
Number
Average Value
Number
Average Value
LOANS ORIGINATED
1
$118,840
6
$54,498
10
$64,062
1
$33,750
4
$52,095
APPLICATIONS APPROVED, NOT ACCEPTED
0
$0
1
$54,620
1
$114,620
1
$33,050
0
$0
APPLICATIONS DENIED
0
$0
4
$41,430
9
$60,892
2
$19,925
1
$68,210
APPLICATIONS WITHDRAWN
0
$0
0
$0
5
$62,678
0
$0
0
$0
FILES CLOSED FOR INCOMPLETENESS
0
$0
0
$0
1
$115,790
0
$0
0
$0
Aggregated Statistics For Year 2000 (Based on 2 partial tracts)
A) FHA, FSA/RHS & VA Home Purchase Loans
B) Conventional Home Purchase Loans
C) Refinancings
D) Home Improvement Loans
F) Non-occupant Loans on < 5 Family Dwellings (A B C & D)
Number
Average Value
Number
Average Value
Number
Average Value
Number
Average Value
Number
Average Value
LOANS ORIGINATED
2
$58,950
5
$79,978
3
$63,833
2
$11,015
2
$56,490
APPLICATIONS APPROVED, NOT ACCEPTED
0
$0
1
$44,540
1
$103,140
0
$0
0
$0
APPLICATIONS DENIED
0
$0
5
$49,928
7
$41,757
2
$11,135
0
$0
APPLICATIONS WITHDRAWN
0
$0
1
$48,520
7
$44,167
1
$12,890
0
$0
FILES CLOSED FOR INCOMPLETENESS
0
$0
0
$0
1
$79,230
0
$0
0
$0
Aggregated Statistics For Year 1999 (Based on 1 partial tract)
A) FHA, FSA/RHS & VA Home Purchase Loans
B) Conventional Home Purchase Loans
C) Refinancings
D) Home Improvement Loans
F) Non-occupant Loans on < 5 Family Dwellings (A B C & D)


 Nearest zip codes: 12093, 12434, 12474, 13786, 12131, 12175.