Estimated zip code population in 2022: 2,091 Zip code population in 2010: 2,411 Zip code population in 2000: 2,105
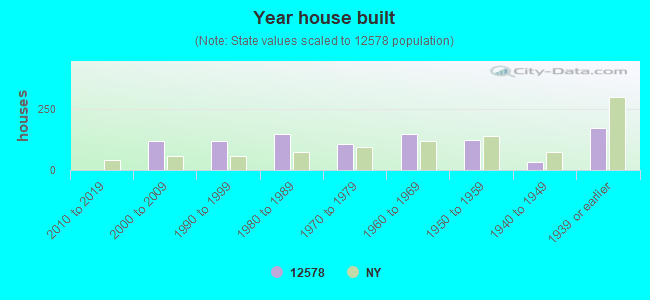
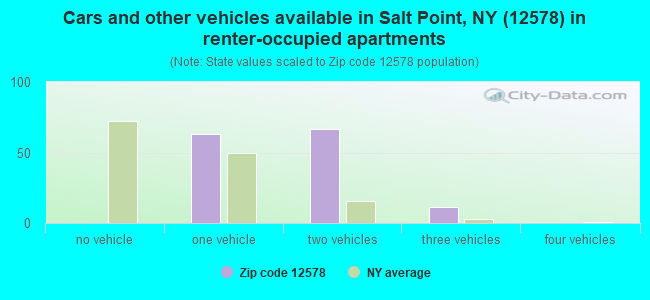
Houses and condos: 974 Renter-occupied apartments: 142
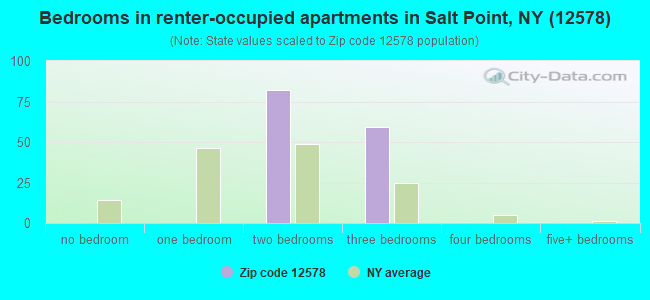
% of renters here:
16%
State:
46%
March 2022 cost of living index in zip code 12578: 118.0 (more than average, U.S. average is 100)
Land area: 15.7 sq. mi. Water area: 0.2 sq. mi.
Population density: 134 people per square mile
(very low).
OSM Map
General Map
Google Map
MSN Map
OSM Map
General Map
Google Map
MSN Map
OSM Map
General Map
Google Map
MSN Map
OSM Map
General Map
Google Map
MSN Map
Please wait while loading the map...
Real estate property taxes paid for housing units in 2022:
This zip code:
2.0% ($7,238)
New York:
1.5% ($6,180)
Median real estate property taxes paid for housing units with mortgages in 2022: $7,286 (1.9%) Median real estate property taxes paid for housing units with no mortgage in 2022: $7,180 (2.1%)
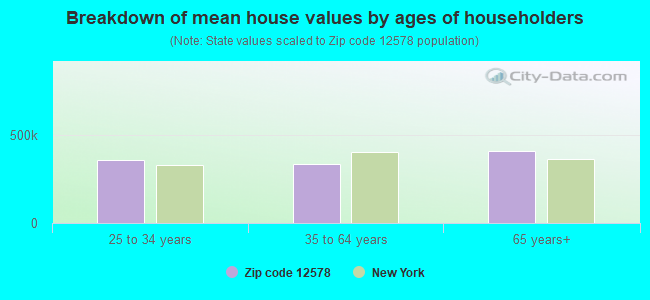
Estimated median house/condo value in 2022: $369,857
12578:
$369,857
New York:
$400,400
According to our research of New York and other state lists, there were 2 registered sex offenders living in 12578 zip code as of April 25, 2024. The ratio of all residents to sex offenders in zip code 12578 is 1,077 to 1. The ratio of registered sex offenders to all residents in this zip code is near the state average.
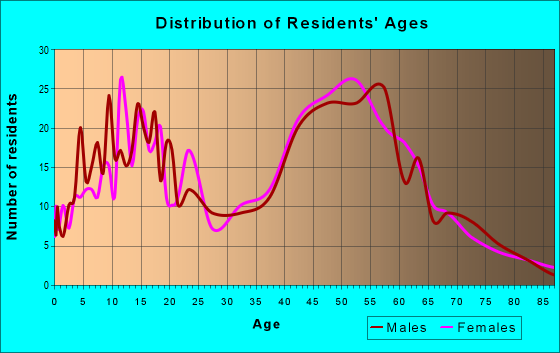
Median resident age:
This zip code:
49.2 years
New York median age:
40.0 years
Average household size:
This zip code:
2.3 people
New York:
2.5 people
Averages for the 2020 tax year for zip code 12578, filed in 2021:
Average Adjusted Gross Income (AGI) in 2020: $98,860 (Individual Income Tax Returns)
Here:
$98,860
State:
$90,930
Salary/wage: $79,361 (reported on 79.8% of returns)
Here:
$79,361
State:
$72,104
(% of AGI for various income ranges: 1134.5% for AGIs below $25k, 3852.8% for AGIs $25k-50k, 6698.2% for AGIs $50k-75k, 9297.5% for AGIs $75k-100k, 18947.1% for AGIs $100k-200k, 93436.7% for AGIs over 200k)
Taxable interest for individuals: $1,738 (reported on 46.8% of returns)
This zip code:
$1,738
New York:
$3,075
(% of AGI for various income ranges: 23.5% for AGIs below $25k, 36.7% for AGIs $25k-50k, 37.3% for AGIs $50k-75k, 86.2% for AGIs $75k-100k, 175.7% for AGIs $100k-200k, 1796.7% for AGIs over 200k)
Ordinary dividends: $5,993 (reported on 33.9% of returns)
Here:
$5,993
State:
$11,095
(% of AGI for various income ranges: 46.0% for AGIs below $25k, 78.9% for AGIs $25k-50k, 132.7% for AGIs $50k-75k, 215.0% for AGIs $75k-100k, 480.0% for AGIs $100k-200k, 4310.0% for AGIs over 200k)
Net capital gain/loss in AGI: +$12,344 (reported on 27.4% of returns)
Here:
+$12,344
State:
+$44,925
(% of AGI for various income ranges: 55.0% for AGIs $25k-50k, 18.2% for AGIs $50k-75k, 418.8% for AGIs $75k-100k, 990.7% for AGIs $100k-200k, 7890.0% for AGIs over 200k)
Profit/loss from business: +$19,919 (reported on 16.9% of returns)
Here:
+$19,919
State:
+$14,940
(% of AGI for various income ranges: 107.5% for AGIs below $25k, 214.4% for AGIs $25k-50k, 344.5% for AGIs $50k-75k, 335.0% for AGIs $75k-100k, 657.1% for AGIs $100k-200k, 6716.7% for AGIs over 200k)
Taxable individual retirement arrangement distribution: $30,300 (reported on 11.3% of returns)
12578:
$30,300
New York:
$19,609
(% of AGI for various income ranges: 116.5% for AGIs below $25k, 395.5% for AGIs $50k-75k, 832.1% for AGIs $100k-200k, 8030.0% for AGIs over 200k)
Total itemized deductions: $38,567 (reported on 12.1% of returns)
Here:
$38,567
State:
$39,326
(% of AGI for various income ranges: 705.5% for AGIs $50k-75k, 677.5% for AGIs $75k-100k, 1087.1% for AGIs $100k-200k, 9816.7% for AGIs over 200k)
Charity contributions: $15,285 (reported on 10.5% of returns)
Here:
$15,285
State:
$15,420
(% of AGI for various income ranges: 90.0% for AGIs $50k-75k, 238.6% for AGIs $100k-200k, 5180.0% for AGIs over 200k)
Taxes paid: $9,473 (reported on 12.1% of returns)
12578:
$9,473
State:
$9,183
(% of AGI for various income ranges: 227.3% for AGIs $50k-75k, 218.8% for AGIs $75k-100k, 347.9% for AGIs $100k-200k, 1696.7% for AGIs over 200k)
Earned income credit: $1,640 (reported on 8.1% of returns)
Here:
$1,640
State:
$2,138
(% of AGI for various income ranges: 41.5% for AGIs below $25k, 45.0% for AGIs $25k-50k)
Percentage of individuals using paid preparers for their 2020 taxes: 94.4%
Here:
94%
State:
95%
(% for various income ranges: 96.7% for AGIs below $25k, 95.8% for AGIs $25k-50k, 94.1% for AGIs $50k-75k, 92.3% for AGIs $75k-100k, 92.9% for AGIs $100k-200k, 91.7% for AGIs over 200k)
Averages for the 2012 tax year for zip code 12578, filed in 2013:
Average Adjusted Gross Income (AGI) in 2012: $88,082 (Individual Income Tax Returns)
Here:
$88,082
State:
$77,088
Salary/wage: $69,974 (reported on 83.9% of returns)
Here:
$69,974
State:
$60,593
(% of AGI for various income ranges: 76.5% for AGIs below $25k, 73.9% for AGIs $25k-50k, 70.2% for AGIs $50k-75k, 62.2% for AGIs $75k-100k, 79.5% for AGIs $100k-200k, 55.1% for AGIs over 200k)
Taxable interest for individuals: $1,028 (reported on 53.6% of returns)
This zip code:
$1,028
New York:
$3,125
(% of AGI for various income ranges: 1.0% for AGIs below $25k, 0.6% for AGIs $25k-50k, 0.8% for AGIs $50k-75k, 0.8% for AGIs $75k-100k, 0.3% for AGIs $100k-200k, 0.7% for AGIs over 200k)
Ordinary dividends: $4,497 (reported on 33.0% of returns)
Here:
$4,497
State:
$10,299
(% of AGI for various income ranges: 2.5% for AGIs below $25k, 0.7% for AGIs $25k-50k, 1.8% for AGIs $50k-75k, 1.8% for AGIs $75k-100k, 1.4% for AGIs $100k-200k, 2.0% for AGIs over 200k)
Net capital gain/loss in AGI: +$24,108 (reported on 23.2% of returns)
Here:
+$24,108
State:
+$42,474
(% of AGI for various income ranges: 1.7% for AGIs $100k-200k, 15.2% for AGIs over 200k)
Profit/loss from business: +$25,848 (reported on 18.8% of returns)
Here:
+$25,848
State:
+$16,168
(% of AGI for various income ranges: 4.9% for AGIs below $25k, 4.4% for AGIs $25k-50k, 3.6% for AGIs $50k-75k, 2.5% for AGIs $100k-200k, 10.0% for AGIs over 200k)
Taxable individual retirement arrangement distribution: $14,046 (reported on 11.6% of returns)
12578:
$14,046
New York:
$17,621
(% of AGI for various income ranges: 2.8% for AGIs below $25k, 3.3% for AGIs $25k-50k, 3.5% for AGIs $50k-75k, 2.2% for AGIs $75k-100k, 3.1% for AGIs $100k-200k)
Total itemized deductions: $29,987 (20% of AGI, reported on 48.2% of returns)
Here:
$29,987
State:
$34,985
Here:
20.0% of AGI
State:
21.3% of AGI
(% of AGI for various income ranges: 9.4% for AGIs below $25k, 13.3% for AGIs $25k-50k, 20.2% for AGIs $50k-75k, 17.7% for AGIs $75k-100k, 19.5% for AGIs $100k-200k, 14.1% for AGIs over 200k)
Charity contributions: $3,500 (reported on 41.1% of returns)
Here:
$3,500
State:
$5,572
(% of AGI for various income ranges: 0.9% for AGIs $25k-50k, 1.9% for AGIs $50k-75k, 1.2% for AGIs $75k-100k, 1.9% for AGIs $100k-200k, 1.8% for AGIs over 200k)
Taxes paid: $17,017 (reported on 47.3% of returns)
12578:
$17,017
State:
$18,656
(% of AGI for various income ranges: 3.4% for AGIs below $25k, 5.3% for AGIs $25k-50k, 9.8% for AGIs $50k-75k, 9.0% for AGIs $75k-100k, 10.1% for AGIs $100k-200k, 9.6% for AGIs over 200k)
Earned income credit: $1,920 (reported on 8.9% of returns)
Here:
$1,920
State:
$2,230
(% of AGI for various income ranges: 3.5% for AGIs below $25k, 0.8% for AGIs $25k-50k)
Percentage of individuals using paid preparers for their 2012 taxes: 59.8%
Here:
60%
State:
66%
(% for various income ranges: 51.4% for AGIs below $25k, 55.0% for AGIs $25k-50k, 68.8% for AGIs $50k-75k, 58.3% for AGIs $75k-100k, 66.7% for AGIs $100k-200k, 75.0% for AGIs over 200k)
Averages for the 2004 tax year for zip code 12578, filed in 2005:
Average Adjusted Gross Income (AGI) in 2004: $65,567 (Individual Income Tax Returns)
Here:
$65,567
State:
$59,519
Salary/wage: $56,747 (reported on 83.1% of returns)
Here:
$56,747
State:
$50,673
(% of AGI for various income ranges: 2981.0% for AGIs below $10k, 66.5% for AGIs $10k-25k, 75.2% for AGIs $25k-50k, 72.1% for AGIs $50k-75k, 82.7% for AGIs $75k-100k, 67.4% for AGIs over 100k)
Taxable interest for individuals: $990 (reported on 67.2% of returns)
This zip code:
$990
New York:
$2,377
(% of AGI for various income ranges: 142.9% for AGIs below $10k, 4.6% for AGIs $10k-25k, 0.9% for AGIs $25k-50k, 1.9% for AGIs $50k-75k, 0.6% for AGIs $75k-100k, 0.5% for AGIs over 100k)
Taxable dividends: $2,133 (reported on 38.4% of returns)
Here:
$2,133
State:
$5,394
(% of AGI for various income ranges: 209.5% for AGIs below $10k, 2.9% for AGIs $10k-25k, 1.5% for AGIs $25k-50k, 1.2% for AGIs $50k-75k, 0.5% for AGIs $75k-100k, 1.2% for AGIs over 100k)
Net capital gain/loss: +$8,466 (reported on 28.6% of returns)
Here:
+$8,466
State:
+$23,581
(% of AGI for various income ranges: -276.2% for AGIs below $10k, -0.8% for AGIs $10k-25k, 0.4% for AGIs $25k-50k, 1.8% for AGIs $50k-75k, 0.4% for AGIs $75k-100k, 6.2% for AGIs over 100k)
Profit/loss from business: +$12,525 (reported on 18.3% of returns)
Here:
+$12,525
State:
+$13,809
(% of AGI for various income ranges: -90.5% for AGIs below $10k, 12.6% for AGIs $10k-25k, 6.7% for AGIs $25k-50k, 2.9% for AGIs $50k-75k, 0.9% for AGIs $75k-100k, 3.0% for AGIs over 100k)
IRA payment deduction: $2,756 (reported on 4.1% of returns)
12578:
$2,756
New York:
$3,115
(% of AGI for various income ranges: 142.9% for AGIs below $10k, 0.4% for AGIs $25k-50k, 0.2% for AGIs $50k-75k, 0.1% for AGIs over 100k)
Self-employed pension: $15,182 (reported on 1.0% of returns)
Here:
$15,182
New York:
$19,016
Total itemized deductions: $23,503 (22% of AGI, reported on 48.2% of returns)
Here:
$23,503
State:
$25,864
Here:
21.5% of AGI
State:
21.9% of AGI
(% of AGI for various income ranges: 14.9% for AGIs $10k-25k, 17.4% for AGIs $25k-50k, 19.5% for AGIs $50k-75k, 21.2% for AGIs $75k-100k, 15.9% for AGIs over 100k)
Charity contributions deductions: $2,771 (2% of AGI, reported on 44.7% of returns)
Here:
$2,771
State:
$4,439
Here:
2.5% of AGI
State:
3.6% of AGI
(% of AGI for various income ranges: 1.5% for AGIs $10k-25k, 1.3% for AGIs $25k-50k, 2.1% for AGIs $50k-75k, 1.9% for AGIs $75k-100k, 2.0% for AGIs over 100k)
Total tax: $10,464 (reported on 82.0% of returns)
12578:
$10,464
State:
$11,730
(% of AGI for various income ranges: 123.8% for AGIs below $10k, 5.5% for AGIs $10k-25k, 7.3% for AGIs $25k-50k, 8.5% for AGIs $50k-75k, 9.9% for AGIs $75k-100k, 16.9% for AGIs over 100k)
Earned income credit: $1,317 (reported on 7.5% of returns)
Here:
$1,317
State:
$1,757
Percentage of individuals using paid preparers for their 2004 taxes: 59.6%
Here:
60%
State:
67%
(% for various income ranges: 52.9% for AGIs below $10k, 53.5% for AGIs $10k-25k, 62.6% for AGIs $25k-50k, 62.6% for AGIs $50k-75k, 69.4% for AGIs $75k-100k, 60.2% for AGIs over 100k)
Likely homosexual households (counted as self-reported same-sex unmarried-partner households)
Lesbian couples: 3.3% of all households
Gay men: 0.0% of all households
Household received Food Stamps/SNAP in the past 12 months: 9 Household did not receive Food Stamps/SNAP in the past 12 months: 858
Women who had a birth in the past 12 months: 9 (9 now married, 0 unmarried) Women who did not have a birth in the past 12 months: 363 (193 now married, 166 unmarried)
Housing units in zip code 12578 with a mortgage: 404 (51 second mortgage, 52 both second mortgage and home equity loan) Median monthly owner costs for units with a mortgage: $2,653 Median monthly owner costs for units without a mortgage: $991
Residents with income below the poverty level in 2022:
This zip code:
9.0%
Whole state:
14.3%
Residents with income below 50% of the poverty level in 2022:
This zip code:
5.3%
Whole state:
6.8%
Median number of rooms in houses and condos:
Here:
6.9
State:
6.3
Median number of rooms in apartments:
Here:
5.0
State:
3.8
Notable locations in this zip code not listed on our city pages
Notable locations in zip code 12578: Camp Nooteeming (A), Terhune Orchards (B), Hahn Farm (C), Birch Bark Acres (D), Salt Point Firehouse (E). Display/hide their locations on the map
Churches in zip code 12578 include: Central Baptist Church (A), Netherwood Baptist Church (B), Westminster Presbyterian Church (C). Display/hide their locations on the map
In group quarters: 27 (-1 institutionalized population)
Size of family households: 383 2-persons, 35 3-persons, 133 4-persons, 28 5-persons, 12 6-persons, 17 7-or-more-persons
Size of nonfamily households: 190 1-person, 83 2-persons, 2 3-persons
208 married couples with children.
22 single-parent households (22 women).
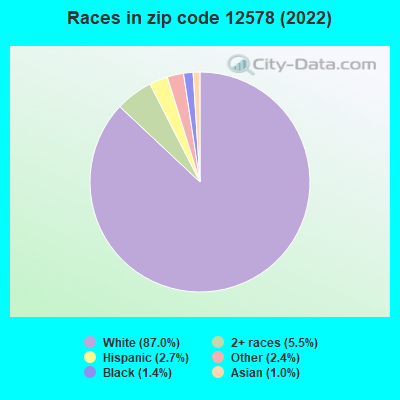
95.0% of residents of 12578 zip code speak English at home.
0.8% of residents speak Spanish at home (82% very well, 18% well).
2.8% of residents speak other Indo-European language at home (58% very well, 42% well).
1.4% of residents speak Asian or Pacific Island language at home (52% very well, 21% well, 28% not well).
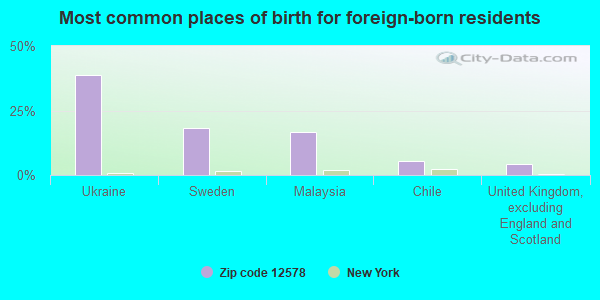
Foreign born population: 71 (3.4%) (49.2% of them are naturalized citizens)
This zip code:
3.4%
Whole state:
22.7%
39%Ukraine
18%Sweden
17%Malaysia
6%Chile
4%United Kingdom, excluding England and Scotland
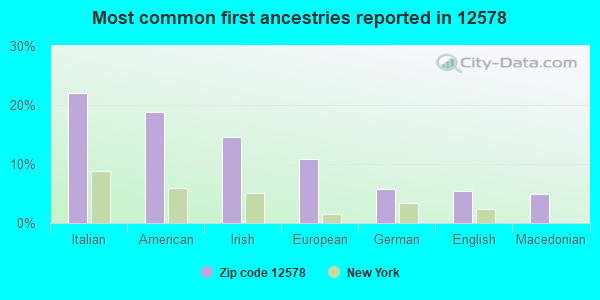
22%Italian
19%American
15%Irish
11%European
6%German
5%English
5%Macedonian
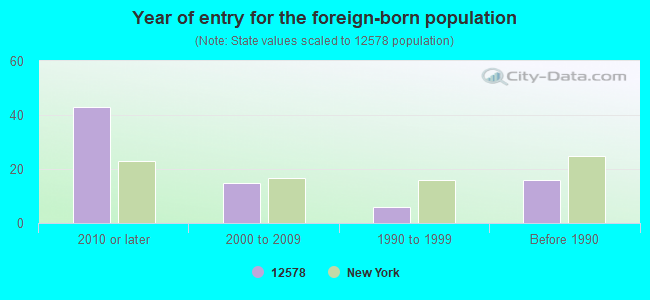
Year of entry for the foreign-born population
432010 or later
152000 to 2009
61990 to 1999
16Before 1990
Facilities with environmental interests located in this zip code:
CAVALIER GAGE & ELECTRONICS CO INC (HIBERNIA RD PO BOX 248 in SALT POINT, NY)
(Resource Conservation and Recovery Act (tracking hazardous waste))
Housing units lacking complete plumbing facilities: 4.5% Housing units lacking complete kitchen facilities: 4.5%
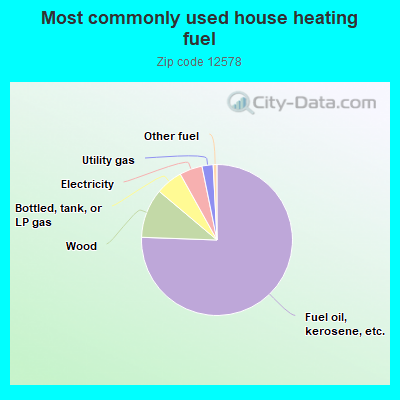
75.8%Fuel oil, kerosene, etc.
10.6%Wood
5.8%Bottled, tank, or LP gas
4.9%Electricity
2.4%Utility gas
0.8%Other fuel
Population in 1990: 1,521. Population change in the 1990s: +584 (+38.4%).
Place of birth for U.S.-born residents:
This state: 1,501
Northeast: 192
Midwest: 117
South: 138
West: 64
67% of the 12578 zip code residents lived in the same house 5 years ago. Out of people who lived in different houses, 56% lived in this county. Out of people who lived in different counties, 50% lived in New York.
92% of the 12578 zip code residents lived in the same house 1 year ago. Out of people who lived in different houses, 19% moved from this county. Out of people who lived in different houses, 66% moved from different county within same state. Out of people who lived in different houses, 14% moved from different state.
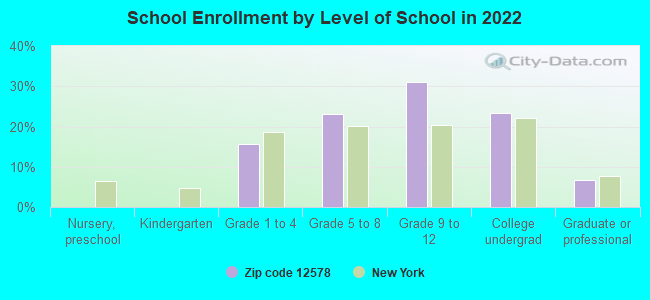
Private vs. public school enrollment:
Students in private schools in grades 1 to 8 (elementary and middle school): 38
Here:
27.1%
New York:
15.6%
Students in private schools in grades 9 to 12 (high school): 48
Here:
42.0%
New York:
15.0%
Students in private undergraduate colleges: 54
Here:
62.7%
New York:
39.2%
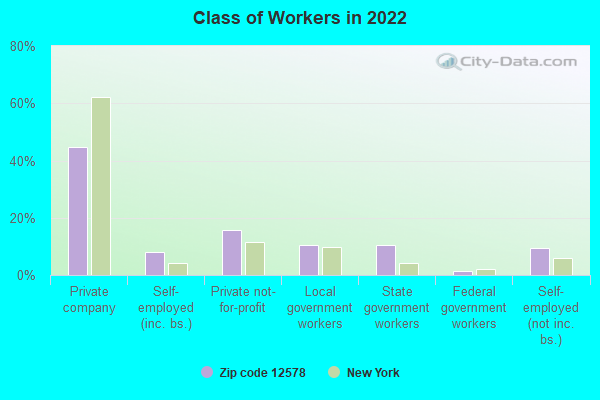
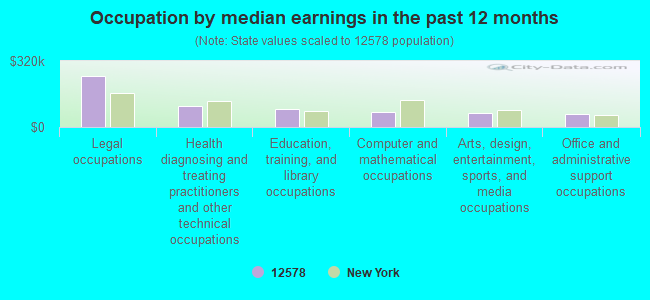
Occupation by median earnings in the past 12 months ($)
247,483Legal occupations
100,338Health diagnosing and treating practitioners and other technical occupations
88,670Education, training, and library occupations
74,328Computer and mathematical occupations
68,006Arts, design, entertainment, sports, and media occupations
62,876Office and administrative support occupations
Top industries in this zip code by the number of employees in 2005:
Health Care and Social Assistance: Residential Mental Retardation Facilities (20-49 employees: 2 establishments, 10-19 employees: 1 establishment, 5-9 employees: 1 establishment)
Administrative and Support and Waste Management and Remediation Services: Security Guards and Patrol Services (50-99: 1)
Other Services (except Public Administration): General Automotive Repair (20-49: 1, 1-4: 1)
Health Care and Social Assistance: Child Day Care Services (20-49: 1)
Accommodation and Food Services: Full-Service Restaurants (10-19: 1, 5-9: 1)
Professional, Scientific, and Technical Services: All Other Professional, Scientific, and Technical Services (10-19: 1, 1-4: 1)
Other Services (except Public Administration): Automotive Body, Paint, and Interior Repair and Maintenance (10-19: 1)
People in group quarters in 2010:
38 people in group homes intended for adults
10 people in residential treatment centers for adults
People in group quarters in 2000:
6 people in homes for the mentally retarded
4 people in other noninstitutional group quarters
Fatal accident statistics in 2013:
Fatal accident count: 1
Vehicles involved in fatal accidents: 1
Fatal accidents caused by drunken drivers: 1
Fatalities: 1
Persons involved in fatal accidents: 1
Pedestrians involved in fatal accidents: 0
Home Mortgage Disclosure Act Aggregated Statistics For Year 2009 (Based on 4 partial tracts)
A) FHA, FSA/RHS & VA Home Purchase Loans
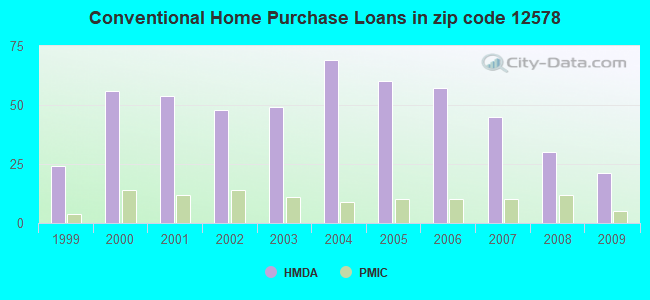
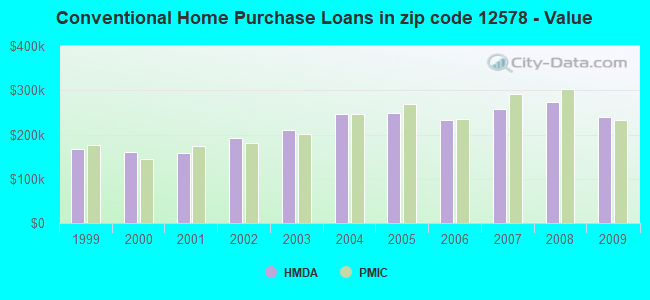
B) Conventional Home Purchase Loans
C) Refinancings
D) Home Improvement Loans
E) Loans on Dwellings For 5+ Families
F) Non-occupant Loans on < 5 Family Dwellings (A B C & D)
G) Loans On Manufactured Home Dwelling (A B C & D)
Number
Average Value
Number
Average Value
Number
Average Value
Number
Average Value
Number
Average Value
Number
Average Value
Number
Average Value
LOANS ORIGINATED
8
$231,104
21
$239,070
81
$211,502
12
$109,330
1
$1,460,340
4
$319,965
2
$57,645
APPLICATIONS APPROVED, NOT ACCEPTED
0
$0
2
$123,650
9
$257,820
1
$12,300
0
$0
1
$306,500
0
$0
APPLICATIONS DENIED
2
$158,715
5
$203,980
41
$259,849
8
$47,726
0
$0
2
$356,205
3
$68,917
APPLICATIONS WITHDRAWN
1
$253,110
5
$194,160
29
$269,184
4
$151,752
0
$0
1
$162,860
1
$34,590
FILES CLOSED FOR INCOMPLETENESS
0
$0
3
$197,433
4
$275,825
0
$0
0
$0
0
$0
0
$0
Aggregated Statistics For Year 2008 (Based on 4 partial tracts)
A) FHA, FSA/RHS & VA Home Purchase Loans
B) Conventional Home Purchase Loans
C) Refinancings
D) Home Improvement Loans
E) Loans on Dwellings For 5+ Families
F) Non-occupant Loans on < 5 Family Dwellings (A B C & D)
G) Loans On Manufactured Home Dwelling (A B C & D)
Number
Average Value
Number
Average Value
Number
Average Value
Number
Average Value
Number
Average Value
Number
Average Value
Number
Average Value
LOANS ORIGINATED
4
$329,828
30
$273,653
48
$245,197
9
$55,538
1
$3,304,980
8
$291,446
1
$17,680
APPLICATIONS APPROVED, NOT ACCEPTED
1
$232,560
3
$133,613
9
$167,812
1
$57,640
1
$922,320
0
$0
2
$51,880
APPLICATIONS DENIED
1
$394,780
9
$181,481
36
$263,369
16
$159,571
0
$0
3
$239,950
3
$52,263
APPLICATIONS WITHDRAWN
0
$0
7
$239,986
24
$249,220
4
$43,065
0
$0
2
$467,695
1
$53,800
FILES CLOSED FOR INCOMPLETENESS
0
$0
0
$0
7
$249,867
0
$0
0
$0
0
$0
1
$33,820
Aggregated Statistics For Year 2007 (Based on 4 partial tracts)
A) FHA, FSA/RHS & VA Home Purchase Loans
B) Conventional Home Purchase Loans
C) Refinancings
D) Home Improvement Loans
F) Non-occupant Loans on < 5 Family Dwellings (A B C & D)
G) Loans On Manufactured Home Dwelling (A B C & D)
Number
Average Value
Number
Average Value
Number
Average Value
Number
Average Value
Number
Average Value
Number
Average Value
LOANS ORIGINATED
0
$0
45
$256,508
82
$236,951
32
$92,320
8
$438,394
1
$27,670
APPLICATIONS APPROVED, NOT ACCEPTED
0
$0
5
$178,924
15
$243,506
2
$29,305
0
$0
1
$43,040
APPLICATIONS DENIED
0
$0
6
$212,337
62
$260,534
13
$74,065
2
$188,745
1
$58,750
APPLICATIONS WITHDRAWN
1
$158,330
4
$296,482
19
$241,822
5
$165,934
1
$391,510
0
$0
FILES CLOSED FOR INCOMPLETENESS
0
$0
4
$126,808
8
$256,012
0
$0
0
$0
0
$0
Aggregated Statistics For Year 2006 (Based on 4 partial tracts)
A) FHA, FSA/RHS & VA Home Purchase Loans
B) Conventional Home Purchase Loans
C) Refinancings
D) Home Improvement Loans
F) Non-occupant Loans on < 5 Family Dwellings (A B C & D)
G) Loans On Manufactured Home Dwelling (A B C & D)
Number
Average Value
Number
Average Value
Number
Average Value
Number
Average Value
Number
Average Value
Number
Average Value
LOANS ORIGINATED
0
$0
57
$232,195
95
$211,610
44
$56,304
7
$291,173
4
$75,708
APPLICATIONS APPROVED, NOT ACCEPTED
0
$0
7
$307,909
20
$219,409
2
$74,410
0
$0
2
$39,965
APPLICATIONS DENIED
0
$0
15
$228,811
58
$289,222
25
$65,876
2
$315,135
6
$58,558
APPLICATIONS WITHDRAWN
1
$222,130
12
$283,966
39
$213,117
13
$67,520
1
$89,930
2
$197,530
FILES CLOSED FOR INCOMPLETENESS
0
$0
5
$158,584
15
$256,545
0
$0
0
$0
1
$192,920
Aggregated Statistics For Year 2005 (Based on 4 partial tracts)
A) FHA, FSA/RHS & VA Home Purchase Loans
B) Conventional Home Purchase Loans
C) Refinancings
D) Home Improvement Loans
E) Loans on Dwellings For 5+ Families
F) Non-occupant Loans on < 5 Family Dwellings (A B C & D)
G) Loans On Manufactured Home Dwelling (A B C & D)
Number
Average Value
Number
Average Value
Number
Average Value
Number
Average Value
Number
Average Value
Number
Average Value
Number
Average Value
LOANS ORIGINATED
0
$0
60
$249,565
104
$231,532
34
$73,932
1
$7,301,700
5
$391,698
3
$35,867
APPLICATIONS APPROVED, NOT ACCEPTED
0
$0
9
$191,184
14
$243,466
2
$197,800
0
$0
1
$311,290
2
$28,055
APPLICATIONS DENIED
1
$261,320
5
$150,014
51
$246,966
10
$159,193
0
$0
1
$249,810
2
$18,060
APPLICATIONS WITHDRAWN
0
$0
12
$222,102
46
$228,239
18
$105,356
0
$0
1
$244,080
0
$0
FILES CLOSED FOR INCOMPLETENESS
0
$0
4
$164,495
19
$248,698
0
$0
0
$0
1
$153,720
2
$21,135
Aggregated Statistics For Year 2004 (Based on 4 partial tracts)
A) FHA, FSA/RHS & VA Home Purchase Loans
B) Conventional Home Purchase Loans
C) Refinancings
D) Home Improvement Loans
F) Non-occupant Loans on < 5 Family Dwellings (A B C & D)
G) Loans On Manufactured Home Dwelling (A B C & D)
Number
Average Value
Number
Average Value
Number
Average Value
Number
Average Value
Number
Average Value
Number
Average Value
LOANS ORIGINATED
0
$0
69
$245,784
115
$197,616
31
$60,079
13
$329,042
2
$45,610
APPLICATIONS APPROVED, NOT ACCEPTED
0
$0
9
$250,359
20
$208,825
9
$47,013
2
$368,970
1
$23,060
APPLICATIONS DENIED
0
$0
13
$195,062
53
$213,709
20
$75,254
2
$303,130
7
$37,614
APPLICATIONS WITHDRAWN
1
$213,870
8
$346,568
45
$195,612
15
$84,723
1
$691,740
3
$60,687
FILES CLOSED FOR INCOMPLETENESS
0
$0
2
$408,560
30
$225,912
1
$61,490
0
$0
0
$0
Aggregated Statistics For Year 2003 (Based on 4 partial tracts)
A) FHA, FSA/RHS & VA Home Purchase Loans
B) Conventional Home Purchase Loans
C) Refinancings
D) Home Improvement Loans
F) Non-occupant Loans on < 5 Family Dwellings (A B C & D)
Number
Average Value
Number
Average Value
Number
Average Value
Number
Average Value
Number
Average Value
LOANS ORIGINATED
0
$0
49
$210,219
236
$161,060
17
$39,764
13
$233,458
APPLICATIONS APPROVED, NOT ACCEPTED
1
$205,800
5
$236,514
31
$247,882
5
$50,008
3
$1,066,243
APPLICATIONS DENIED
1
$142,190
13
$154,171
71
$174,167
12
$29,392
1
$269,020
APPLICATIONS WITHDRAWN
0
$0
8
$188,886
52
$177,511
6
$44,387
3
$167,637
FILES CLOSED FOR INCOMPLETENESS
0
$0
2
$158,045
8
$162,332
2
$33,820
0
$0
Aggregated Statistics For Year 2002 (Based on 4 partial tracts)
A) FHA, FSA/RHS & VA Home Purchase Loans
B) Conventional Home Purchase Loans
C) Refinancings
D) Home Improvement Loans
F) Non-occupant Loans on < 5 Family Dwellings (A B C & D)
Number
Average Value
Number
Average Value
Number
Average Value
Number
Average Value
Number
Average Value
LOANS ORIGINATED
1
$167,320
48
$191,767
139
$137,541
13
$41,184
9
$173,408
APPLICATIONS APPROVED, NOT ACCEPTED
0
$0
3
$191,083
17
$141,548
2
$39,150
2
$203,205
APPLICATIONS DENIED
0
$0
6
$120,897
43
$117,125
12
$26,449
0
$0
APPLICATIONS WITHDRAWN
0
$0
5
$168,836
30
$158,252
7
$35,610
1
$327,150
FILES CLOSED FOR INCOMPLETENESS
1
$87,620
1
$225,300
9
$201,358
1
$28,820
1
$107,600
Aggregated Statistics For Year 2001 (Based on 4 partial tracts)
A) FHA, FSA/RHS & VA Home Purchase Loans
B) Conventional Home Purchase Loans
C) Refinancings
D) Home Improvement Loans
E) Loans on Dwellings For 5+ Families
F) Non-occupant Loans on < 5 Family Dwellings (A B C & D)
Number
Average Value
Number
Average Value
Number
Average Value
Number
Average Value
Number
Average Value
Number
Average Value
LOANS ORIGINATED
5
$148,830
54
$158,107
101
$142,712
13
$29,329
1
$74,550
4
$217,665
APPLICATIONS APPROVED, NOT ACCEPTED
1
$80,700
6
$128,502
15
$142,135
2
$33,265
0
$0
2
$134,030
APPLICATIONS DENIED
0
$0
8
$80,921
42
$82,867
10
$26,723
0
$0
1
$134,750
APPLICATIONS WITHDRAWN
0
$0
8
$158,201
34
$122,833
4
$20,092
0
$0
2
$177,160
FILES CLOSED FOR INCOMPLETENESS
0
$0
1
$37,660
5
$145,508
0
$0
0
$0
0
$0
Aggregated Statistics For Year 2000 (Based on 4 partial tracts)
A) FHA, FSA/RHS & VA Home Purchase Loans
B) Conventional Home Purchase Loans
C) Refinancings
D) Home Improvement Loans
E) Loans on Dwellings For 5+ Families
F) Non-occupant Loans on < 5 Family Dwellings (A B C & D)
Number
Average Value
Number
Average Value
Number
Average Value
Number
Average Value
Number
Average Value
Number
Average Value
LOANS ORIGINATED
6
$132,728
56
$161,291
45
$93,226
11
$27,168
2
$69,175
4
$296,975
APPLICATIONS APPROVED, NOT ACCEPTED
0
$0
8
$128,239
12
$81,164
3
$21,617
0
$0
0
$0
APPLICATIONS DENIED
2
$90,695
21
$105,473
23
$75,096
12
$18,174
0
$0
0
$0
APPLICATIONS WITHDRAWN
0
$0
7
$143,169
25
$79,155
2
$72,300
0
$0
0
$0
FILES CLOSED FOR INCOMPLETENESS
1
$125,280
0
$0
9
$86,340
1
$49,960
0
$0
1
$57,640
Aggregated Statistics For Year 1999 (Based on 2 partial tracts)
A) FHA, FSA/RHS & VA Home Purchase Loans
B) Conventional Home Purchase Loans
C) Refinancings
D) Home Improvement Loans
F) Non-occupant Loans on < 5 Family Dwellings (A B C & D)


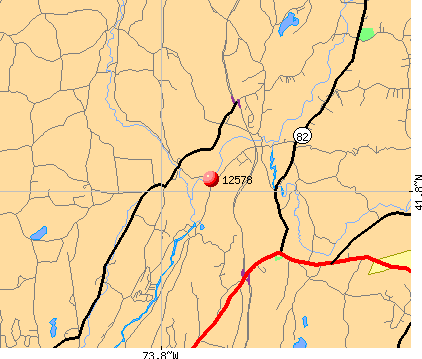 Nearest zip codes: 12569, 12514, 12580, 12538, 12545, 12581.