Estimated zip code population in 2022: 1,116 Zip code population in 2010: 1,574 Zip code population in 2000: 1,552
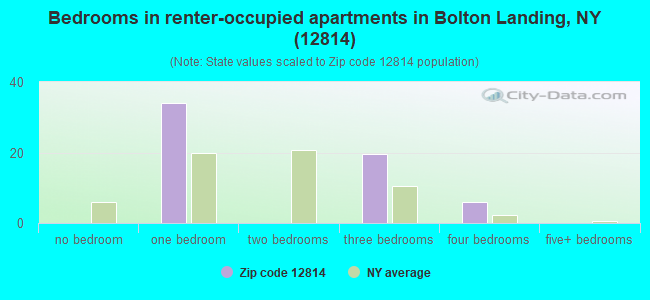
Houses and condos: 1,815 Renter-occupied apartments: 59
% of renters here:
9%
State:
46%
March 2022 cost of living index in zip code 12814: 95.2 (less than average, U.S. average is 100)
Land area: 45.5 sq. mi. Water area: 0.3 sq. mi.
Population density: 25 people per square mile
(very low).
OSM Map
General Map
Google Map
MSN Map
OSM Map
General Map
Google Map
MSN Map
OSM Map
General Map
Google Map
MSN Map
OSM Map
General Map
Google Map
MSN Map
Please wait while loading the map...
Real estate property taxes paid for housing units in 2022:
This zip code:
0.9% ($2,337)
New York:
1.5% ($6,180)
Median real estate property taxes paid for housing units with mortgages in 2022: $2,349 (1.0%) Median real estate property taxes paid for housing units with no mortgage in 2022: $2,323 (0.8%)
Business Search- 14 Million verified businesses
Males: 682
(61.1%)
Females: 434
(38.9%)
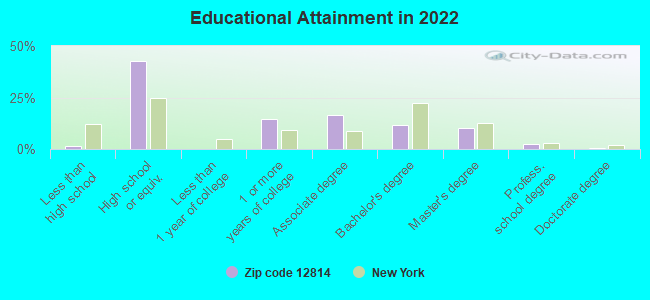
For population 25 years and over in 12814:
High school or higher: 97.3%
Bachelor's degree or higher: 24.5%
Graduate or professional degree: 12.8%
Unemployed: 1.7%
Mean travel time to work (commute): 22.2 minutes
For population 15 years and over in 12814:
Never married: 12.7%
Now married: 58.2%
Separated: 13.4%
Widowed: 8.1%
Divorced: 7.6%
Zip code 12814 compared to state average:
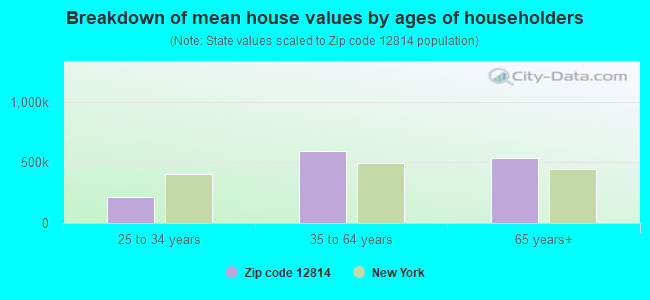
Median house value below state average.
Unemployed percentage significantly below state average.
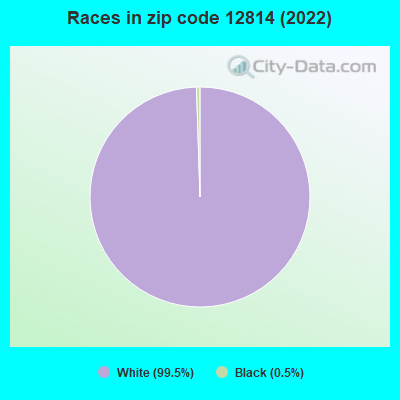
Black race population percentage significantly below state average.
Hispanic race population percentage significantly below state average.
Median age significantly above state average.
Foreign-born population percentage significantly below state average.
Renting percentage significantly below state average.
Length of stay since moving in below state average.
Number of rooms per house above state average.
Number of college students significantly below state average.
Estimated median house/condo value in 2022: $249,142
12814:
$249,142
New York:
$400,400
Median resident age:
This zip code:
60.7 years
New York median age:
40.0 years
Average household size:
This zip code:
1.7 people
New York:
2.5 people
Averages for the 2020 tax year for zip code 12814, filed in 2021:
Average Adjusted Gross Income (AGI) in 2020: $103,360 (Individual Income Tax Returns)
Here:
$103,360
State:
$90,930
Salary/wage: $58,945 (reported on 75.6% of returns)
Here:
$58,945
State:
$72,104
(% of AGI for various income ranges: 1144.4% for AGIs below $25k, 3560.7% for AGIs $25k-50k, 6080.0% for AGIs $50k-75k, 6625.0% for AGIs $75k-100k, 11090.0% for AGIs $100k-200k)
Taxable interest for individuals: $1,265 (reported on 46.5% of returns)
This zip code:
$1,265
New York:
$3,075
(% of AGI for various income ranges: 16.7% for AGIs below $25k, 16.4% for AGIs $25k-50k, 77.1% for AGIs $50k-75k, 267.5% for AGIs $75k-100k, 172.5% for AGIs $100k-200k)
Ordinary dividends: $16,050 (reported on 34.9% of returns)
Here:
$16,050
State:
$11,095
(% of AGI for various income ranges: 54.4% for AGIs below $25k, 117.9% for AGIs $25k-50k, 218.6% for AGIs $50k-75k, 702.5% for AGIs $75k-100k, 650.0% for AGIs $100k-200k)
Net capital gain/loss in AGI: +$51,862 (reported on 30.2% of returns)
Here:
+$51,862
State:
+$44,925
(% of AGI for various income ranges: 3.3% for AGIs below $25k, 67.9% for AGIs $25k-50k, 325.7% for AGIs $50k-75k, 852.5% for AGIs $75k-100k, 1085.0% for AGIs $100k-200k)
Profit/loss from business: +$24,656 (reported on 18.6% of returns)
Here:
+$24,656
State:
+$14,940
(% of AGI for various income ranges: 41.1% for AGIs below $25k, 302.1% for AGIs $25k-50k, 877.1% for AGIs $50k-75k, 1067.5% for AGIs $100k-200k)
Taxable individual retirement arrangement distribution: $31,383 (reported on 14.0% of returns)
12814:
$31,383
New York:
$19,609
(% of AGI for various income ranges: 112.8% for AGIs below $25k, 324.3% for AGIs $50k-75k, 912.5% for AGIs $75k-100k, 1458.8% for AGIs $100k-200k)
Total itemized deductions: $38,612 (reported on 9.3% of returns)
Here:
$38,612
State:
$39,326
(% of AGI for various income ranges: 370.7% for AGIs $25k-50k, 1005.0% for AGIs $100k-200k)
Charity contributions: $13,700 (reported on 8.1% of returns)
Here:
$13,700
State:
$15,420
(% of AGI for various income ranges: 185.0% for AGIs $100k-200k)
Taxes paid: $8,575 (reported on 9.3% of returns)
12814:
$8,575
State:
$9,183
(% of AGI for various income ranges: 114.3% for AGIs $25k-50k, 295.0% for AGIs $100k-200k)
Earned income credit: $1,271 (reported on 8.1% of returns)
Here:
$1,271
State:
$2,138
(% of AGI for various income ranges: 22.2% for AGIs below $25k, 35.0% for AGIs $25k-50k)
Percentage of individuals using paid preparers for their 2020 taxes: 94.2%
Here:
94%
State:
95%
(% for various income ranges: 92.0% for AGIs below $25k, 94.7% for AGIs $25k-50k, 91.7% for AGIs $50k-75k, 100.0% for AGIs $75k-100k, 92.9% for AGIs $100k-200k, 100.0% for AGIs over 200k)
Averages for the 2012 tax year for zip code 12814, filed in 2013:
Average Adjusted Gross Income (AGI) in 2012: $57,006 (Individual Income Tax Returns)
Here:
$57,006
State:
$77,088
Salary/wage: $36,558 (reported on 74.4% of returns)
Here:
$36,558
State:
$60,593
(% of AGI for various income ranges: 70.7% for AGIs below $25k, 64.2% for AGIs $25k-50k, 55.3% for AGIs $50k-75k, 42.3% for AGIs $75k-100k, 38.8% for AGIs $100k-200k, 40.7% for AGIs over 200k)
Taxable interest for individuals: $2,088 (reported on 46.7% of returns)
This zip code:
$2,088
New York:
$3,125
(% of AGI for various income ranges: 0.8% for AGIs below $25k, 1.9% for AGIs $25k-50k, 1.7% for AGIs $50k-75k, 2.9% for AGIs $75k-100k, 1.5% for AGIs $100k-200k, 1.5% for AGIs over 200k)
Ordinary dividends: $7,848 (reported on 32.2% of returns)
Here:
$7,848
State:
$10,299
(% of AGI for various income ranges: 3.8% for AGIs below $25k, 3.8% for AGIs $25k-50k, 2.9% for AGIs $50k-75k, 3.6% for AGIs $75k-100k, 5.4% for AGIs $100k-200k, 5.0% for AGIs over 200k)
Net capital gain/loss in AGI: +$14,075 (reported on 26.7% of returns)
Here:
+$14,075
State:
+$42,474
(% of AGI for various income ranges: 1.4% for AGIs $75k-100k, 3.6% for AGIs $100k-200k, 22.5% for AGIs over 200k)
Profit/loss from business: +$16,543 (reported on 15.6% of returns)
Here:
+$16,543
State:
+$16,168
(% of AGI for various income ranges: 3.8% for AGIs below $25k, 5.4% for AGIs $25k-50k, 17.2% for AGIs $50k-75k, 5.4% for AGIs $100k-200k)
Taxable individual retirement arrangement distribution: $20,150 (reported on 15.6% of returns)
12814:
$20,150
New York:
$17,621
(% of AGI for various income ranges: 2.0% for AGIs below $25k, 4.1% for AGIs $25k-50k, 3.8% for AGIs $50k-75k, 7.7% for AGIs $75k-100k, 11.5% for AGIs $100k-200k)
Total itemized deductions: $27,439 (24% of AGI, reported on 31.1% of returns)
Here:
$27,439
State:
$34,985
Here:
23.9% of AGI
State:
21.3% of AGI
(% of AGI for various income ranges: 9.6% for AGIs below $25k, 11.7% for AGIs $25k-50k, 12.3% for AGIs $50k-75k, 14.1% for AGIs $75k-100k, 18.9% for AGIs $100k-200k, 16.0% for AGIs over 200k)
Charity contributions: $3,104 (reported on 25.6% of returns)
Here:
$3,104
State:
$5,572
(% of AGI for various income ranges: 0.5% for AGIs below $25k, 0.7% for AGIs $25k-50k, 1.6% for AGIs $50k-75k, 1.3% for AGIs $75k-100k, 1.9% for AGIs $100k-200k, 1.5% for AGIs over 200k)
Taxes paid: $12,411 (reported on 31.1% of returns)
12814:
$12,411
State:
$18,656
(% of AGI for various income ranges: 2.8% for AGIs below $25k, 4.1% for AGIs $25k-50k, 4.5% for AGIs $50k-75k, 6.2% for AGIs $75k-100k, 9.0% for AGIs $100k-200k, 8.5% for AGIs over 200k)
Earned income credit: $1,242 (reported on 13.3% of returns)
Here:
$1,242
State:
$2,230
(% of AGI for various income ranges: 3.2% for AGIs below $25k)
Percentage of individuals using paid preparers for their 2012 taxes: 53.3%
Here:
53%
State:
66%
(% for various income ranges: 43.6% for AGIs below $25k, 50.0% for AGIs $25k-50k, 60.0% for AGIs $50k-75k, 55.6% for AGIs $75k-100k, 72.7% for AGIs $100k-200k, 100.0% for AGIs over 200k)
Averages for the 2004 tax year for zip code 12814, filed in 2005:
Average Adjusted Gross Income (AGI) in 2004: $46,113 (Individual Income Tax Returns)
Here:
$46,113
State:
$59,519
Salary/wage: $33,458 (reported on 78.5% of returns)
Here:
$33,458
State:
$50,673
(% of AGI for various income ranges: 123.9% for AGIs below $10k, 70.4% for AGIs $10k-25k, 68.5% for AGIs $25k-50k, 64.1% for AGIs $50k-75k, 56.7% for AGIs $75k-100k, 43.4% for AGIs over 100k)
Taxable interest for individuals: $2,492 (reported on 52.7% of returns)
This zip code:
$2,492
New York:
$2,377
(% of AGI for various income ranges: 9.2% for AGIs below $10k, 4.3% for AGIs $10k-25k, 2.5% for AGIs $25k-50k, 2.0% for AGIs $50k-75k, 3.5% for AGIs $75k-100k, 2.6% for AGIs over 100k)
Taxable dividends: $5,775 (reported on 33.8% of returns)
Here:
$5,775
State:
$5,394
(% of AGI for various income ranges: 6.4% for AGIs below $10k, 2.5% for AGIs $10k-25k, 2.4% for AGIs $25k-50k, 2.2% for AGIs $50k-75k, 4.4% for AGIs $75k-100k, 6.2% for AGIs over 100k)
Net capital gain/loss: +$12,261 (reported on 28.4% of returns)
Here:
+$12,261
State:
+$23,581
(% of AGI for various income ranges: -2.7% for AGIs below $10k, -1.1% for AGIs $10k-25k, 1.1% for AGIs $25k-50k, 1.8% for AGIs $50k-75k, 4.0% for AGIs $75k-100k, 16.5% for AGIs over 100k)
Profit/loss from business: +$11,367 (reported on 16.3% of returns)
Here:
+$11,367
State:
+$13,809
(% of AGI for various income ranges: 7.3% for AGIs below $10k, 5.6% for AGIs $10k-25k, 8.9% for AGIs $25k-50k, 6.7% for AGIs $50k-75k, 1.5% for AGIs over 100k)
IRA payment deduction: $3,433 (reported on 3.3% of returns)
12814:
$3,433
New York:
$3,115
Total itemized deductions: $21,442 (23% of AGI, reported on 29.8% of returns)
Here:
$21,442
State:
$25,864
Here:
22.8% of AGI
State:
21.9% of AGI
(% of AGI for various income ranges: 15.2% for AGIs $10k-25k, 12.5% for AGIs $25k-50k, 10.5% for AGIs $50k-75k, 15.2% for AGIs $75k-100k, 15.4% for AGIs over 100k)
Charity contributions deductions: $2,765 (3% of AGI, reported on 26.3% of returns)
Here:
$2,765
State:
$4,439
Here:
2.8% of AGI
State:
3.6% of AGI
(% of AGI for various income ranges: 0.7% for AGIs $10k-25k, 1.2% for AGIs $25k-50k, 1.2% for AGIs $50k-75k, 2.2% for AGIs $75k-100k, 2.0% for AGIs over 100k)
Total tax: $7,030 (reported on 76.3% of returns)
12814:
$7,030
State:
$11,730
(% of AGI for various income ranges: 3.7% for AGIs below $10k, 4.3% for AGIs $10k-25k, 7.9% for AGIs $25k-50k, 10.1% for AGIs $50k-75k, 11.2% for AGIs $75k-100k, 16.2% for AGIs over 100k)
Earned income credit: $1,481 (reported on 11.9% of returns)
Here:
$1,481
State:
$1,757
Percentage of individuals using paid preparers for their 2004 taxes: 60.3%
Here:
60%
State:
67%
(% for various income ranges: 50.0% for AGIs below $10k, 54.2% for AGIs $10k-25k, 63.4% for AGIs $25k-50k, 61.8% for AGIs $50k-75k, 69.7% for AGIs $75k-100k, 81.6% for AGIs over 100k)
Household received Food Stamps/SNAP in the past 12 months: 34 Household did not receive Food Stamps/SNAP in the past 12 months: 606
Women who had a birth in the past 12 months: 9 (9 now married, 0 unmarried) Women who did not have a birth in the past 12 months: 90 (41 now married, 48 unmarried)
Housing units in zip code 12814 with a mortgage: 292 (27 second mortgage, 27 both second mortgage and home equity loan) Median monthly owner costs for units with a mortgage: $1,770 Median monthly owner costs for units without a mortgage: $538
Residents with income below the poverty level in 2022:
This zip code:
7.0%
Whole state:
14.3%
Residents with income below 50% of the poverty level in 2022:
This zip code:
7.0%
Whole state:
6.8%
Median number of rooms in houses and condos:
Here:
6.9
State:
6.3
Median number of rooms in apartments:
Here:
3.4
State:
3.8
Notable locations in this zip code not listed on our city pages
Notable locations in zip code 12814: The Sagamore Resort and Golf Club (A), Bolton Free Library (B), Bolton Historical Museum (C), Bolton Landing Volunteer Fire Company (D), Bolton Landing Volunteer Fire Company Station 2 (E). Display/hide their locations on the map
Size of family households: 232 2-persons, 43 3-persons, 3 4-persons, 17 5-persons, 5 6-persons
Size of nonfamily households: 173 1-person, 189 2-persons
47 married couples with children.
35 single-parent households (35 women).
101.1% of residents of 12814 zip code speak English at home.
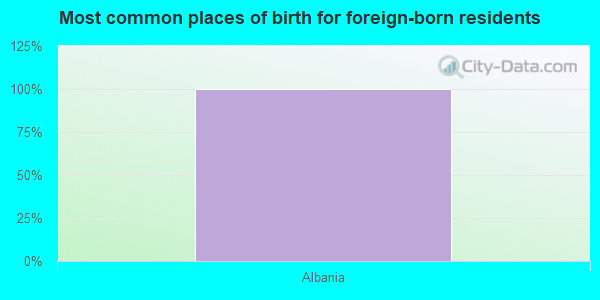
Foreign born population: 17 (1.5%) (100.0% of them are naturalized citizens)
This zip code:
1.5%
Whole state:
22.7%
100%Albania
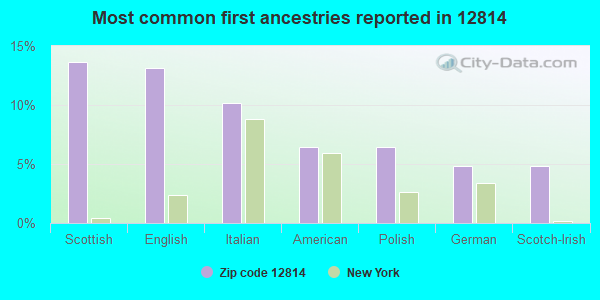
14%Scottish
13%English
10%Italian
6%American
6%Polish
5%German
5%Scotch-Irish
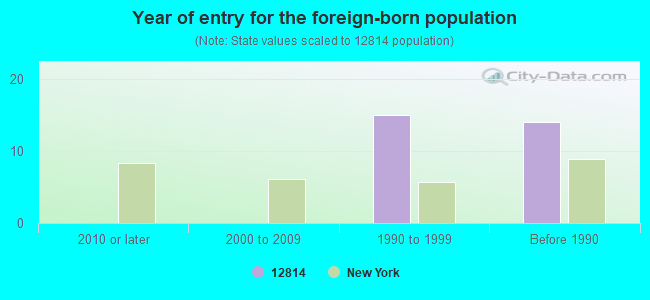
Year of entry for the foreign-born population
02010 or later
02000 to 2009
151990 to 1999
14Before 1990
Facilities with environmental interests located in this zip code:
BOLTON CENTRAL SCHOOL (26 HORICON AVE in BOLTON LANDING, NY)
STATE MASTER (New York facility tracking) - AIR PROGRAM Small Quantity Generators, between 100 kg and 1000 kg of hazardous waste/month (Resource Conservation and Recovery Act (tracking hazardous waste)) - notification Business SIC and NAICS classification: COLLEGES, UNIVERSITIES, AND PROFESSIONAL SCHOOLS Organizations: BOLTON CENTRAL SCHOOL DIST (CONTACT/OWNER)
, BOLTON CTL SCH DIST (LEGALLY RESPONSIBLE PARTY)
Alternative names: BOLTON CENTRAL SCHOOL DIST
BOLTON CENTRAL SCHOOL ( in BOLTON LANDING, NY)
(National Center for Education Statistics) - STATE ID-630101040001 Organizations: BOLTON CSD (SCHOOL DISTRICT)
BOLTON (T) WWTP (PO BOX 698, LAKESHORE DR in BOLTON LANDING, NY)
National Pollutant Discharge Elimination System NON-MAJOR (Tracking pollutant discharge elimination systems) - permit Business SIC classification: SEWERAGE SYSTEMS
Housing units lacking complete plumbing facilities: 0.9% Housing units lacking complete kitchen facilities: 1.1%
56.2%Fuel oil, kerosene, etc.
27.5%Bottled, tank, or LP gas
9.2%Electricity
4.3%Wood
1.3%Utility gas
1.1%Solar energy
0.9%Other fuel
Population in 1990: 1,298. Population change in the 1990s: +254 (+19.6%).
Place of birth for U.S.-born residents:
This state: 617
Northeast: 190
Midwest: 242
South: 39
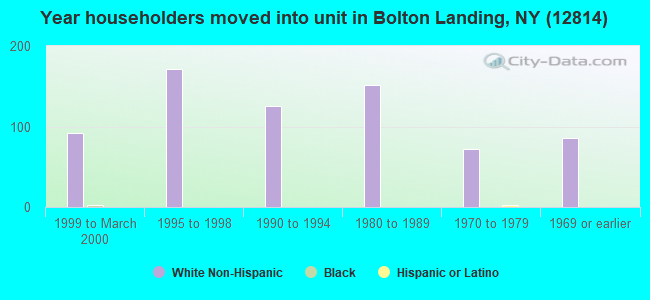
66% of the 12814 zip code residents lived in the same house 5 years ago. Out of people who lived in different houses, 56% lived in this county. Out of people who lived in different counties, 50% lived in New York.
93% of the 12814 zip code residents lived in the same house 1 year ago. Out of people who lived in different houses, 53% moved from this county. Out of people who lived in different houses, 8% moved from different county within same state. Out of people who lived in different houses, 39% moved from different state.
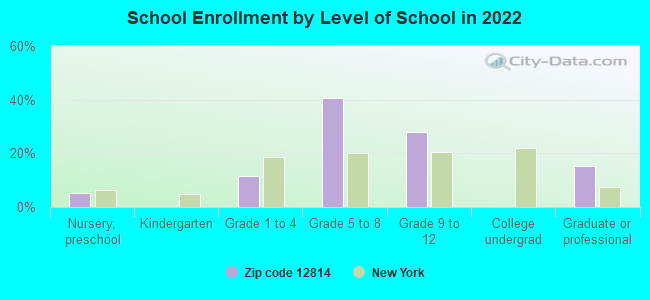
Private vs. public school enrollment:
Students in private schools in grades 1 to 8 (elementary and middle school): 8
Here:
20.7%
New York:
15.6%
Students in private schools in grades 9 to 12 (high school): 22
Here:
100.0%
New York:
15.0%
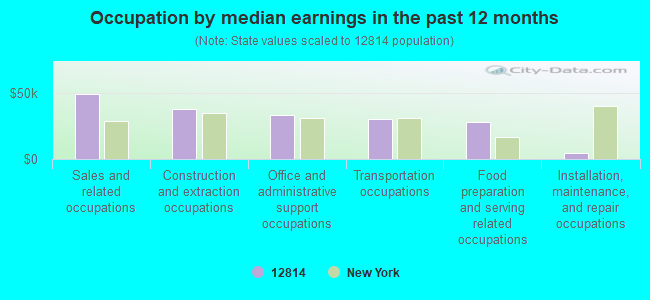
Occupation by median earnings in the past 12 months ($)
49,187Sales and related occupations
37,509Construction and extraction occupations
33,131Office and administrative support occupations
29,778Transportation occupations
27,491Food preparation and serving related occupations
4,374Installation, maintenance, and repair occupations
Top industries in this zip code by the number of employees in 2005:
Accommodation and Food Services: Hotels (except Casino Hotels) and Motels (250-499 employees: 1 establishment, 1-4 employees: 5 establishments)
Administrative and Support and Waste Management and Remediation Services: Office Administrative Services (20-49: 1)
Wholesale Trade: Plumbing and Heating Equipment and Supplies (Hydronics) Merchant Wholesalers (20-49: 1)
Accommodation and Food Services: Full-Service Restaurants (10-19: 1, 1-4: 8)
Construction: New Single-Family Housing Construction (except Operative Builders) (10-19: 1, 1-4: 4)
Arts, Entertainment, and Recreation: Marinas (5-9: 2, 1-4: 2)
Other Services (except Public Administration): Religious Organizations (1-4: 4)
Fatal accident statistics in 2014:
Fatal accident count: 1
Vehicles involved in fatal accidents: 2
Fatal accidents caused by drunken drivers: 0
Fatalities: 1
Persons involved in fatal accidents: 2
Pedestrians involved in fatal accidents: 0
Fatal accident statistics in 2012:
Fatal accident count: 1
Vehicles involved in fatal accidents: 1
Fatal accidents caused by drunken drivers: 1
Fatalities: 1
Persons involved in fatal accidents: 1
Pedestrians involved in fatal accidents: 0
Home Mortgage Disclosure Act Aggregated Statistics For Year 2009 (Based on 4 partial tracts)
A) FHA, FSA/RHS & VA Home Purchase Loans
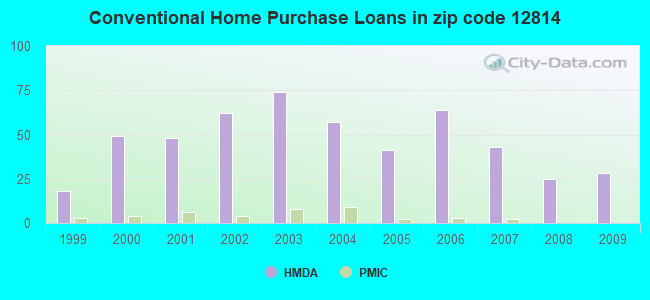
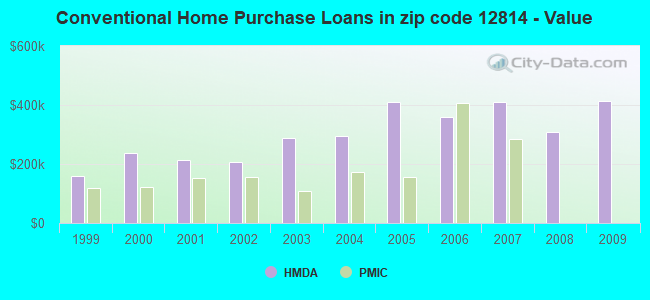
B) Conventional Home Purchase Loans
C) Refinancings
D) Home Improvement Loans
F) Non-occupant Loans on < 5 Family Dwellings (A B C & D)
Number
Average Value
Number
Average Value
Number
Average Value
Number
Average Value
Number
Average Value
LOANS ORIGINATED
0
$0
28
$413,230
70
$227,557
10
$102,290
48
$383,190
APPLICATIONS APPROVED, NOT ACCEPTED
0
$0
1
$1,239,370
15
$299,841
2
$78,510
9
$342,836
APPLICATIONS DENIED
0
$0
3
$308,067
39
$306,254
10
$64,604
24
$299,935
APPLICATIONS WITHDRAWN
0
$0
4
$811,758
20
$410,113
3
$112,907
11
$438,545
FILES CLOSED FOR INCOMPLETENESS
1
$209,740
0
$0
0
$0
0
$0
0
$0
Aggregated Statistics For Year 2008 (Based on 4 partial tracts)
A) FHA, FSA/RHS & VA Home Purchase Loans
B) Conventional Home Purchase Loans
C) Refinancings
D) Home Improvement Loans
F) Non-occupant Loans on < 5 Family Dwellings (A B C & D)
G) Loans On Manufactured Home Dwelling (A B C & D)
Number
Average Value
Number
Average Value
Number
Average Value
Number
Average Value
Number
Average Value
Number
Average Value
LOANS ORIGINATED
1
$102,070
25
$308,664
47
$209,214
12
$69,259
28
$317,132
1
$319,660
APPLICATIONS APPROVED, NOT ACCEPTED
1
$127,860
11
$277,749
11
$266,941
0
$0
7
$324,143
0
$0
APPLICATIONS DENIED
1
$128,980
7
$454,249
34
$275,386
17
$36,683
13
$402,655
1
$131,230
APPLICATIONS WITHDRAWN
0
$0
6
$352,370
17
$144,092
0
$0
4
$424,805
0
$0
FILES CLOSED FOR INCOMPLETENESS
0
$0
2
$237,780
4
$455,930
0
$0
2
$234,975
0
$0
Aggregated Statistics For Year 2007 (Based on 4 partial tracts)
B) Conventional Home Purchase Loans
C) Refinancings
D) Home Improvement Loans
F) Non-occupant Loans on < 5 Family Dwellings (A B C & D)
Number
Average Value
Number
Average Value
Number
Average Value
Number
Average Value
LOANS ORIGINATED
43
$410,506
74
$290,767
8
$84,120
53
$445,021
APPLICATIONS APPROVED, NOT ACCEPTED
7
$260,211
20
$417,628
3
$19,813
13
$533,968
APPLICATIONS DENIED
10
$453,687
54
$313,238
6
$188,055
20
$409,272
APPLICATIONS WITHDRAWN
8
$334,378
17
$199,909
3
$41,127
8
$309,281
FILES CLOSED FOR INCOMPLETENESS
2
$352,745
6
$290,120
2
$58,885
2
$286,010
Aggregated Statistics For Year 2006 (Based on 4 partial tracts)
A) FHA, FSA/RHS & VA Home Purchase Loans
B) Conventional Home Purchase Loans
C) Refinancings
D) Home Improvement Loans
F) Non-occupant Loans on < 5 Family Dwellings (A B C & D)
G) Loans On Manufactured Home Dwelling (A B C & D)
Number
Average Value
Number
Average Value
Number
Average Value
Number
Average Value
Number
Average Value
Number
Average Value
LOANS ORIGINATED
2
$185,065
64
$357,966
70
$277,532
19
$98,642
66
$324,295
0
$0
APPLICATIONS APPROVED, NOT ACCEPTED
0
$0
4
$278,158
16
$424,105
4
$162,352
4
$652,490
0
$0
APPLICATIONS DENIED
0
$0
11
$278,055
36
$184,971
12
$53,557
13
$298,001
1
$16,820
APPLICATIONS WITHDRAWN
0
$0
6
$283,952
19
$233,116
1
$134,590
4
$450,322
0
$0
FILES CLOSED FOR INCOMPLETENESS
0
$0
2
$280,400
4
$430,415
1
$84,120
2
$308,440
0
$0
Aggregated Statistics For Year 2005 (Based on 4 partial tracts)
A) FHA, FSA/RHS & VA Home Purchase Loans
B) Conventional Home Purchase Loans
C) Refinancings
D) Home Improvement Loans
F) Non-occupant Loans on < 5 Family Dwellings (A B C & D)
G) Loans On Manufactured Home Dwelling (A B C & D)
Number
Average Value
Number
Average Value
Number
Average Value
Number
Average Value
Number
Average Value
Number
Average Value
LOANS ORIGINATED
0
$0
41
$409,247
70
$239,205
18
$98,078
47
$424,752
0
$0
APPLICATIONS APPROVED, NOT ACCEPTED
1
$196,280
4
$243,668
13
$205,166
3
$123,377
2
$286,010
0
$0
APPLICATIONS DENIED
0
$0
7
$450,243
34
$228,114
17
$83,526
12
$410,412
1
$112,160
APPLICATIONS WITHDRAWN
0
$0
4
$211,140
37
$198,099
6
$118,703
6
$187,868
0
$0
FILES CLOSED FOR INCOMPLETENESS
0
$0
0
$0
13
$177,903
0
$0
1
$306,200
0
$0
Aggregated Statistics For Year 2004 (Based on 4 partial tracts)
B) Conventional Home Purchase Loans
C) Refinancings
D) Home Improvement Loans
E) Loans on Dwellings For 5+ Families
F) Non-occupant Loans on < 5 Family Dwellings (A B C & D)
G) Loans On Manufactured Home Dwelling (A B C & D)
Number
Average Value
Number
Average Value
Number
Average Value
Number
Average Value
Number
Average Value
Number
Average Value
LOANS ORIGINATED
57
$295,925
94
$214,548
13
$85,845
0
$0
59
$304,961
0
$0
APPLICATIONS APPROVED, NOT ACCEPTED
7
$199,324
18
$216,593
6
$93,467
0
$0
9
$353,429
1
$54,960
APPLICATIONS DENIED
6
$251,425
33
$216,469
7
$47,909
0
$0
13
$372,630
1
$54,960
APPLICATIONS WITHDRAWN
10
$155,678
28
$144,847
4
$167,680
1
$379,100
7
$265,179
1
$54,960
FILES CLOSED FOR INCOMPLETENESS
0
$0
10
$221,628
1
$336,480
0
$0
2
$500,235
0
$0
Aggregated Statistics For Year 2003 (Based on 4 partial tracts)
A) FHA, FSA/RHS & VA Home Purchase Loans
B) Conventional Home Purchase Loans
C) Refinancings
D) Home Improvement Loans
E) Loans on Dwellings For 5+ Families
F) Non-occupant Loans on < 5 Family Dwellings (A B C & D)
Number
Average Value
Number
Average Value
Number
Average Value
Number
Average Value
Number
Average Value
Number
Average Value
LOANS ORIGINATED
2
$131,790
74
$288,691
162
$181,893
4
$146,370
0
$0
91
$281,620
APPLICATIONS APPROVED, NOT ACCEPTED
0
$0
4
$155,902
18
$277,908
1
$45,990
0
$0
9
$204,131
APPLICATIONS DENIED
0
$0
7
$254,763
46
$194,232
9
$33,772
1
$168,240
13
$322,675
APPLICATIONS WITHDRAWN
0
$0
6
$124,498
25
$171,111
0
$0
0
$0
7
$248,996
FILES CLOSED FOR INCOMPLETENESS
0
$0
2
$83,560
7
$185,224
0
$0
0
$0
2
$333,675
Aggregated Statistics For Year 2002 (Based on 4 partial tracts)
A) FHA, FSA/RHS & VA Home Purchase Loans
B) Conventional Home Purchase Loans
C) Refinancings
D) Home Improvement Loans
F) Non-occupant Loans on < 5 Family Dwellings (A B C & D)
Number
Average Value
Number
Average Value
Number
Average Value
Number
Average Value
Number
Average Value
LOANS ORIGINATED
1
$128,980
62
$207,586
111
$206,556
8
$74,166
66
$277,307
APPLICATIONS APPROVED, NOT ACCEPTED
0
$0
6
$125,058
22
$198,676
3
$82,250
3
$188,803
APPLICATIONS DENIED
0
$0
9
$107,176
36
$149,796
4
$19,068
4
$199,925
APPLICATIONS WITHDRAWN
0
$0
4
$120,292
21
$108,581
3
$22,057
4
$147,210
FILES CLOSED FOR INCOMPLETENESS
0
$0
0
$0
10
$127,862
1
$49,350
1
$42,620
Aggregated Statistics For Year 2001 (Based on 4 partial tracts)
A) FHA, FSA/RHS & VA Home Purchase Loans
B) Conventional Home Purchase Loans
C) Refinancings
D) Home Improvement Loans
F) Non-occupant Loans on < 5 Family Dwellings (A B C & D)
Number
Average Value
Number
Average Value
Number
Average Value
Number
Average Value
Number
Average Value
LOANS ORIGINATED
6
$77,017
48
$214,483
67
$169,194
4
$47,108
44
$217,539
APPLICATIONS APPROVED, NOT ACCEPTED
0
$0
7
$225,281
8
$298,906
0
$0
3
$534,257
APPLICATIONS DENIED
1
$66,170
10
$235,087
41
$192,286
3
$14,207
18
$296,414
APPLICATIONS WITHDRAWN
0
$0
3
$231,423
20
$184,784
1
$22,430
4
$469,110
FILES CLOSED FOR INCOMPLETENESS
0
$0
0
$0
9
$164,626
0
$0
0
$0
Aggregated Statistics For Year 2000 (Based on 4 partial tracts)
A) FHA, FSA/RHS & VA Home Purchase Loans
B) Conventional Home Purchase Loans
C) Refinancings
D) Home Improvement Loans
F) Non-occupant Loans on < 5 Family Dwellings (A B C & D)
Number
Average Value
Number
Average Value
Number
Average Value
Number
Average Value
Number
Average Value
LOANS ORIGINATED
2
$150,295
49
$237,276
27
$139,951
6
$38,322
29
$253,946
APPLICATIONS APPROVED, NOT ACCEPTED
0
$0
4
$143,005
9
$119,263
2
$14,020
3
$116,273
APPLICATIONS DENIED
0
$0
9
$132,972
25
$118,620
2
$62,810
7
$135,714
APPLICATIONS WITHDRAWN
0
$0
3
$139,453
10
$124,834
2
$30,285
1
$56,080
FILES CLOSED FOR INCOMPLETENESS
0
$0
0
$0
8
$81,456
0
$0
0
$0
Aggregated Statistics For Year 1999 (Based on 2 partial tracts)
A) FHA, FSA/RHS & VA Home Purchase Loans
B) Conventional Home Purchase Loans
C) Refinancings
D) Home Improvement Loans
F) Non-occupant Loans on < 5 Family Dwellings (A B C & D)
Detailed PMIC statistics for the following Tracts:0780.00
2002 - 2018 National Fire Incident Reporting System (NFIRS) incidents
According to the data from the years 2002 - 2018 the average number of fire incidents per year is 19. The highest number of reported fires - 37 took place in 2009, and the least - 8 in 2007. The data has a decreasing trend.
When looking into fire subcategories, the most incidents belonged to: Structure Fires (48.6%), and Outside Fires (35.0%).
Fire incident types reported to NFIRS in Zip Code 12814

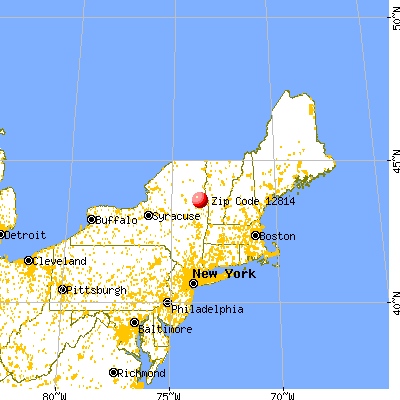


 Nearest zip codes: 12815, 12836, 12841, 12874, 12824, 12844.


 According to the data from the years 2002 - 2018 the average number of fire incidents per year is 19. The highest number of reported fires - 37 took place in 2009, and the least - 8 in 2007. The data has a decreasing trend.
 When looking into fire subcategories, the most incidents belonged to: Structure Fires (48.6%), and Outside Fires (35.0%).