Estimated zip code population in 2022: 38,197 Zip code population in 2010: 36,915 Zip code population in 2000: 34,570
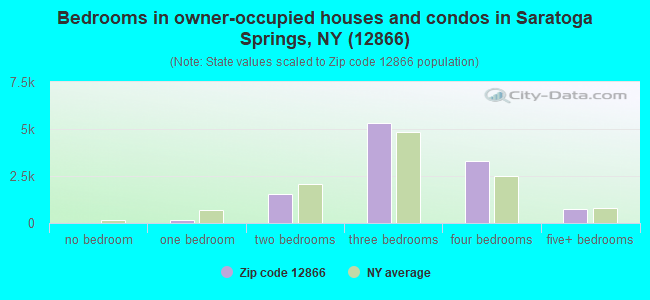
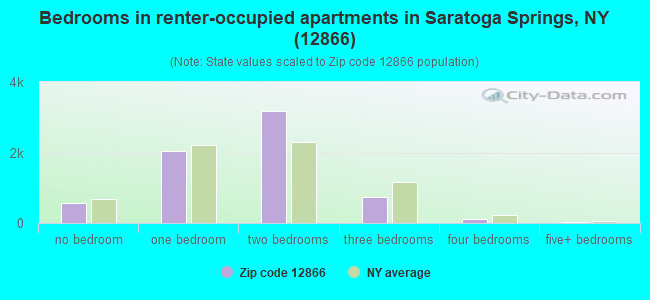
Houses and condos: 20,186 Renter-occupied apartments: 6,683
% of renters here:
38%
State:
46%
March 2022 cost of living index in zip code 12866: 108.2 (more than average, U.S. average is 100)
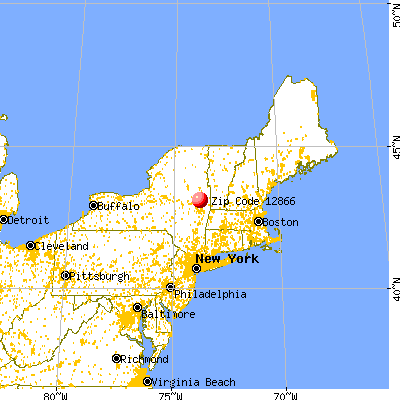
Land area: 67.0 sq. mi. Water area: 4.1 sq. mi.
Population density: 570 people per square mile
(low).
OSM Map
General Map
Google Map
MSN Map
OSM Map
General Map
Google Map
MSN Map
OSM Map
General Map
Google Map
MSN Map
OSM Map
General Map
Google Map
MSN Map
Please wait while loading the map...
Real estate property taxes paid for housing units in 2022:
This zip code:
1.3% ($5,497)
New York:
1.5% ($6,180)
Median real estate property taxes paid for housing units with mortgages in 2022: $5,670 (1.3%) Median real estate property taxes paid for housing units with no mortgage in 2022: $5,162 (1.3%)
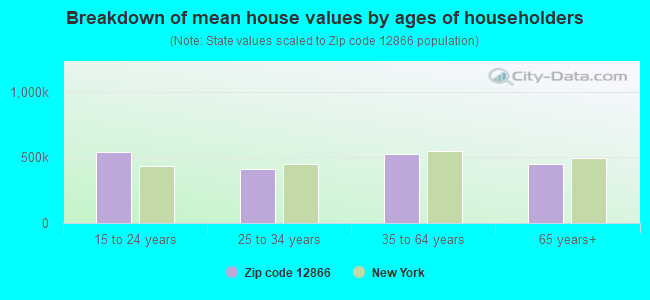
Estimated median house/condo value in 2022: $416,245
12866:
$416,245
New York:
$400,400
According to our research of New York and other state lists, there were 37 registered sex offenders living in 12866 zip code as of April 23, 2024. The ratio of all residents to sex offenders in zip code 12866 is 1,053 to 1. The ratio of registered sex offenders to all residents in this zip code is near the state average.
Median resident age:
This zip code:
45.4 years
New York median age:
40.0 years
Average household size:
This zip code:
2.0 people
New York:
2.5 people
Averages for the 2020 tax year for zip code 12866, filed in 2021:
Average Adjusted Gross Income (AGI) in 2020: $176,441 (Individual Income Tax Returns)
Here:
$176,441
State:
$90,930
Salary/wage: $100,053 (reported on 76.7% of returns)
Here:
$100,053
State:
$72,104
(% of AGI for various income ranges: 1089.5% for AGIs below $25k, 3398.3% for AGIs $25k-50k, 6049.4% for AGIs $50k-75k, 8761.5% for AGIs $75k-100k, 17177.0% for AGIs $100k-200k, 124432.8% for AGIs over 200k)
Taxable interest for individuals: $6,768 (reported on 47.6% of returns)
This zip code:
$6,768
New York:
$3,075
(% of AGI for various income ranges: 22.9% for AGIs below $25k, 29.7% for AGIs $25k-50k, 55.6% for AGIs $50k-75k, 97.4% for AGIs $75k-100k, 216.0% for AGIs $100k-200k, 8472.2% for AGIs over 200k)
Ordinary dividends: $26,732 (reported on 34.5% of returns)
Here:
$26,732
State:
$11,095
(% of AGI for various income ranges: 58.5% for AGIs below $25k, 90.9% for AGIs $25k-50k, 173.9% for AGIs $50k-75k, 306.7% for AGIs $75k-100k, 644.8% for AGIs $100k-200k, 24041.0% for AGIs over 200k)
Net capital gain/loss in AGI: +$143,700 (reported on 30.9% of returns)
Here:
+$143,700
State:
+$44,925
(% of AGI for various income ranges: 29.0% for AGIs below $25k, 84.7% for AGIs $25k-50k, 143.9% for AGIs $50k-75k, 289.8% for AGIs $75k-100k, 1061.5% for AGIs $100k-200k, 129227.9% for AGIs over 200k)
Profit/loss from business: +$29,538 (reported on 16.8% of returns)
Here:
+$29,538
State:
+$14,940
(% of AGI for various income ranges: 104.9% for AGIs below $25k, 176.8% for AGIs $25k-50k, 195.2% for AGIs $50k-75k, 394.3% for AGIs $75k-100k, 1015.5% for AGIs $100k-200k, 9272.4% for AGIs over 200k)
Taxable individual retirement arrangement distribution: $26,152 (reported on 13.0% of returns)
12866:
$26,152
New York:
$19,609
(% of AGI for various income ranges: 80.0% for AGIs below $25k, 124.7% for AGIs $25k-50k, 275.6% for AGIs $50k-75k, 507.8% for AGIs $75k-100k, 1116.4% for AGIs $100k-200k, 4132.8% for AGIs over 200k)
Self-employed (Keogh) retirement plans: $27,522 (reported on 2.0% of returns)
12866:
$27,522
New York:
$32,497
(% of AGI for various income ranges: 10.4% for AGIs $25k-50k, 18.1% for AGIs $75k-100k, 88.8% for AGIs $100k-200k, 1306.8% for AGIs over 200k)
Total itemized deductions: $77,374 (reported on 14.0% of returns)
Here:
$77,374
State:
$39,326
(% of AGI for various income ranges: 119.9% for AGIs below $25k, 158.4% for AGIs $25k-50k, 322.2% for AGIs $50k-75k, 628.8% for AGIs $75k-100k, 1142.0% for AGIs $100k-200k, 25854.0% for AGIs over 200k)
Charity contributions: $58,499 (reported on 11.5% of returns)
Here:
$58,499
State:
$15,420
(% of AGI for various income ranges: 6.9% for AGIs below $25k, 11.9% for AGIs $25k-50k, 34.8% for AGIs $50k-75k, 65.4% for AGIs $75k-100k, 184.3% for AGIs $100k-200k, 19509.7% for AGIs over 200k)
Taxes paid: $9,031 (reported on 13.9% of returns)
12866:
$9,031
State:
$9,183
(% of AGI for various income ranges: 24.7% for AGIs below $25k, 43.8% for AGIs $25k-50k, 104.5% for AGIs $50k-75k, 235.9% for AGIs $75k-100k, 382.4% for AGIs $100k-200k, 1557.6% for AGIs over 200k)
Earned income credit: $1,673 (reported on 7.4% of returns)
Here:
$1,673
State:
$2,138
(% of AGI for various income ranges: 47.7% for AGIs below $25k, 34.2% for AGIs $25k-50k)
Percentage of individuals using paid preparers for their 2020 taxes: 94.5%
Here:
95%
State:
95%
(% for various income ranges: 93.0% for AGIs below $25k, 94.9% for AGIs $25k-50k, 94.2% for AGIs $50k-75k, 93.8% for AGIs $75k-100k, 95.4% for AGIs $100k-200k, 97.1% for AGIs over 200k)
Averages for the 2012 tax year for zip code 12866, filed in 2013:
Average Adjusted Gross Income (AGI) in 2012: $187,243 (Individual Income Tax Returns)
Here:
$187,243
State:
$77,088
Salary/wage: $77,123 (reported on 80.6% of returns)
Here:
$77,123
State:
$60,593
(% of AGI for various income ranges: 70.9% for AGIs below $25k, 75.9% for AGIs $25k-50k, 68.3% for AGIs $50k-75k, 67.7% for AGIs $75k-100k, 70.0% for AGIs $100k-200k, 19.1% for AGIs over 200k)
Taxable interest for individuals: $11,564 (reported on 50.2% of returns)
This zip code:
$11,564
New York:
$3,125
(% of AGI for various income ranges: 1.6% for AGIs below $25k, 0.8% for AGIs $25k-50k, 0.9% for AGIs $50k-75k, 0.8% for AGIs $75k-100k, 0.7% for AGIs $100k-200k, 4.0% for AGIs over 200k)
Ordinary dividends: $29,232 (reported on 33.1% of returns)
Here:
$29,232
State:
$10,299
(% of AGI for various income ranges: 3.4% for AGIs below $25k, 1.7% for AGIs $25k-50k, 2.3% for AGIs $50k-75k, 1.9% for AGIs $75k-100k, 2.1% for AGIs $100k-200k, 6.3% for AGIs over 200k)
Net capital gain/loss in AGI: +$249,833 (reported on 25.3% of returns)
Here:
+$249,833
State:
+$42,474
(% of AGI for various income ranges: 0.1% for AGIs below $25k, 0.6% for AGIs $25k-50k, 0.9% for AGIs $50k-75k, 0.8% for AGIs $75k-100k, 2.0% for AGIs $100k-200k, 46.2% for AGIs over 200k)
Profit/loss from business: +$23,126 (reported on 16.2% of returns)
Here:
+$23,126
State:
+$16,168
(% of AGI for various income ranges: 7.0% for AGIs below $25k, 3.5% for AGIs $25k-50k, 3.2% for AGIs $50k-75k, 2.3% for AGIs $75k-100k, 4.0% for AGIs $100k-200k, 1.4% for AGIs over 200k)
Taxable individual retirement arrangement distribution: $25,937 (reported on 12.5% of returns)
12866:
$25,937
New York:
$17,621
(% of AGI for various income ranges: 3.1% for AGIs below $25k, 2.8% for AGIs $25k-50k, 3.2% for AGIs $50k-75k, 3.2% for AGIs $75k-100k, 3.0% for AGIs $100k-200k, 1.2% for AGIs over 200k)
Self-employment retirement plans: $23,788 (reported on 1.8% of returns)
12866:
$23,788
New York:
$27,330
(% of AGI for various income ranges: 0.2% for AGIs below $25k, 0.2% for AGIs $50k-75k, 0.4% for AGIs $100k-200k, 0.2% for AGIs over 200k)
Total itemized deductions: $65,308 (16% of AGI, reported on 41.0% of returns)
Here:
$65,308
State:
$34,985
Here:
16.0% of AGI
State:
21.3% of AGI
(% of AGI for various income ranges: 12.8% for AGIs below $25k, 9.7% for AGIs $25k-50k, 13.3% for AGIs $50k-75k, 14.9% for AGIs $75k-100k, 16.8% for AGIs $100k-200k, 14.2% for AGIs over 200k)
Charity contributions: $20,174 (reported on 34.4% of returns)
Here:
$20,174
State:
$5,572
(% of AGI for various income ranges: 0.5% for AGIs below $25k, 0.7% for AGIs $25k-50k, 1.1% for AGIs $50k-75k, 1.4% for AGIs $75k-100k, 1.6% for AGIs $100k-200k, 4.6% for AGIs over 200k)
Taxes paid: $32,366 (reported on 40.8% of returns)
12866:
$32,366
State:
$18,656
(% of AGI for various income ranges: 3.5% for AGIs below $25k, 3.5% for AGIs $25k-50k, 5.3% for AGIs $50k-75k, 6.5% for AGIs $75k-100k, 8.5% for AGIs $100k-200k, 7.3% for AGIs over 200k)
Earned income credit: $1,644 (reported on 9.4% of returns)
Here:
$1,644
State:
$2,230
(% of AGI for various income ranges: 3.2% for AGIs below $25k, 0.5% for AGIs $25k-50k)
Percentage of individuals using paid preparers for their 2012 taxes: 53.0%
Here:
53%
State:
66%
(% for various income ranges: 45.2% for AGIs below $25k, 46.6% for AGIs $25k-50k, 53.9% for AGIs $50k-75k, 57.4% for AGIs $75k-100k, 60.8% for AGIs $100k-200k, 81.0% for AGIs over 200k)
Averages for the 2004 tax year for zip code 12866, filed in 2005:
Average Adjusted Gross Income (AGI) in 2004: $75,076 (Individual Income Tax Returns)
Here:
$75,076
State:
$59,519
Salary/wage: $57,573 (reported on 82.6% of returns)
Here:
$57,573
State:
$50,673
(% of AGI for various income ranges: 150.7% for AGIs below $10k, 74.6% for AGIs $10k-25k, 78.4% for AGIs $25k-50k, 75.1% for AGIs $50k-75k, 76.4% for AGIs $75k-100k, 54.4% for AGIs over 100k)
Taxable interest for individuals: $2,892 (reported on 60.0% of returns)
This zip code:
$2,892
New York:
$2,377
(% of AGI for various income ranges: 16.1% for AGIs below $10k, 2.5% for AGIs $10k-25k, 1.6% for AGIs $25k-50k, 1.5% for AGIs $50k-75k, 1.1% for AGIs $75k-100k, 2.6% for AGIs over 100k)
Taxable dividends: $7,500 (reported on 35.2% of returns)
Here:
$7,500
State:
$5,394
(% of AGI for various income ranges: 13.2% for AGIs below $10k, 2.8% for AGIs $10k-25k, 1.7% for AGIs $25k-50k, 1.9% for AGIs $50k-75k, 1.9% for AGIs $75k-100k, 4.4% for AGIs over 100k)
Net capital gain/loss: +$39,470 (reported on 27.4% of returns)
Here:
+$39,470
State:
+$23,581
(% of AGI for various income ranges: 4.1% for AGIs below $10k, 0.9% for AGIs $10k-25k, 0.7% for AGIs $25k-50k, 1.2% for AGIs $50k-75k, 1.7% for AGIs $75k-100k, 22.7% for AGIs over 100k)
Profit/loss from business: +$22,838 (reported on 15.8% of returns)
Here:
+$22,838
State:
+$13,809
(% of AGI for various income ranges: 2.4% for AGIs below $10k, 4.1% for AGIs $10k-25k, 4.0% for AGIs $25k-50k, 2.9% for AGIs $50k-75k, 3.2% for AGIs $75k-100k, 5.7% for AGIs over 100k)
IRA payment deduction: $2,957 (reported on 3.5% of returns)
12866:
$2,957
New York:
$3,115
(% of AGI for various income ranges: 0.5% for AGIs below $10k, 0.3% for AGIs $10k-25k, 0.4% for AGIs $25k-50k, 0.2% for AGIs $50k-75k, 0.2% for AGIs $75k-100k, 0.1% for AGIs over 100k)
Self-employed pension: $16,016 (reported on 1.8% of returns)
Here:
$16,016
New York:
$19,016
(% of AGI for various income ranges: 0.1% for AGIs $10k-25k, 0.1% for AGIs $25k-50k, 0.1% for AGIs $50k-75k, 0.4% for AGIs $75k-100k, 0.5% for AGIs over 100k)
Total itemized deductions: $27,142 (18% of AGI, reported on 39.8% of returns)
Here:
$27,142
State:
$25,864
Here:
18.0% of AGI
State:
21.9% of AGI
(% of AGI for various income ranges: 25.1% for AGIs below $10k, 9.5% for AGIs $10k-25k, 11.5% for AGIs $25k-50k, 15.5% for AGIs $50k-75k, 17.2% for AGIs $75k-100k, 14.4% for AGIs over 100k)
Charity contributions deductions: $5,508 (3% of AGI, reported on 36.5% of returns)
Here:
$5,508
State:
$4,439
Here:
3.5% of AGI
State:
3.6% of AGI
(% of AGI for various income ranges: 1.2% for AGIs below $10k, 0.7% for AGIs $10k-25k, 1.0% for AGIs $25k-50k, 1.6% for AGIs $50k-75k, 1.9% for AGIs $75k-100k, 3.5% for AGIs over 100k)
Total tax: $14,911 (reported on 81.0% of returns)
12866:
$14,911
State:
$11,730
(% of AGI for various income ranges: 4.8% for AGIs below $10k, 4.8% for AGIs $10k-25k, 8.1% for AGIs $25k-50k, 9.9% for AGIs $50k-75k, 11.1% for AGIs $75k-100k, 20.5% for AGIs over 100k)
Earned income credit: $1,349 (reported on 8.9% of returns)
Here:
$1,349
State:
$1,757
Percentage of individuals using paid preparers for their 2004 taxes: 56.8%
Here:
57%
State:
67%
(% for various income ranges: 49.9% for AGIs below $10k, 54.9% for AGIs $10k-25k, 54.0% for AGIs $25k-50k, 57.8% for AGIs $50k-75k, 60.6% for AGIs $75k-100k, 69.5% for AGIs over 100k)
Likely homosexual households (counted as self-reported same-sex unmarried-partner households)
Lesbian couples: 0.0% of all households
Gay men: 0.1% of all households
Household received Food Stamps/SNAP in the past 12 months: 1,116 Household did not receive Food Stamps/SNAP in the past 12 months: 16,473
Women who had a birth in the past 12 months: 292 (251 now married, 39 unmarried) Women who did not have a birth in the past 12 months: 7,978 (2,763 now married, 5,221 unmarried)
Housing units in zip code 12866 with a mortgage: 6,925 (1,055 second mortgage, 5 home equity loan, 939 both second mortgage and home equity loan) Houses without a mortgage: 320
Median monthly owner costs for units with a mortgage: $2,136 Median monthly owner costs for units without a mortgage: $786
Residents with income below the poverty level in 2022:
This zip code:
9.0%
Whole state:
14.3%
Residents with income below 50% of the poverty level in 2022:
This zip code:
3.9%
Whole state:
6.8%
Median number of rooms in houses and condos:
Here:
6.8
State:
6.3
Median number of rooms in apartments:
Here:
3.7
State:
3.8
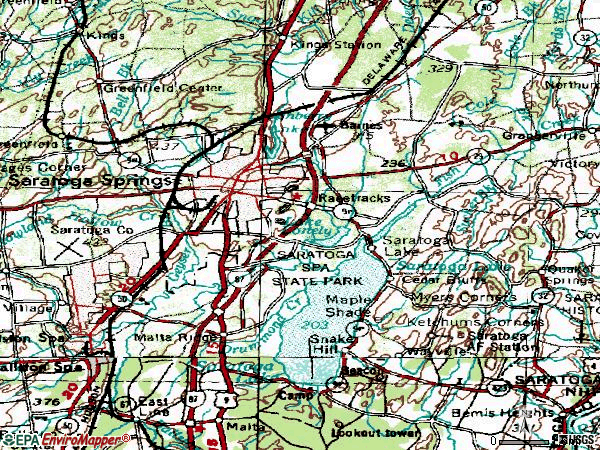
Notable locations in this zip code not listed on our city pages
3,779 married couples with children.
1,185 single-parent households (257 men, 928 women).
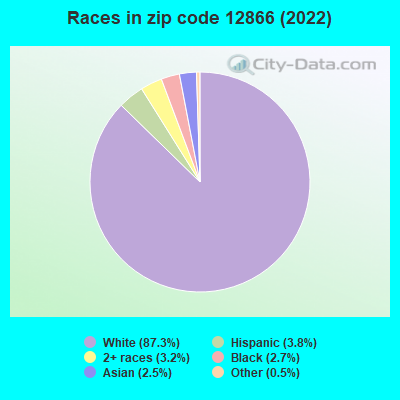
92.1% of residents of 12866 zip code speak English at home.
2.3% of residents speak Spanish at home (61% very well, 30% well, 8% not well, 1% not at all).
2.8% of residents speak other Indo-European language at home (81% very well, 10% well, 7% not well, 2% not at all).
2.5% of residents speak Asian or Pacific Island language at home (60% very well, 28% well, 11% not well).
0.5% of residents speak other language at home (81% very well, 11% well, 8% not well).
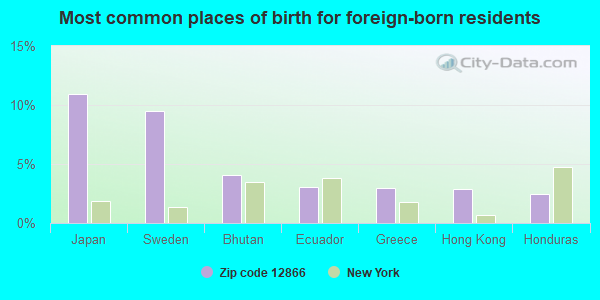
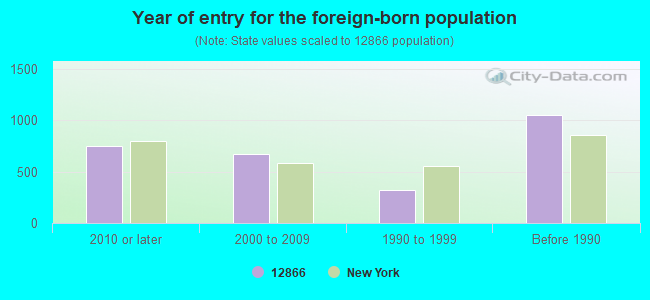
Foreign born population: 2,228 (5.8%) (63.6% of them are naturalized citizens)
Major facilities with environmental interests located in this zip code:
ADVANTAGE CHEVROLET (1 WEST AVE in SARATOGA SPRINGS, NY)
STATE MASTER (New York facility tracking) - HAZARDOUS WASTE PROGRAM (Resource Conservation and Recovery Act (tracking hazardous waste)) Organizations: ADVANTAGE CHEVROLET INC (LEGALLY RESPONSIBLE PARTY)
AJ S WASH & DRY CLEANERS (48 LINCOLN AVE in SARATOGA SPRINGS, NY)
AIR MINOR (AIRS/AFS) STATE MASTER (New York facility tracking) - AIR PROGRAM (Resource Conservation and Recovery Act (tracking hazardous waste)) Business SIC classification: DRYCLEANING PLANTS, EXCEPT RUG CLEANING Business NAICS classification: DRYCLEANING AND LAUNDRY SERVICES (EXCEPT COIN-OPERATED). Organizations: SHARON CLEANERS (LEGALLY RESPONSIBLE PARTY)
Alternative names: AJ'S WASH & DRY CLEANERS
GREENFIELD MANUFACTURING INC (49 GEYSER ROAD in SARATOGA SPRINGS, NY)
STATE MASTER (New York facility tracking) - AIR PROGRAM Small Quantity Generators, between 100 kg and 1000 kg of hazardous waste/month (Resource Conservation and Recovery Act (tracking hazardous waste)) Business SIC classification: PLASTICS MATERIALS, SYNTHETIC RESINS, AND NONVULCANIZABLE ELASTOMERS; SYNTHETIC RUBBER (VULCANIZABLE ELASTOMERS) Organizations: GREENFIELD MFG INC (CONTACT/OPERATOR)
, MUNTER ENT LLC (CONTACT/OWNER)
GEYSER ROAD ES ( in SARATOGA SPRINGS, NY)
(National Center for Education Statistics) - STATE ID-521800010014 Organizations: SARATOGA SPRINGS CITY SD (SCHOOL DISTRICT)
ALPINE ESTATES (205 WASHINGTON ST BOX 4576 in SARATOGA SPRINGS, NY)
(Integrated Compliance Information System) - ICIS-02-2000-8414, FORMAL ENFORCEMENT ACTION Business SIC classification: WATER SUPPLY
GILBERT ROAD SUBDIVISION (5 PIPING ROCK CIRCLE in SARATOGA SPRINGS, NY)
(Integrated Compliance Information System) - ICIS-02-2000-8407, FORMAL ENFORCEMENT ACTION Business SIC classification: WATER SUPPLY
617 MAPLE AVE ( in SARATOGA SPRINGS, NY)
National Pollutant Discharge Elimination System NON-MAJOR (Tracking pollutant discharge elimination systems) - permit Organizations: SARATOGA CHRYSLER PLYMOUTH (CONTACT/OWNER)
Alternative names: SARATOGA CHRYSLER PLYMOUTH, SARATOGA CHYSLER PLYMOUTH
GETTY PETROLEUM CORP (207 S BROADWAY in SARATOGA SPRINGS, NY)
(Resource Conservation and Recovery Act (tracking hazardous waste))
CONGRESS GAS & OIL COMPANY INC (617 MAPLE AVENUE in SARATOGA SPRINGS, NY)
Conditionally Exempt Small Quantity Generators, less than 100 kg/month of hazardous waste (Resource Conservation and Recovery Act (tracking hazardous waste)) - notification TRANSPORTER (Resource Conservation and Recovery Act (tracking hazardous waste)) - notification TRI REPORTER (Tracking of toxic chemicals releasing facilities) Business SIC classification: PETROLEUM BULK STATIONS AND TERMINALS Organizations: CONGRESS GAS & OIL CO INC (CONTACT/OWNER)
Alternative names: CONGRESS GAS & OIL TANK FARM, MOHAWK VALLEY OIL, SARATOGA TERMINAL
ADVANCED DYNAMICS CORP (9 GRANDE BLVD in SARATOGA SPRINGS, NY)
(Resource Conservation and Recovery Act (tracking hazardous waste))
ADVANTAGE CHEVROLET INC (2202 RTE 50 S in SARATOGA SPRINGS, NY)
HAZARDOUS WASTE BIENNIAL REPORTER (Resource Conservation and Recovery Act (tracking hazardous waste)) Small Quantity Generators, between 100 kg and 1000 kg of hazardous waste/month (Resource Conservation and Recovery Act (tracking hazardous waste)) - notification Organizations: JAMES J MORRELL (CONTACT/OWNER)
GUYSON CORP (13 GRANDE BLVD in SARATOGA SPRINGS, NY)
(Resource Conservation and Recovery Act (tracking hazardous waste))
HOME DEPOT USA INC HD1223 (3043 RTE 50 in SARATOGA SPRINGS, NY)
Conditionally Exempt Small Quantity Generators, less than 100 kg/month of hazardous waste (Resource Conservation and Recovery Act (tracking hazardous waste)) Alternative names: HOME DEPOT THE 1223
Housing units lacking complete plumbing facilities: 0.3% Housing units lacking complete kitchen facilities: 0.7%
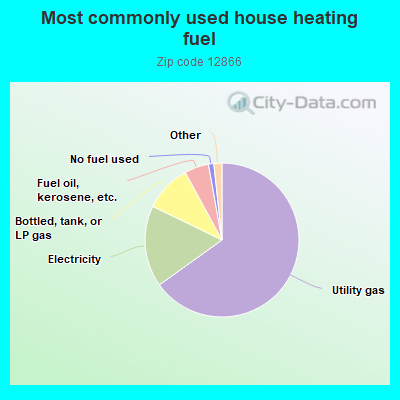
65.1%Utility gas
17.1%Electricity
9.9%Bottled, tank, or LP gas
5.1%Fuel oil, kerosene, etc.
1.1%No fuel used
1.0%Wood
0.7%Other fuel
Population in 1990: 30,086. Population change in the 1990s: +4,484 (+14.9%).
Place of birth for U.S.-born residents:
This state: 25,334
Northeast: 4,790
Midwest: 1,536
South: 2,073
West: 1,718
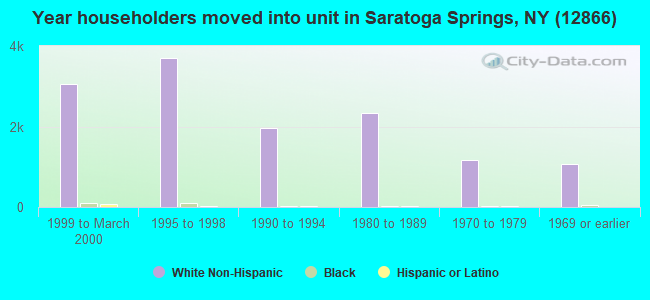
52% of the 12866 zip code residents lived in the same house 5 years ago. Out of people who lived in different houses, 50% lived in this county. Out of people who lived in different counties, 50% lived in New York.
87% of the 12866 zip code residents lived in the same house 1 year ago. Out of people who lived in different houses, 48% moved from this county. Out of people who lived in different houses, 28% moved from different county within same state. Out of people who lived in different houses, 21% moved from different state. Out of people who lived in different houses, 3% moved from abroad.
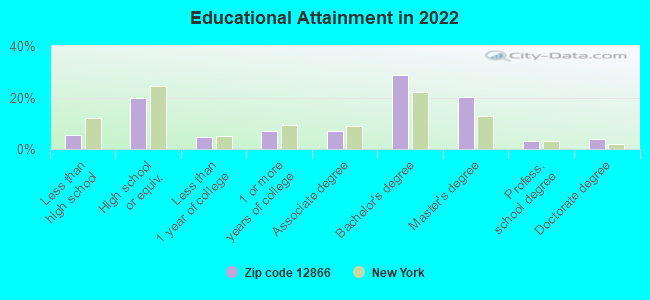
Private vs. public school enrollment:
Students in private schools in grades 1 to 8 (elementary and middle school): 113
Here:
4.5%
New York:
15.6%
Students in private schools in grades 9 to 12 (high school): 107
Here:
8.1%
New York:
15.0%
Students in private undergraduate colleges: 2,353
Here:
76.8%
New York:
39.2%
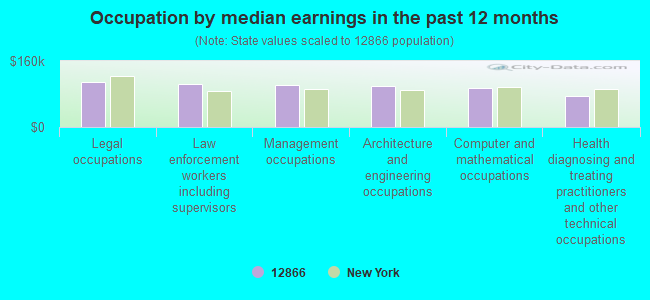
Occupation by median earnings in the past 12 months ($)
109,123Legal occupations
104,007Law enforcement workers including supervisors
101,770Management occupations
98,293Architecture and engineering occupations
94,349Computer and mathematical occupations
74,710Health diagnosing and treating practitioners and other technical occupations
Companies with biggest federal contracts located in this zip code:
ESPEY MFG & ELECTRONICS CORP (233 BALLSTON AVE in SARATOGA SPRIN, NY; small business) : $3,399,455 in 110 contractsfrom 1999 to 2006
Contracts for Converters, Electrical, Nonrotating, Filters and Networks, Coils and Transformers, Hardware, Weapon System, and moreby Navy, Defense Logistics Agency, Air Force, Army, and others Signed by year:2000: $519,903; 2001: $359,085; 2002: $194,592; 2003: $429,140; 2004: $930,525; 2005: $546,235; 2006: $252,588.
Biggest contracts:
$290,000 with Navy for Converters, Electrical, Nonrotating. Signed on 2004-04-29. Completion date: 2005-04-29.
$288,400 with Navy for Filters and Networks. Signed on 2000-01-28. Completion date: 2001-04-23.
$206,800, same as above.Signed on 2003-09-10. Completion date: 2004-09-09.
$179,820 with Navy for Coils and Transformers. Signed on 2004-02-24. Completion date: 2005-02-24.
SCHENECTADY TURBINE SERVICES (41 OLD GICK ROAD in SARATOGA SPRIN, NY; small business) : $768,000 in 10 contractsfrom 2000 to 2003
Contracts for Gas Turbines and Jet Engines, Non-Aircraft; and Components, Power and Hand Pumps by Tennessee Valley Authority, Navy Signed by year:2000: $732,000; 2001: $0; 2002: $0; 2003: $36,000; 2004: $0; 2005: $0; 2006: $0.
Biggest contracts:
$366,000 with Tennessee Valley Authority for Gas Turbines and Jet Engines, Non-Aircraft; and Components. Signed on 2000-06-15. Completion date: 2000-06-15.
$67,000, same as above.Signed on 2000-02-15. Completion date: 2000-03-15.
$65,000, same as above.Signed on 2000-08-15. Completion date: 2000-10-15.
$59,000, same as above.Signed on 2000-06-15. Completion date: 2000-07-15.
YMCA OF SARATOGA (262 BROADWAY in SARATOGA SPRIN, NY) : $436,040 in 5 contractsfrom 2002 to 2004
Contracts for Recreational Services by Navy Signed by year:2000: $0; 2001: $0; 2002: $198,200; 2003: $89,190; 2004: $148,650; 2005: $0; 2006: $0.
Biggest contracts:
$118,920 with Navy for Recreational Services. Signed on 2004-10-01. Completion date: 2005-09-30.
$118,920, same as above.Signed on 2002-10-01. Completion date: 2003-09-30.
$89,190, same as above.Signed on 2003-10-01. Completion date: 2004-06-30.
$79,280, same as above.Signed on 2002-02-01. Completion date: 2002-09-30.
David Culpepper (3 Saratoga Circle in Saratoga, NY; small business) : $431,821 in 3 contractsfrom 2005 to 2006
$300,200 with Departmental Offices for Personal Services Contracts. Taking place in DC. Signed on 2005-08-29. Completion date: 2006-08-28.
$186,341, same as above.Signed on 2006-08-23. Completion date: 2010-08-28.
-$54,720, same as above.Signed on 2005-11-29. Completion date: 2006-08-28.
ENCORE ELECTRONICS CORP (4400 ROUTE 50 in SARATOGA SPRIN, NY; small business) : $389,035 in 3 contractsfrom 2000 to 2005
$342,614 with Air Force for Electrical and Electronic Properties Measuring and Testing Instruments. Signed on 2000-09-25. Completion date: 2001-01-25.
$37,665, same as above.Signed on 2002-04-15. Completion date: 2002-05-31.
$8,756 with NASA for Amplifiers. Signed on 2005-06-17. Completion date: 2005-06-22.
SPARKLE GLISTEN & SHINE INC (4 MONROE ST in SARATOGA SPRIN, NY; small business) : $45,504 in 4 contractsfrom 2003 to 2006
$12,216 with Army for Custodial Janitorial Services. Signed on 2006-02-10. Completion date: 2006-02-28.
$11,640, same as above.Signed on 2005-04-06. Completion date: 2006-02-28.
$11,088, same as above.Signed on 2004-03-01. Completion date: 2005-02-28.
$10,560, same as above.Signed on 2003-02-27. Completion date: 2004-02-28.
UPSTATE TRANSIT INC (GEYSER RD in SARATOGA SPRIN, NY; small business) : $26,173 in 2 contractsin 2003
$23,418 with Army for Motor Passenger Services. Signed on 2003-02-27. Completion date: 2003-03-31.
$2,755, same as above.Signed on 2003-03-11. Completion date: 2003-03-31.
C N A ENVIRONMENTAL INC (446 MAPLE AVE in SARATOGA SPRIN, NY; small business) : $14,692 in 6 contractsfrom 2004 to 2006
Contracts for Water Quality Support Services by Army Signed by year:2000: $0; 2001: $0; 2002: $0; 2003: $0; 2004: $5,004; 2005: $4,696; 2006: $4,992.
Biggest contracts:
$4,992 with Army for Water Quality Support Services. Signed on 2006-05-03. Completion date: 2007-05-16.
$4,992, same as above.Signed on 2004-05-12. Completion date: 2005-05-16.
$4,888, same as above.Signed on 2005-05-06. Completion date: 2006-05-16.
$12, same as above.Signed on 2004-06-04. Completion date: 2004-05-16.
TORELLS CARPET LAND CORP (78 CHURCH ST in SARATOGA SPRIN, NY; small business)
$4,635 with Navy for Maintenance, Repair or Alteration of Real Property -- Family Housing Facilities. Signed on 2003-05-09. Completion date: 2003-05-23.
GEORGIA MILLS DIRECT LTD (28 CLINTON ST STE 4 in SARATOGA SPRIN, NY; small business)
$2,968 with Air Force for Floor Coverings. Signed on 2005-09-02. Completion date: 2005-09-16.
Top industries in this zip code by the number of employees in 2005:
2002 - 2018 National Fire Incident Reporting System (NFIRS) incidents
Based on the data from the years 2002 - 2018 the average number of fire incidents per year is 109. The highest number of reported fire incidents - 163 took place in 2012, and the least - 48 in 2008. The data has a declining trend.
When looking into fire subcategories, the most incidents belonged to: Structure Fires (53.1%), and Outside Fires (19.0%).
Fire incident types reported to NFIRS in Zip Code 12866


 Nearest zip codes: 12170, 12833, 12871, 12831, 12020, 12884.


 Based on the data from the years 2002 - 2018 the average number of fire incidents per year is 109. The highest number of reported fire incidents - 163 took place in 2012, and the least - 48 in 2008. The data has a declining trend.
 When looking into fire subcategories, the most incidents belonged to: Structure Fires (53.1%), and Outside Fires (19.0%).