Estimated zip code population in 2022: 1,839 Zip code population in 2010: 2,028 Zip code population in 2000: 2,122
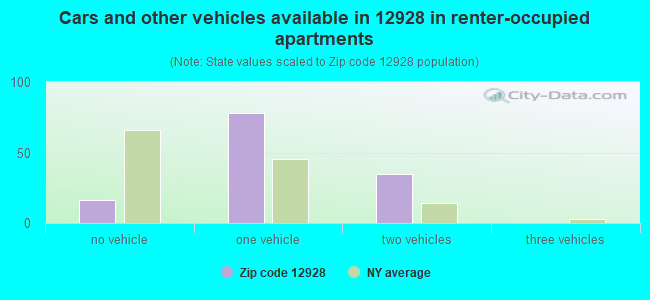
Houses and condos: 1,138 Renter-occupied apartments: 128
% of renters here:
16%
State:
46%
March 2022 cost of living index in zip code 12928: 94.1 (less than average, U.S. average is 100)
Land area: 75.5 sq. mi. Water area: 0.9 sq. mi.
Population density: 24 people per square mile
(very low).
OSM Map
General Map
Google Map
MSN Map
OSM Map
General Map
Google Map
MSN Map
OSM Map
General Map
Google Map
MSN Map
OSM Map
General Map
Google Map
MSN Map
Please wait while loading the map...
Real estate property taxes paid for housing units in 2022:
This zip code:
1.7% ($2,544)
New York:
1.5% ($6,180)
Median real estate property taxes paid for housing units with mortgages in 2022: $3,334 (2.0%) Median real estate property taxes paid for housing units with no mortgage in 2022: $1,594 (1.4%)
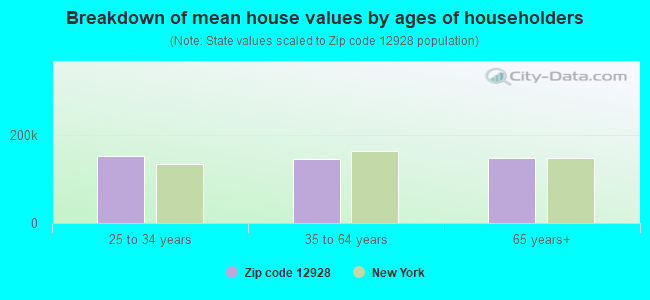
Estimated median house/condo value in 2022: $151,883
12928:
$151,883
New York:
$400,400
According to our research of New York and other state lists, there were 2 registered sex offenders living in 12928 zip code as of April 24, 2024. The ratio of all residents to sex offenders in zip code 12928 is 943 to 1. The ratio of registered sex offenders to all residents in this zip code is near the state average.
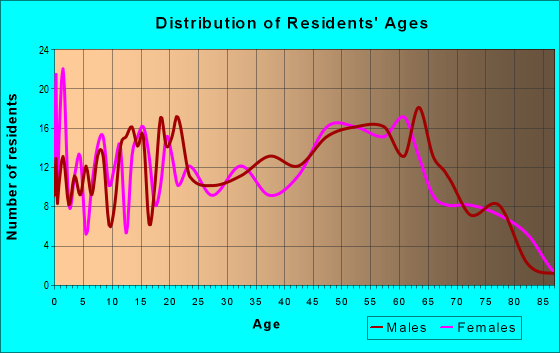
Median resident age:
This zip code:
50.1 years
New York median age:
40.0 years
Average household size:
This zip code:
2.2 people
New York:
2.5 people
Averages for the 2020 tax year for zip code 12928, filed in 2021:
Average Adjusted Gross Income (AGI) in 2020: $53,237 (Individual Income Tax Returns)
Here:
$53,237
State:
$90,930
Salary/wage: $47,431 (reported on 78.7% of returns)
Here:
$47,431
State:
$72,104
(% of AGI for various income ranges: 1064.7% for AGIs below $25k, 3346.7% for AGIs $25k-50k, 6464.0% for AGIs $50k-75k, 7636.2% for AGIs $75k-100k, 14972.2% for AGIs $100k-200k)
Taxable interest for individuals: $539 (reported on 29.8% of returns)
This zip code:
$539
New York:
$3,075
(% of AGI for various income ranges: 17.4% for AGIs below $25k, 10.5% for AGIs $25k-50k, 33.0% for AGIs $50k-75k, 13.8% for AGIs $75k-100k, 57.8% for AGIs $100k-200k)
Ordinary dividends: $1,027 (reported on 11.7% of returns)
Here:
$1,027
State:
$11,095
(% of AGI for various income ranges: 14.8% for AGIs $25k-50k, 21.0% for AGIs $50k-75k, 67.8% for AGIs $100k-200k)
Net capital gain/loss in AGI: +$6,375 (reported on 8.5% of returns)
Here:
+$6,375
State:
+$44,925
(% of AGI for various income ranges: 11.1% for AGIs below $25k, 46.0% for AGIs $50k-75k, 492.2% for AGIs $100k-200k)
Profit/loss from business: +$5,850 (reported on 10.6% of returns)
Here:
+$5,850
State:
+$14,940
(% of AGI for various income ranges: 158.4% for AGIs below $25k, 345.6% for AGIs $100k-200k)
Taxable individual retirement arrangement distribution: $14,675 (reported on 8.5% of returns)
12928:
$14,675
New York:
$19,609
(% of AGI for various income ranges: 138.4% for AGIs below $25k, 273.0% for AGIs $50k-75k, 708.9% for AGIs $100k-200k)
Total itemized deductions: $26,567 (reported on 3.2% of returns)
Here:
$26,567
State:
$39,326
(% of AGI for various income ranges: 797.0% for AGIs $50k-75k)
Taxes paid: $7,133 (reported on 3.2% of returns)
12928:
$7,133
State:
$9,183
(% of AGI for various income ranges: 214.0% for AGIs $50k-75k)
Earned income credit: $1,964 (reported on 14.9% of returns)
Here:
$1,964
State:
$2,138
(% of AGI for various income ranges: 74.7% for AGIs below $25k, 63.3% for AGIs $25k-50k)
Percentage of individuals using paid preparers for their 2020 taxes: 96.8%
Here:
97%
State:
95%
(% for various income ranges: 96.4% for AGIs below $25k, 96.3% for AGIs $25k-50k, 92.9% for AGIs $50k-75k, 100.0% for AGIs $75k-100k, 100.0% for AGIs $100k-200k)
Averages for the 2012 tax year for zip code 12928, filed in 2013:
Average Adjusted Gross Income (AGI) in 2012: $45,556 (Individual Income Tax Returns)
Here:
$45,556
State:
$77,088
Salary/wage: $40,632 (reported on 83.0% of returns)
Here:
$40,632
State:
$60,593
(% of AGI for various income ranges: 63.5% for AGIs below $25k, 72.0% for AGIs $25k-50k, 81.4% for AGIs $50k-75k, 79.1% for AGIs $75k-100k, 69.7% for AGIs $100k-200k)
Taxable interest for individuals: $525 (reported on 36.4% of returns)
This zip code:
$525
New York:
$3,125
(% of AGI for various income ranges: 1.3% for AGIs below $25k, 0.3% for AGIs $25k-50k, 0.4% for AGIs $50k-75k, 0.1% for AGIs $75k-100k, 0.4% for AGIs $100k-200k)
Ordinary dividends: $908 (reported on 14.8% of returns)
Here:
$908
State:
$10,299
(% of AGI for various income ranges: 0.4% for AGIs below $25k, 0.3% for AGIs $25k-50k, 0.1% for AGIs $50k-75k, 0.6% for AGIs $100k-200k)
Net capital gain/loss in AGI: +$2,814 (reported on 8.0% of returns)
Here:
+$2,814
State:
+$42,474
Profit/loss from business: +$2,683 (reported on 13.6% of returns)
Here:
+$2,683
State:
+$16,168
(% of AGI for various income ranges: 4.9% for AGIs below $25k, 3.6% for AGIs $25k-50k)
Taxable individual retirement arrangement distribution: $10,038 (reported on 9.1% of returns)
12928:
$10,038
New York:
$17,621
(% of AGI for various income ranges: 1.9% for AGIs below $25k, 5.1% for AGIs $25k-50k, 4.5% for AGIs $75k-100k)
Total itemized deductions: $16,422 (20% of AGI, reported on 20.5% of returns)
Here:
$16,422
State:
$34,985
Here:
20.4% of AGI
State:
21.3% of AGI
(% of AGI for various income ranges: 9.2% for AGIs $25k-50k, 7.5% for AGIs $50k-75k, 6.7% for AGIs $75k-100k, 9.4% for AGIs $100k-200k)
Charity contributions: $2,282 (reported on 12.5% of returns)
Here:
$2,282
State:
$5,572
(% of AGI for various income ranges: 1.0% for AGIs below $25k, 1.3% for AGIs $50k-75k, 0.8% for AGIs $100k-200k)
Taxes paid: $7,822 (reported on 20.5% of returns)
12928:
$7,822
State:
$18,656
(% of AGI for various income ranges: 3.0% for AGIs $25k-50k, 3.0% for AGIs $50k-75k, 2.9% for AGIs $75k-100k, 6.1% for AGIs $100k-200k)
Earned income credit: $2,127 (reported on 17.0% of returns)
Here:
$2,127
State:
$2,230
(% of AGI for various income ranges: 5.5% for AGIs below $25k, 1.0% for AGIs $25k-50k)
Percentage of individuals using paid preparers for their 2012 taxes: 64.8%
Here:
65%
State:
66%
(% for various income ranges: 57.1% for AGIs below $25k, 66.7% for AGIs $25k-50k, 68.8% for AGIs $50k-75k, 75.0% for AGIs $75k-100k, 75.0% for AGIs $100k-200k)
Averages for the 2004 tax year for zip code 12928, filed in 2005:
Average Adjusted Gross Income (AGI) in 2004: $36,608 (Individual Income Tax Returns)
Here:
$36,608
State:
$59,519
Salary/wage: $33,938 (reported on 85.4% of returns)
Here:
$33,938
State:
$50,673
(% of AGI for various income ranges: 95.2% for AGIs below $10k, 68.7% for AGIs $10k-25k, 82.1% for AGIs $25k-50k, 87.5% for AGIs $50k-75k, 84.5% for AGIs $75k-100k, 67.1% for AGIs over 100k)
Taxable interest for individuals: $861 (reported on 40.8% of returns)
This zip code:
$861
New York:
$2,377
(% of AGI for various income ranges: 5.0% for AGIs below $10k, 2.4% for AGIs $10k-25k, 0.9% for AGIs $25k-50k, 0.4% for AGIs $50k-75k, 0.5% for AGIs $75k-100k, 0.7% for AGIs over 100k)
Taxable dividends: $1,106 (reported on 17.4% of returns)
Here:
$1,106
State:
$5,394
(% of AGI for various income ranges: 1.3% for AGIs below $10k, 0.7% for AGIs $10k-25k, 0.4% for AGIs $25k-50k, 0.1% for AGIs $50k-75k, 0.3% for AGIs $75k-100k, 1.2% for AGIs over 100k)
Net capital gain/loss: +$6,200 (reported on 9.2% of returns)
Here:
+$6,200
State:
+$23,581
(% of AGI for various income ranges: -0.6% for AGIs $10k-25k, 0.2% for AGIs $25k-50k, -0.0% for AGIs $50k-75k, 7.5% for AGIs over 100k)
Profit/loss from business: +$4,748 (reported on 11.6% of returns)
Here:
+$4,748
State:
+$13,809
(% of AGI for various income ranges: -16.9% for AGIs below $10k, 7.5% for AGIs $10k-25k, 0.8% for AGIs $25k-50k, 0.2% for AGIs $50k-75k, 6.6% for AGIs $75k-100k)
Total itemized deductions: $14,611 (18% of AGI, reported on 18.2% of returns)
Here:
$14,611
State:
$25,864
Here:
18.1% of AGI
State:
21.9% of AGI
(% of AGI for various income ranges: 4.3% for AGIs $10k-25k, 8.0% for AGIs $25k-50k, 6.5% for AGIs $50k-75k, 9.6% for AGIs $75k-100k, 8.4% for AGIs over 100k)
Charity contributions deductions: $2,046 (3% of AGI, reported on 16.5% of returns)
Here:
$2,046
State:
$4,439
Here:
2.6% of AGI
State:
3.6% of AGI
(% of AGI for various income ranges: 0.3% for AGIs $10k-25k, 0.8% for AGIs $25k-50k, 1.0% for AGIs $50k-75k, 1.3% for AGIs $75k-100k, 1.2% for AGIs over 100k)
Total tax: $4,991 (reported on 73.3% of returns)
12928:
$4,991
State:
$11,730
(% of AGI for various income ranges: 3.3% for AGIs below $10k, 4.3% for AGIs $10k-25k, 6.8% for AGIs $25k-50k, 8.0% for AGIs $50k-75k, 10.0% for AGIs $75k-100k, 20.4% for AGIs over 100k)
Earned income credit: $1,696 (reported on 18.3% of returns)
Here:
$1,696
State:
$1,757
Percentage of individuals using paid preparers for their 2004 taxes: 66.3%
Here:
66%
State:
67%
(% for various income ranges: 50.5% for AGIs below $10k, 70.2% for AGIs $10k-25k, 74.7% for AGIs $25k-50k, 64.7% for AGIs $50k-75k, 66.7% for AGIs $75k-100k, 78.8% for AGIs over 100k)
Household received Food Stamps/SNAP in the past 12 months: 107 Household did not receive Food Stamps/SNAP in the past 12 months: 701
Women who had a birth in the past 12 months: 31 (22 now married, 9 unmarried) Women who did not have a birth in the past 12 months: 313 (154 now married, 157 unmarried)
Housing units in zip code 12928 with a mortgage: 373 (31 second mortgage, 32 both second mortgage and home equity loan) Median monthly owner costs for units with a mortgage: $1,478 Median monthly owner costs for units without a mortgage: $456
Residents with income below the poverty level in 2022:
This zip code:
6.8%
Whole state:
14.3%
Residents with income below 50% of the poverty level in 2022:
This zip code:
4.0%
Whole state:
6.8%
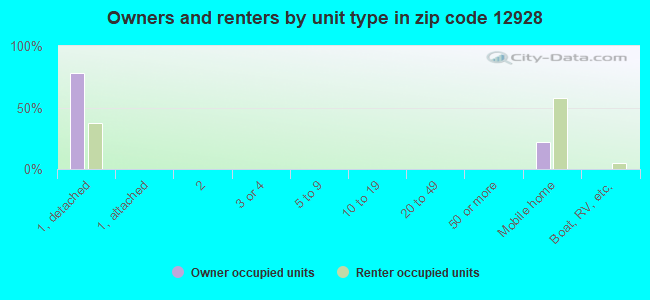
Median number of rooms in houses and condos:
Here:
5.9
State:
6.3
Median number of rooms in apartments:
Here:
4.8
State:
3.8
Notable locations in this zip code not listed on our city pages
Notable locations in zip code 12928: Fort Saint Frederic Ruins (A), Fort Crown Point Ruins (B), Crown Point Light (C), Hammond Library of Crown Point (D), Penfield Homestead Museum (E), Crown Point Fire Department (F). Display/hide their locations on the map
Churches in zip code 12928 include: White Church (A), Crown Point Bible Church (B), First Congregational Church (C), Sacred Heart Church (D). Display/hide their locations on the map
In group quarters: 19 (-1 institutionalized population)
Size of family households: 312 2-persons, 108 3-persons, 98 4-persons, 52 5-persons, 8 6-persons, 4 7-or-more-persons
Size of nonfamily households: 205 1-person, 18 2-persons
209 married couples with children.
49 single-parent households (37 men, 12 women).
95.3% of residents of 12928 zip code speak English at home.
2.9% of residents speak Spanish at home (98% very well, 2% not well).
2.1% of residents speak other Indo-European language at home (100% very well).
0.1% of residents speak other language at home (100% very well).
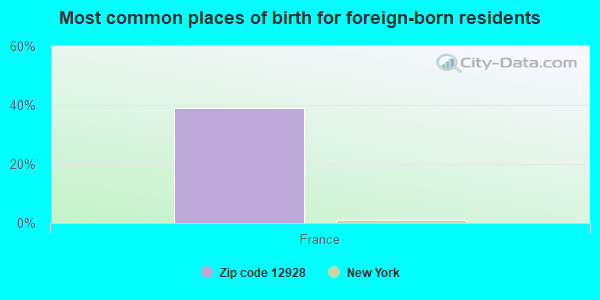
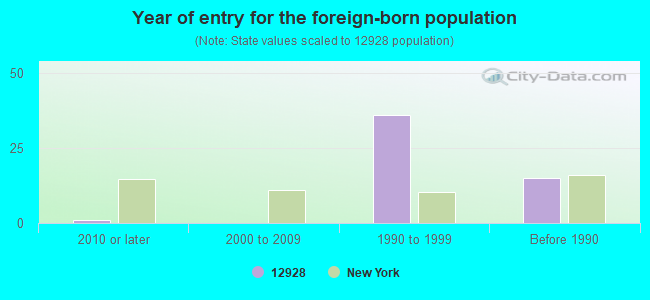
Foreign born population: 18 (1.0%) (74.7% of them are naturalized citizens)
This zip code:
1.0%
Whole state:
22.7%
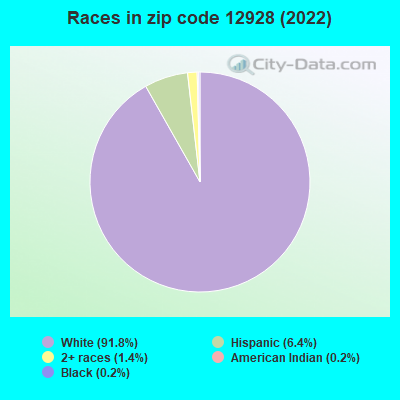
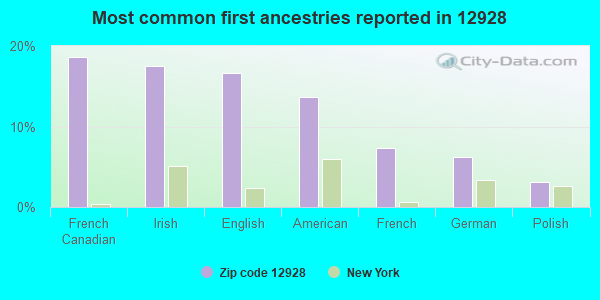
39%France
19%French Canadian
18%Irish
17%English
14%American
7%French
6%German
3%Polish
Year of entry for the foreign-born population
12010 or later
02000 to 2009
361990 to 1999
15Before 1990
Facilities with environmental interests located in this zip code:
CROWN POINT CENTRAL SCHOOL DISTRICT (35 MAIN STREET in CROWN POINT, NY)
COMPLIANCE ACTIVITY (Tracking inspections of insecticide, fungicide, and rodenticide, and toxic substances) Conditionally Exempt Small Quantity Generators, less than 100 kg/month of hazardous waste (Resource Conservation and Recovery Act (tracking hazardous waste)) - notification HAZARDOUS WASTE BIENNIAL REPORTER (Resource Conservation and Recovery Act (tracking hazardous waste)) (Resource Conservation and Recovery Act (tracking hazardous waste)) Alternative names: CROWN POINT SUBSTATION
CROWN POINT CENTRAL SCHOOL ( in CROWN POINT, NY)
(National Center for Education Statistics) - STATE ID-150203040001 Organizations: CROWN POINT CSD (SCHOOL DISTRICT)
CROWN POINT SD#1 WWTF (FURNACE ROAD in CROWN POINT, NY)
National Pollutant Discharge Elimination System NON-MAJOR (Tracking pollutant discharge elimination systems) - permit Business SIC classification: SEWERAGE SYSTEMS
CROWN POINT CITGO (RTE 9 MAIN ST in CROWN POINT, NY)
Conditionally Exempt Small Quantity Generators, less than 100 kg/month of hazardous waste (Resource Conservation and Recovery Act (tracking hazardous waste)) - notification Organizations: SHERMAN V ALLEN JR (CONTACT/OWNER)
AFE INDUSTRIES (15 RAILROAD AVE in CROWN POINT, NY)
ENFORCEMENT/COMPLIANCE ACTIVITY (Integrated Compliance Information System)
Housing units lacking complete plumbing facilities: 2.6% Housing units lacking complete kitchen facilities: 5.6%
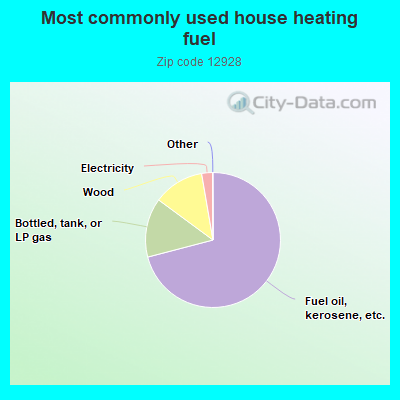
71.0%Fuel oil, kerosene, etc.
14.2%Bottled, tank, or LP gas
12.2%Wood
2.6%Electricity
Population in 1990: 1,963. Population change in the 1990s: +159 (+8.1%).
Place of birth for U.S.-born residents:
This state: 1,119
Northeast: 552
Midwest: 25
South: 42
West: 42
70% of the 12928 zip code residents lived in the same house 5 years ago. Out of people who lived in different houses, 67% lived in this county. Out of people who lived in different counties, 50% lived in New York.
95% of the 12928 zip code residents lived in the same house 1 year ago. Out of people who lived in different houses, 71% moved from this county. Out of people who lived in different houses, 17% moved from different state. Out of people who lived in different houses, 8% moved from abroad.
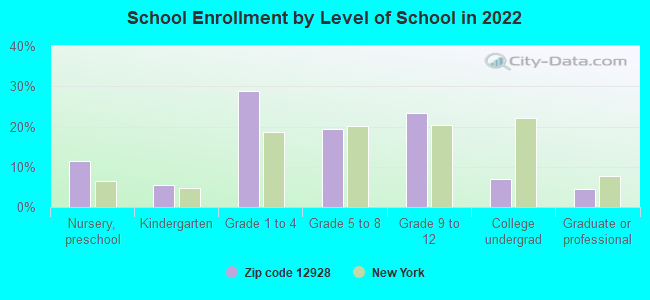
Private vs. public school enrollment:
Students in private schools in grades 1 to 8 (elementary and middle school): 11
Here:
6.7%
New York:
15.6%
Students in private schools in grades 9 to 12 (high school):
Here:
0.0%
New York:
15.0%
Students in private undergraduate colleges: 18
Here:
74.6%
New York:
39.2%
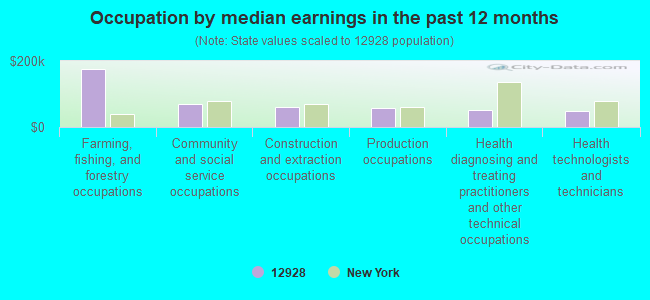
Occupation by median earnings in the past 12 months ($)
174,947Farming, fishing, and forestry occupations
69,817Community and social service occupations
61,929Construction and extraction occupations
58,918Production occupations
51,108Health diagnosing and treating practitioners and other technical occupations
49,570Health technologists and technicians
Top industries in this zip code by the number of employees in 2005:
Health Care and Social Assistance: Residential Mental Retardation Facilities (20-49 employees: 1 establishment, 1-4 employees: 1 establishment)
2 people in agriculture workers' dormitories on farms
Fatal accident statistics in 2011:
Fatal accident count: 1
Vehicles involved in fatal accidents: 1
Fatal accidents caused by drunken drivers: 1
Fatalities: 2
Persons involved in fatal accidents: 4
Pedestrians involved in fatal accidents: 0
2002 - 2018 National Fire Incident Reporting System (NFIRS) incidents
Based on the data from the years 2002 - 2018 the average number of fire incidents per year is 8. The highest number of fire incidents - 22 took place in 2018, and the least - 1 in 2003. The data has a rising trend.
When looking into fire subcategories, the most incidents belonged to: Structure Fires (45.1%), and Outside Fires (36.8%).
Fire incident types reported to NFIRS in Zip Code 12928
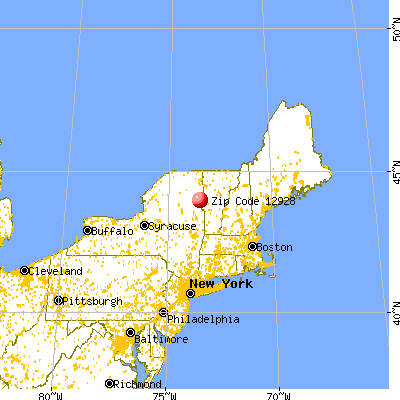


 Nearest zip codes: 12960, 12961, 12858, 12998, 12883, 12974.
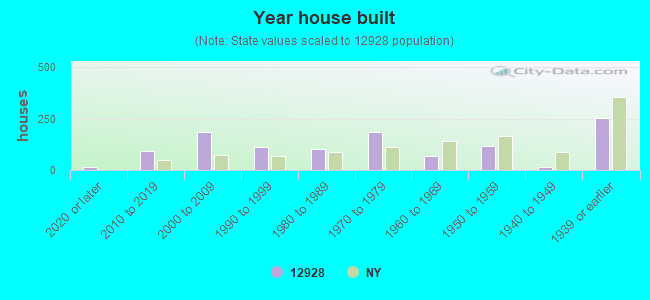


 Based on the data from the years 2002 - 2018 the average number of fire incidents per year is 8. The highest number of fire incidents - 22 took place in 2018, and the least - 1 in 2003. The data has a rising trend.
 When looking into fire subcategories, the most incidents belonged to: Structure Fires (45.1%), and Outside Fires (36.8%).