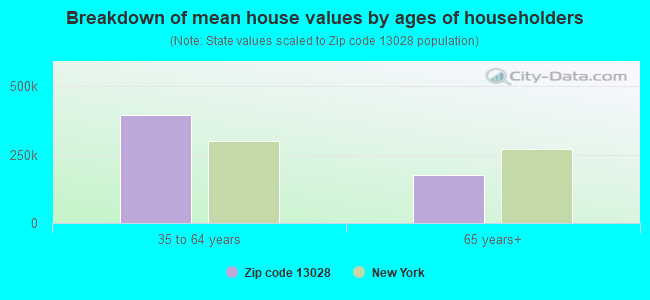
Estimated median house/condo value in 2022: $160,014
13028:
$160,014
New York:
$400,400
According to our research of New York and other state lists, there were 2 registered sex offenders living in 13028 zip code as of April 19, 2024. The ratio of all residents to sex offenders in zip code 13028 is 817 to 1. The ratio of registered sex offenders to all residents in this zip code is near the state average.
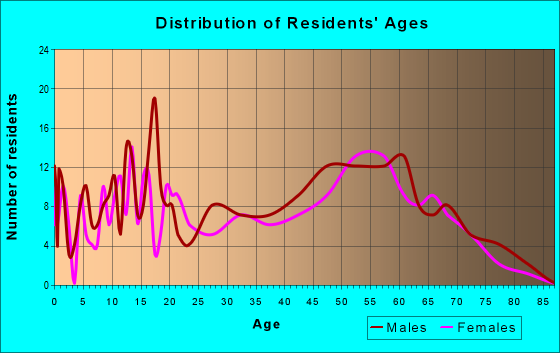
Median resident age:
This zip code:
47.7 years
New York median age:
40.0 years
Average household size:
This zip code:
2.5 people
New York:
2.5 people
Averages for the 2020 tax year for zip code 13028, filed in 2021:
Average Adjusted Gross Income (AGI) in 2020: $55,461 (Individual Income Tax Returns)
Here:
$55,461
State:
$90,930
Salary/wage: $50,181 (reported on 78.7% of returns)
Here:
$50,181
State:
$72,104
(% of AGI for various income ranges: 1091.5% for AGIs below $25k, 3161.7% for AGIs $25k-50k, 5001.1% for AGIs $50k-75k, 8604.0% for AGIs $75k-100k, 16785.0% for AGIs $100k-200k)
Taxable interest for individuals: $439 (reported on 29.5% of returns)
This zip code:
$439
New York:
$3,075
(% of AGI for various income ranges: 1.5% for AGIs below $25k, 5.8% for AGIs $25k-50k, 23.3% for AGIs $50k-75k, 74.0% for AGIs $75k-100k, 20.0% for AGIs $100k-200k)
Ordinary dividends: $1,455 (reported on 18.0% of returns)
Here:
$1,455
State:
$11,095
(% of AGI for various income ranges: 55.0% for AGIs $25k-50k, 84.4% for AGIs $50k-75k, 30.0% for AGIs $100k-200k)
Net capital gain/loss in AGI: +$900 (reported on 11.5% of returns)
Here:
+$900
State:
+$44,925
(% of AGI for various income ranges: 26.7% for AGIs $25k-50k, 62.0% for AGIs $75k-100k)
Profit/loss from business: +$4,133 (reported on 9.8% of returns)
Here:
+$4,133
State:
+$14,940
(% of AGI for various income ranges: 188.3% for AGIs $25k-50k, 44.0% for AGIs $75k-100k)
Taxable individual retirement arrangement distribution: $16,350 (reported on 9.8% of returns)
13028:
$16,350
New York:
$19,609
(% of AGI for various income ranges: 453.3% for AGIs $25k-50k, 874.0% for AGIs $75k-100k)
Earned income credit: $1,790 (reported on 16.4% of returns)
Here:
$1,790
State:
$2,138
(% of AGI for various income ranges: 76.2% for AGIs below $25k, 66.7% for AGIs $25k-50k)
Percentage of individuals using paid preparers for their 2020 taxes: 95.1%
Here:
95%
State:
95%
(% for various income ranges: 94.4% for AGIs below $25k, 93.8% for AGIs $25k-50k, 90.9% for AGIs $50k-75k, 100.0% for AGIs $75k-100k, 100.0% for AGIs $100k-200k)
Averages for the 2012 tax year for zip code 13028, filed in 2013:
Average Adjusted Gross Income (AGI) in 2012: $46,536 (Individual Income Tax Returns)
Here:
$46,536
State:
$77,088
Salary/wage: $41,488 (reported on 82.8% of returns)
Here:
$41,488
State:
$60,593
(% of AGI for various income ranges: 69.8% for AGIs below $25k, 71.7% for AGIs $25k-50k, 75.7% for AGIs $50k-75k, 74.7% for AGIs $75k-100k, 74.5% for AGIs $100k-200k)
Taxable interest for individuals: $400 (reported on 36.2% of returns)
This zip code:
$400
New York:
$3,125
(% of AGI for various income ranges: 0.9% for AGIs below $25k, 0.2% for AGIs $25k-50k, 0.2% for AGIs $50k-75k, 0.6% for AGIs $75k-100k)
Ordinary dividends: $1,311 (reported on 15.5% of returns)
Here:
$1,311
State:
$10,299
(% of AGI for various income ranges: 0.9% for AGIs $25k-50k, 0.6% for AGIs $50k-75k, 0.4% for AGIs $100k-200k)
Profit/loss from business: +$4,500 (reported on 10.3% of returns)
Here:
+$4,500
State:
+$16,168
Taxable individual retirement arrangement distribution: $9,443 (reported on 12.1% of returns)
13028:
$9,443
New York:
$17,621
Total itemized deductions: $18,011 (23% of AGI, reported on 31.0% of returns)
Here:
$18,011
State:
$34,985
Here:
22.6% of AGI
State:
21.3% of AGI
(% of AGI for various income ranges: 12.9% for AGIs $25k-50k, 10.1% for AGIs $50k-75k, 14.7% for AGIs $75k-100k, 15.7% for AGIs $100k-200k)
Charity contributions: $2,043 (reported on 24.1% of returns)
Here:
$2,043
State:
$5,572
(% of AGI for various income ranges: 1.3% for AGIs $25k-50k, 0.5% for AGIs $50k-75k, 1.9% for AGIs $75k-100k, 1.2% for AGIs $100k-200k)
Taxes paid: $8,594 (reported on 31.0% of returns)
13028:
$8,594
State:
$18,656
(% of AGI for various income ranges: 4.9% for AGIs $25k-50k, 3.9% for AGIs $50k-75k, 6.7% for AGIs $75k-100k, 9.2% for AGIs $100k-200k)
Earned income credit: $2,173 (reported on 19.0% of returns)
Here:
$2,173
State:
$2,230
(% of AGI for various income ranges: 5.5% for AGIs below $25k, 1.5% for AGIs $25k-50k)
Percentage of individuals using paid preparers for their 2012 taxes: 53.4%
Here:
53%
State:
66%
(% for various income ranges: 47.8% for AGIs below $25k, 57.1% for AGIs $25k-50k, 60.0% for AGIs $50k-75k, 50.0% for AGIs $75k-100k, 60.0% for AGIs $100k-200k)
Averages for the 2004 tax year for zip code 13028, filed in 2005:
Average Adjusted Gross Income (AGI) in 2004: $36,596 (Individual Income Tax Returns)
Here:
$36,596
State:
$59,519
Salary/wage: $33,890 (reported on 87.3% of returns)
Here:
$33,890
State:
$50,673
(% of AGI for various income ranges: 102.3% for AGIs below $10k, 78.1% for AGIs $10k-25k, 86.1% for AGIs $25k-50k, 83.1% for AGIs $50k-75k, 83.2% for AGIs $75k-100k, 66.8% for AGIs over 100k)
Taxable interest for individuals: $635 (reported on 42.5% of returns)
This zip code:
$635
New York:
$2,377
(% of AGI for various income ranges: 5.2% for AGIs below $10k, 1.5% for AGIs $10k-25k, 0.4% for AGIs $25k-50k, 0.8% for AGIs $50k-75k, 0.3% for AGIs $75k-100k, 0.6% for AGIs over 100k)
Taxable dividends: $810 (reported on 18.3% of returns)
Here:
$810
State:
$5,394
(% of AGI for various income ranges: 2.0% for AGIs below $10k, 0.9% for AGIs $10k-25k, 0.4% for AGIs $25k-50k, 0.4% for AGIs $50k-75k, 0.3% for AGIs $75k-100k)
Net capital gain/loss: +$375 (reported on 11.1% of returns)
Here:
+$375
State:
+$23,581
(% of AGI for various income ranges: 0.4% for AGIs $10k-25k, -0.2% for AGIs $25k-50k, -0.2% for AGIs $50k-75k, 1.0% for AGIs $75k-100k)
Total itemized deductions: $16,600 (23% of AGI, reported on 24.4% of returns)
Here:
$16,600
State:
$25,864
Here:
23.3% of AGI
State:
21.9% of AGI
(% of AGI for various income ranges: 9.9% for AGIs $25k-50k, 12.3% for AGIs $50k-75k, 14.9% for AGIs $75k-100k, 16.3% for AGIs over 100k)
Charity contributions deductions: $2,008 (3% of AGI, reported on 22.5% of returns)
Here:
$2,008
State:
$4,439
Here:
2.8% of AGI
State:
3.6% of AGI
(% of AGI for various income ranges: 1.1% for AGIs $25k-50k, 1.2% for AGIs $50k-75k, 1.9% for AGIs $75k-100k, 1.8% for AGIs over 100k)
Total tax: $4,336 (reported on 73.7% of returns)
13028:
$4,336
State:
$11,730
(% of AGI for various income ranges: 4.5% for AGIs below $10k, 3.7% for AGIs $10k-25k, 6.1% for AGIs $25k-50k, 8.6% for AGIs $50k-75k, 9.8% for AGIs $75k-100k, 15.7% for AGIs over 100k)
Earned income credit: $1,783 (reported on 16.0% of returns)
Here:
$1,783
State:
$1,757
Percentage of individuals using paid preparers for their 2004 taxes: 55.7%
Here:
56%
State:
67%
(% for various income ranges: 42.9% for AGIs below $10k, 52.1% for AGIs $10k-25k, 60.0% for AGIs $25k-50k, 61.3% for AGIs $50k-75k, 73.8% for AGIs $75k-100k, 68.0% for AGIs over 100k)
Household received Food Stamps/SNAP in the past 12 months: 24 Household did not receive Food Stamps/SNAP in the past 12 months: 287
Women who did not have a birth in the past 12 months: 154 (83 now married, 69 unmarried)
Housing units in zip code 13028 with a mortgage: 205 (6 second mortgage, 6 both second mortgage and home equity loan) Median monthly owner costs for units with a mortgage: $1,330 Median monthly owner costs for units without a mortgage: $969
Residents with income below the poverty level in 2022:
This zip code:
1.9%
Whole state:
14.3%
Residents with income below 50% of the poverty level in 2022:
This zip code:
0.4%
Whole state:
6.8%
Median number of rooms in houses and condos:
Here:
6.0
State:
6.3
Notable locations in this zip code not listed on our city pages
Churches in zip code 13028 include: Constantia Center Independent Baptist Church (A), Bernhards Bay Methodist Church (B). Display/hide their locations on the map
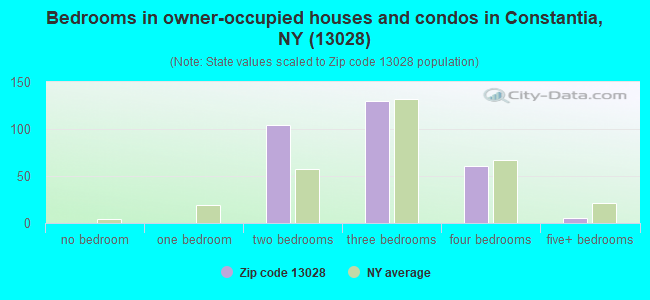
Size of family households: 93 2-persons, 91 3-persons, 39 4-persons, 13 5-persons
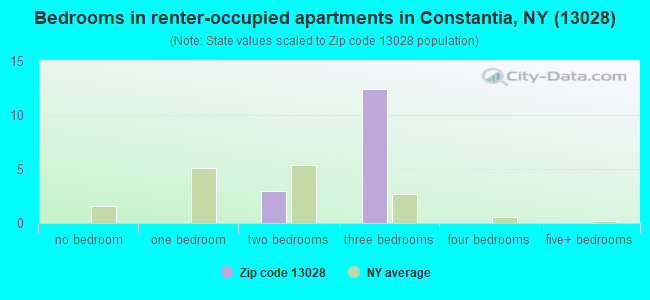
Size of nonfamily households: 66 1-person, 3 2-persons, 5 4-persons
70 married couples with children.
27 single-parent households (27 women).
All residents speak English at home
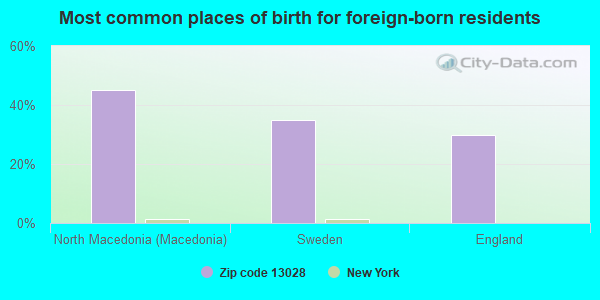
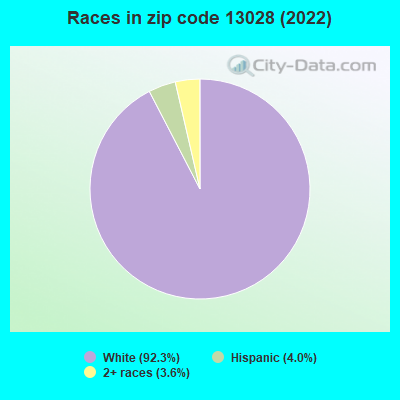
Foreign born population: 21 (2.7%) (100.0% of them are naturalized citizens)
This zip code:
2.7%
Whole state:
22.7%
45%North Macedonia (Macedonia)
35%Sweden
30%England
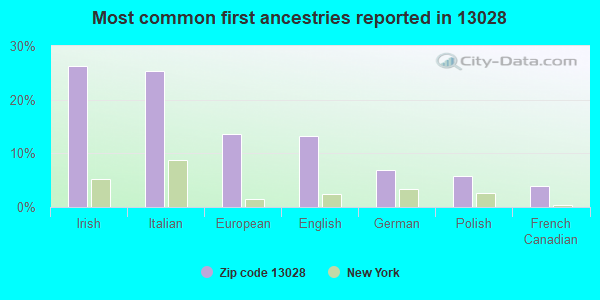
26%Irish
25%Italian
14%European
13%English
7%German
6%Polish
4%French Canadian
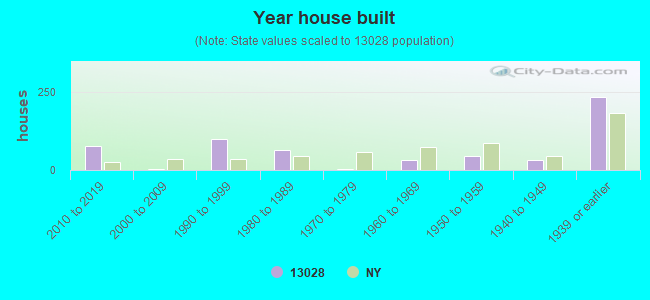
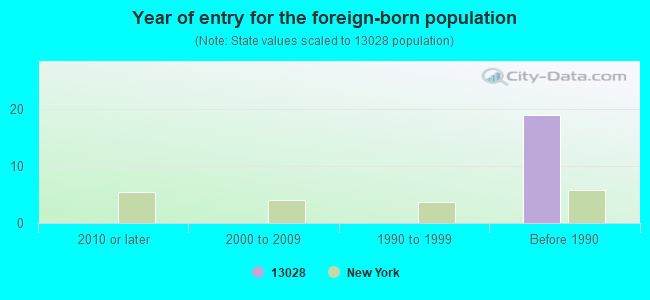
Year of entry for the foreign-born population
02010 or later
02000 to 2009
01990 to 1999
19Before 1990
Facilities with environmental interests located in this zip code:
BERNHARDS BAY VENEER (KELLAR DRIVE in BERNHARDS BAY, NY)
STATE MASTER (New York facility tracking) - AIR PROGRAM, CRITERIA AND HAZARDOUS AIR POLLUTANT INVENTORY (Inventory of air pollution sources) Business SIC classification: SAWMILLS AND PLANING MILLS, GENERAL Organizations: RUTLAND PLYWOOD CORP (LEGALLY RESPONSIBLE PARTY)
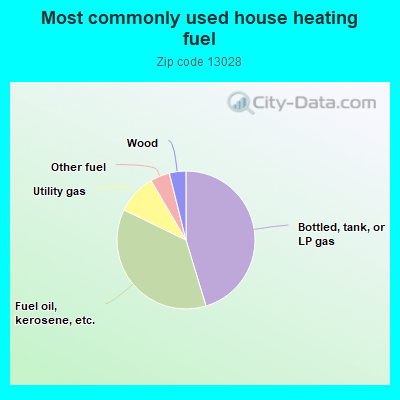
45.6%Bottled, tank, or LP gas
37.1%Fuel oil, kerosene, etc.
9.4%Utility gas
4.6%Other fuel
3.9%Wood
Population in 1990: 1,228. Population change in the 1990s: +152 (+12.4%).
Place of birth for U.S.-born residents:
This state: 663
Northeast: 17
South: 88
70% of the 13028 zip code residents lived in the same house 5 years ago. Out of people who lived in different houses, 66% lived in this county.
97% of the 13028 zip code residents lived in the same house 1 year ago. Out of people who lived in different houses, 25% moved from this county. Out of people who lived in different houses, 70% moved from different county within same state.
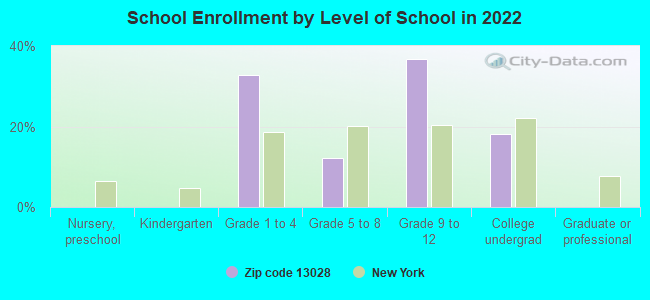
Private vs. public school enrollment:
Students in private schools in grades 1 to 8 (elementary and middle school):
Here:
0.0%
New York:
15.6%
Students in private schools in grades 9 to 12 (high school):
Here:
0.0%
New York:
15.0%
Students in private undergraduate colleges: 32
Here:
100.0%
New York:
39.2%
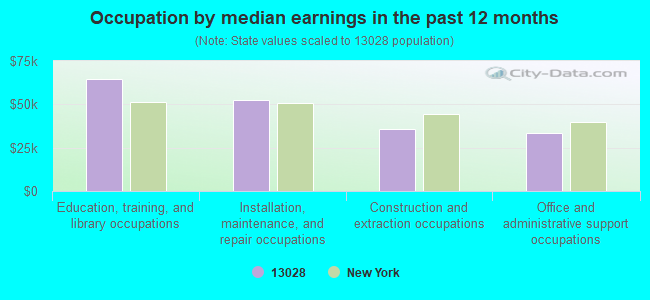
Occupation by median earnings in the past 12 months ($)
64,586Education, training, and library occupations
52,693Installation, maintenance, and repair occupations
35,520Construction and extraction occupations
33,255Office and administrative support occupations
Top industries in this zip code by the number of employees in 2005:
Construction: Commercial and Institutional Building Construction (10-19 employees: 1 establishment)
Accommodation and Food Services: Full-Service Restaurants (5-9: 1)
Health Care and Social Assistance: Offices of Physicians (except Mental Health Specialists) (1-4: 2)
Construction: Electrical Contractors (1-4: 1)
Other Services (except Public Administration): Automotive Body, Paint, and Interior Repair and Maintenance (1-4: 1)
Construction: Site Preparation Contractors (1-4: 1)
Other Services (except Public Administration): Religious Organizations (1-4: 1)
Construction: Poured Concrete Foundation and Structure Contractors (1-4: 1)
Fatal accident statistics in 2014:
Fatal accident count: 1
Vehicles involved in fatal accidents: 1
Fatal accidents caused by drunken drivers: 1
Fatalities: 1
Persons involved in fatal accidents: 1
Pedestrians involved in fatal accidents: 0
Fatal accident statistics in 2012:
Fatal accident count: 1
Vehicles involved in fatal accidents: 1
Fatal accidents caused by drunken drivers: 0
Fatalities: 1
Persons involved in fatal accidents: 1
Pedestrians involved in fatal accidents: 0
Home Mortgage Disclosure Act Aggregated Statistics For Year 2009 (Based on 2 partial tracts)
A) FHA, FSA/RHS & VA Home Purchase Loans
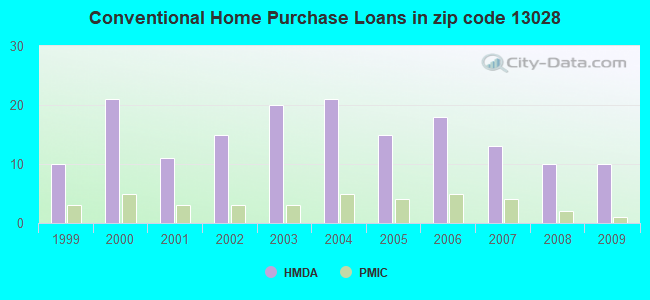
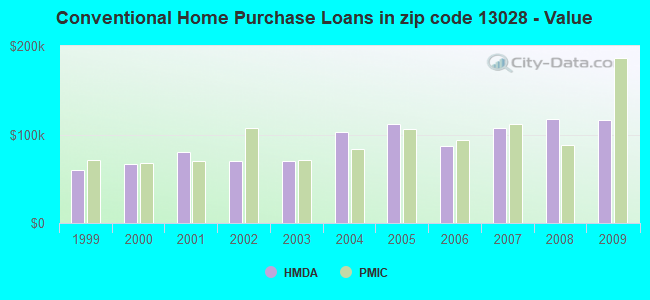
B) Conventional Home Purchase Loans
C) Refinancings
D) Home Improvement Loans
F) Non-occupant Loans on < 5 Family Dwellings (A B C & D)
G) Loans On Manufactured Home Dwelling (A B C & D)
Number
Average Value
Number
Average Value
Number
Average Value
Number
Average Value
Number
Average Value
Number
Average Value
LOANS ORIGINATED
7
$92,200
10
$116,639
21
$109,390
10
$14,432
3
$129,640
4
$57,708
APPLICATIONS APPROVED, NOT ACCEPTED
0
$0
0
$0
3
$197,780
0
$0
0
$0
0
$0
APPLICATIONS DENIED
1
$58,570
2
$77,135
13
$106,301
3
$30,497
1
$77,330
1
$39,430
APPLICATIONS WITHDRAWN
0
$0
0
$0
8
$118,094
0
$0
1
$71,970
1
$73,500
FILES CLOSED FOR INCOMPLETENESS
0
$0
0
$0
2
$67,375
1
$12,630
0
$0
0
$0
Aggregated Statistics For Year 2008 (Based on 2 partial tracts)
A) FHA, FSA/RHS & VA Home Purchase Loans
B) Conventional Home Purchase Loans
C) Refinancings
D) Home Improvement Loans
F) Non-occupant Loans on < 5 Family Dwellings (A B C & D)
G) Loans On Manufactured Home Dwelling (A B C & D)
Number
Average Value
Number
Average Value
Number
Average Value
Number
Average Value
Number
Average Value
Number
Average Value
LOANS ORIGINATED
8
$80,866
10
$117,520
23
$100,127
13
$23,616
4
$106,515
4
$65,075
APPLICATIONS APPROVED, NOT ACCEPTED
0
$0
2
$83,835
5
$111,242
2
$92,640
0
$0
2
$42,300
APPLICATIONS DENIED
2
$62,395
3
$97,870
15
$87,508
11
$39,255
1
$90,720
5
$58,338
APPLICATIONS WITHDRAWN
0
$0
1
$46,700
9
$113,479
1
$60,480
1
$60,100
0
$0
FILES CLOSED FOR INCOMPLETENESS
0
$0
0
$0
2
$100,870
1
$54,360
0
$0
0
$0
Aggregated Statistics For Year 2007 (Based on 2 partial tracts)
A) FHA, FSA/RHS & VA Home Purchase Loans
B) Conventional Home Purchase Loans
C) Refinancings
D) Home Improvement Loans
F) Non-occupant Loans on < 5 Family Dwellings (A B C & D)
G) Loans On Manufactured Home Dwelling (A B C & D)
Number
Average Value
Number
Average Value
Number
Average Value
Number
Average Value
Number
Average Value
Number
Average Value
LOANS ORIGINATED
8
$108,332
13
$107,655
23
$98,430
11
$41,725
4
$145,178
3
$69,543
APPLICATIONS APPROVED, NOT ACCEPTED
0
$0
2
$92,065
4
$50,338
1
$38,280
1
$57,800
1
$91,870
APPLICATIONS DENIED
1
$69,290
7
$90,504
26
$115,650
11
$53,801
2
$82,110
5
$76,866
APPLICATIONS WITHDRAWN
1
$111,010
1
$107,950
12
$126,228
3
$35,727
2
$114,075
1
$24,880
FILES CLOSED FOR INCOMPLETENESS
0
$0
1
$98,000
3
$139,340
0
$0
0
$0
0
$0
Aggregated Statistics For Year 2006 (Based on 2 partial tracts)
A) FHA, FSA/RHS & VA Home Purchase Loans
B) Conventional Home Purchase Loans
C) Refinancings
D) Home Improvement Loans
F) Non-occupant Loans on < 5 Family Dwellings (A B C & D)
G) Loans On Manufactured Home Dwelling (A B C & D)
Number
Average Value
Number
Average Value
Number
Average Value
Number
Average Value
Number
Average Value
Number
Average Value
LOANS ORIGINATED
4
$89,575
18
$86,832
24
$90,771
13
$37,662
5
$90,570
5
$44,634
APPLICATIONS APPROVED, NOT ACCEPTED
0
$0
3
$91,617
4
$66,320
3
$19,777
1
$143,170
1
$58,950
APPLICATIONS DENIED
0
$0
7
$67,044
31
$103,850
13
$27,267
2
$63,545
4
$55,122
APPLICATIONS WITHDRAWN
0
$0
3
$61,887
16
$95,030
2
$59,910
1
$61,630
2
$40,960
FILES CLOSED FOR INCOMPLETENESS
0
$0
0
$0
3
$97,360
1
$26,800
0
$0
0
$0
Aggregated Statistics For Year 2005 (Based on 2 partial tracts)
A) FHA, FSA/RHS & VA Home Purchase Loans
B) Conventional Home Purchase Loans
C) Refinancings
D) Home Improvement Loans
F) Non-occupant Loans on < 5 Family Dwellings (A B C & D)
G) Loans On Manufactured Home Dwelling (A B C & D)
Number
Average Value
Number
Average Value
Number
Average Value
Number
Average Value
Number
Average Value
Number
Average Value
LOANS ORIGINATED
3
$103,483
15
$112,415
27
$79,438
18
$32,092
4
$48,902
3
$58,440
APPLICATIONS APPROVED, NOT ACCEPTED
0
$0
3
$54,740
6
$90,915
2
$43,450
1
$40,580
2
$51,870
APPLICATIONS DENIED
0
$0
7
$52,444
32
$93,188
8
$17,896
1
$95,700
6
$43,703
APPLICATIONS WITHDRAWN
0
$0
3
$97,740
19
$93,101
3
$149,803
1
$71,970
2
$51,105
FILES CLOSED FOR INCOMPLETENESS
0
$0
1
$64,690
8
$132,019
0
$0
0
$0
0
$0
Aggregated Statistics For Year 2004 (Based on 2 partial tracts)
A) FHA, FSA/RHS & VA Home Purchase Loans
B) Conventional Home Purchase Loans
C) Refinancings
D) Home Improvement Loans
F) Non-occupant Loans on < 5 Family Dwellings (A B C & D)
G) Loans On Manufactured Home Dwelling (A B C & D)
Number
Average Value
Number
Average Value
Number
Average Value
Number
Average Value
Number
Average Value
Number
Average Value
LOANS ORIGINATED
8
$81,776
21
$102,335
29
$88,348
8
$33,256
5
$91,566
3
$48,360
APPLICATIONS APPROVED, NOT ACCEPTED
1
$80,770
3
$115,097
6
$83,642
1
$39,050
1
$147,380
2
$57,420
APPLICATIONS DENIED
0
$0
5
$81,154
29
$69,657
8
$17,705
2
$85,940
5
$36,826
APPLICATIONS WITHDRAWN
0
$0
3
$67,500
20
$74,588
2
$11,865
1
$77,330
1
$80,390
FILES CLOSED FOR INCOMPLETENESS
0
$0
1
$125,180
3
$103,230
1
$96,470
0
$0
0
$0
Aggregated Statistics For Year 2003 (Based on 2 partial tracts)
A) FHA, FSA/RHS & VA Home Purchase Loans
B) Conventional Home Purchase Loans
C) Refinancings
D) Home Improvement Loans
F) Non-occupant Loans on < 5 Family Dwellings (A B C & D)
Number
Average Value
Number
Average Value
Number
Average Value
Number
Average Value
Number
Average Value
LOANS ORIGINATED
9
$85,322
20
$70,358
52
$75,588
5
$13,780
3
$89,193
APPLICATIONS APPROVED, NOT ACCEPTED
0
$0
2
$28,520
7
$68,850
0
$0
0
$0
APPLICATIONS DENIED
0
$0
6
$36,813
16
$65,076
4
$27,180
0
$0
APPLICATIONS WITHDRAWN
1
$50,150
3
$66,353
20
$79,144
2
$34,450
0
$0
FILES CLOSED FOR INCOMPLETENESS
0
$0
0
$0
3
$109,480
0
$0
0
$0
Aggregated Statistics For Year 2002 (Based on 2 partial tracts)
A) FHA, FSA/RHS & VA Home Purchase Loans
B) Conventional Home Purchase Loans
C) Refinancings
D) Home Improvement Loans
F) Non-occupant Loans on < 5 Family Dwellings (A B C & D)
Number
Average Value
Number
Average Value
Number
Average Value
Number
Average Value
Number
Average Value
LOANS ORIGINATED
5
$70,512
15
$70,282
44
$68,452
9
$23,819
4
$69,478
APPLICATIONS APPROVED, NOT ACCEPTED
0
$0
3
$67,117
8
$70,291
1
$13,780
0
$0
APPLICATIONS DENIED
1
$57,800
7
$60,100
25
$62,764
10
$14,776
2
$31,390
APPLICATIONS WITHDRAWN
2
$42,680
3
$69,923
17
$78,969
3
$20,543
0
$0
FILES CLOSED FOR INCOMPLETENESS
0
$0
0
$0
3
$56,783
0
$0
0
$0
Aggregated Statistics For Year 2001 (Based on 2 partial tracts)
A) FHA, FSA/RHS & VA Home Purchase Loans
B) Conventional Home Purchase Loans
C) Refinancings
D) Home Improvement Loans
F) Non-occupant Loans on < 5 Family Dwellings (A B C & D)
Number
Average Value
Number
Average Value
Number
Average Value
Number
Average Value
Number
Average Value
LOANS ORIGINATED
7
$52,224
11
$79,692
37
$62,303
13
$18,404
2
$30,240
APPLICATIONS APPROVED, NOT ACCEPTED
0
$0
3
$68,777
8
$50,960
3
$30,750
0
$0
APPLICATIONS DENIED
1
$47,080
12
$54,294
19
$59,878
10
$18,642
2
$67,180
APPLICATIONS WITHDRAWN
0
$0
1
$77,710
14
$64,639
3
$20,033
1
$27,180
FILES CLOSED FOR INCOMPLETENESS
0
$0
0
$0
2
$75,605
0
$0
0
$0
Aggregated Statistics For Year 2000 (Based on 2 partial tracts)
A) FHA, FSA/RHS & VA Home Purchase Loans
B) Conventional Home Purchase Loans
C) Refinancings
D) Home Improvement Loans
F) Non-occupant Loans on < 5 Family Dwellings (A B C & D)
Number
Average Value
Number
Average Value
Number
Average Value
Number
Average Value
Number
Average Value
LOANS ORIGINATED
6
$71,520
21
$67,136
16
$58,568
17
$16,371
1
$114,070
APPLICATIONS APPROVED, NOT ACCEPTED
0
$0
11
$54,496
6
$42,937
2
$14,355
1
$42,490
APPLICATIONS DENIED
0
$0
24
$45,665
19
$44,727
7
$17,554
3
$43,893
APPLICATIONS WITHDRAWN
0
$0
2
$71,010
10
$48,348
1
$6,890
1
$76,560
FILES CLOSED FOR INCOMPLETENESS
0
$0
0
$0
2
$29,095
0
$0
0
$0
Aggregated Statistics For Year 1999 (Based on 1 partial tract)
A) FHA, FSA/RHS & VA Home Purchase Loans
B) Conventional Home Purchase Loans
C) Refinancings
D) Home Improvement Loans
F) Non-occupant Loans on < 5 Family Dwellings (A B C & D)
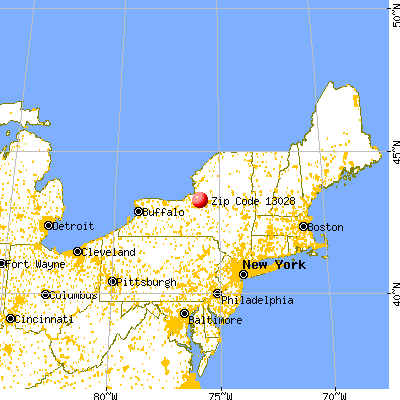


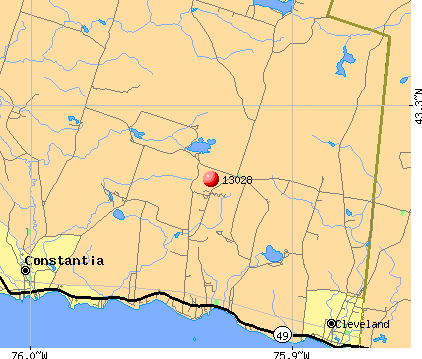 Nearest zip codes: 13044, 13042, 13167, 13493, 13483, 13030.