Estimated zip code population in 2022: 914 Zip code population in 2010: 1,281 Zip code population in 2000: 1,204
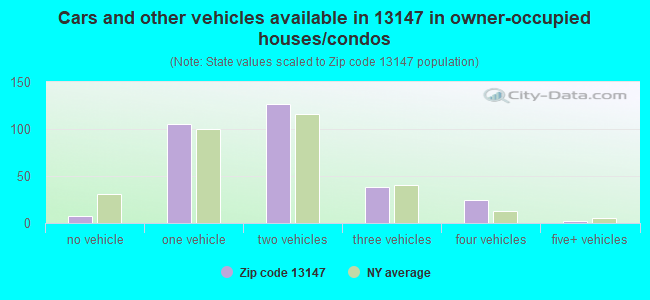
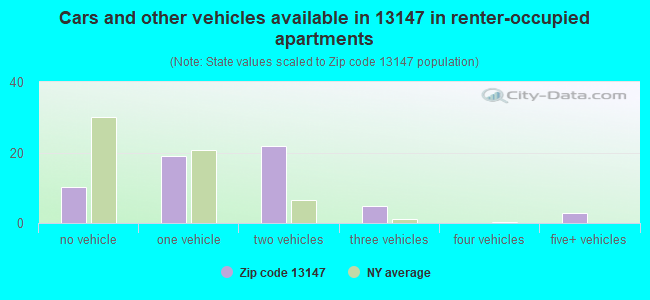
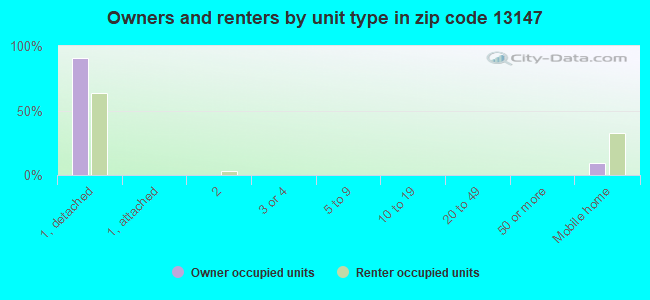
Houses and condos: 443 Renter-occupied apartments: 59
% of renters here:
16%
State:
46%
March 2022 cost of living index in zip code 13147: 94.2 (less than average, U.S. average is 100)
Land area: 35.9 sq. mi. Water area: 0.0 sq. mi.
Population density: 25 people per square mile
(very low).
OSM Map
General Map
Google Map
MSN Map
OSM Map
General Map
Google Map
MSN Map
OSM Map
General Map
Google Map
MSN Map
OSM Map
General Map
Google Map
MSN Map
Please wait while loading the map...
Real estate property taxes paid for housing units in 2022:
This zip code:
2.0% ($2,951)
New York:
1.5% ($6,180)
Median real estate property taxes paid for housing units with mortgages in 2022: $3,162 (2.1%) Median real estate property taxes paid for housing units with no mortgage in 2022: $2,705 (2.0%)
Business Search- 14 Million verified businesses
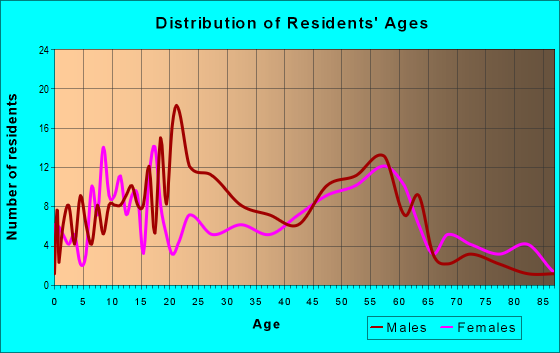
Males: 497
(54.4%)
Females: 417
(45.6%)
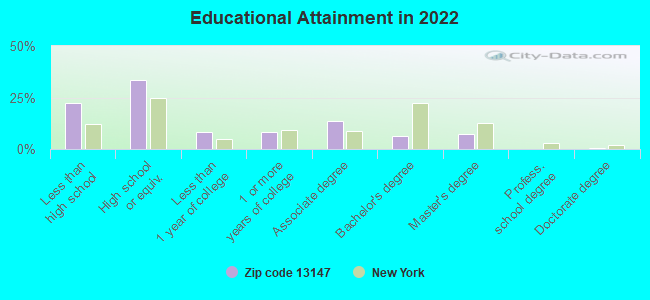
For population 25 years and over in 13147:
High school or higher: 75.9%
Bachelor's degree or higher: 14.1%
Graduate or professional degree: 8.0%
Unemployed: 1.7%
Mean travel time to work (commute): 22.9 minutes
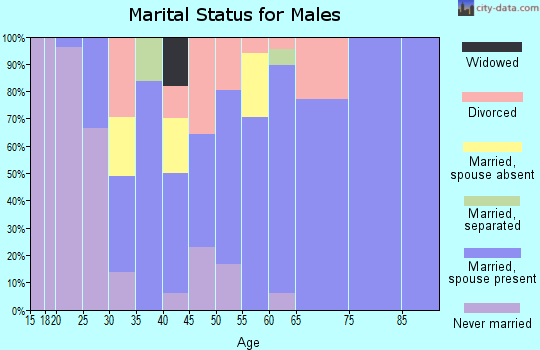
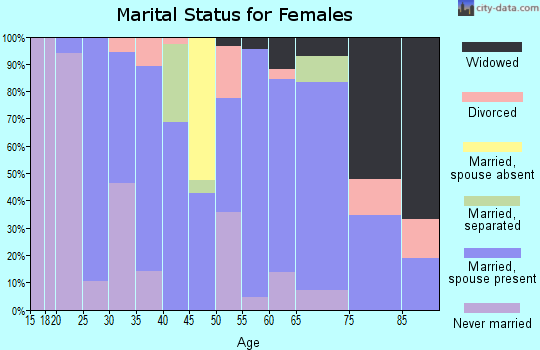
For population 15 years and over in 13147:
Never married: 34.0%
Now married: 46.3%
Separated: 1.9%
Widowed: 5.0%
Divorced: 12.8%
Zip code 13147 compared to state average:
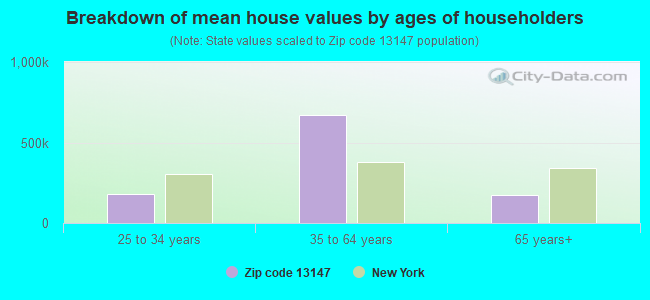
Median house value significantly below state average.
Unemployed percentage significantly below state average.
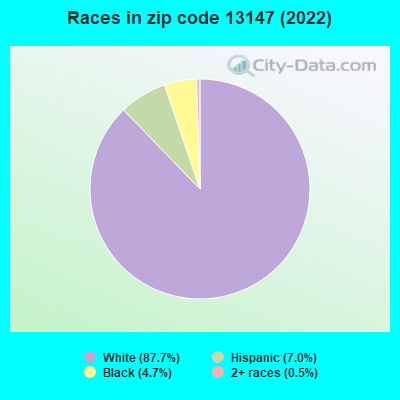
Black race population percentage significantly below state average.
Hispanic race population percentage below state average.
Foreign-born population percentage significantly below state average.
Renting percentage significantly below state average.
Number of rooms per house above state average.
Percentage of population with a bachelor's degree or higher significantly below state average.
Averages for the 2020 tax year for zip code 13147, filed in 2021:
Average Adjusted Gross Income (AGI) in 2020: $59,909 (Individual Income Tax Returns)
Here:
$59,909
State:
$90,930
Salary/wage: $50,881 (reported on 76.6% of returns)
Here:
$50,881
State:
$72,104
(% of AGI for various income ranges: 960.0% for AGIs below $25k, 3638.9% for AGIs $25k-50k, 7268.3% for AGIs $50k-75k, 9533.3% for AGIs $75k-100k, 23510.0% for AGIs $100k-200k)
Taxable interest for individuals: $1,139 (reported on 38.3% of returns)
This zip code:
$1,139
New York:
$3,075
(% of AGI for various income ranges: 3.8% for AGIs below $25k, 7.8% for AGIs $25k-50k, 13.3% for AGIs $50k-75k, 10.0% for AGIs $75k-100k, 613.3% for AGIs $100k-200k)
Ordinary dividends: $3,612 (reported on 17.0% of returns)
Here:
$3,612
State:
$11,095
(% of AGI for various income ranges: 71.2% for AGIs below $25k, 115.0% for AGIs $50k-75k, 543.3% for AGIs $100k-200k)
Net capital gain/loss in AGI: +$11,133 (reported on 12.8% of returns)
Here:
+$11,133
State:
+$44,925
(% of AGI for various income ranges: 163.3% for AGIs $25k-50k, 1736.7% for AGIs $100k-200k)
Profit/loss from business: +$11,800 (reported on 12.8% of returns)
Here:
+$11,800
State:
+$14,940
(% of AGI for various income ranges: 378.8% for AGIs below $25k, 1350.0% for AGIs $75k-100k)
Taxable individual retirement arrangement distribution: $6,833 (reported on 6.4% of returns)
13147:
$6,833
New York:
$19,609
(% of AGI for various income ranges: 341.7% for AGIs $50k-75k)
Earned income credit: $2,060 (reported on 10.6% of returns)
Here:
$2,060
State:
$2,138
(% of AGI for various income ranges: 76.2% for AGIs below $25k, 46.7% for AGIs $25k-50k)
Percentage of individuals using paid preparers for their 2020 taxes: 93.6%
Here:
94%
State:
95%
(% for various income ranges: 92.3% for AGIs below $25k, 100.0% for AGIs $25k-50k, 88.9% for AGIs $50k-75k, 100.0% for AGIs $75k-100k, 87.5% for AGIs $100k-200k)
Averages for the 2012 tax year for zip code 13147, filed in 2013:
Average Adjusted Gross Income (AGI) in 2012: $46,476 (Individual Income Tax Returns)
Here:
$46,476
State:
$77,088
Salary/wage: $38,989 (reported on 83.6% of returns)
Here:
$38,989
State:
$60,593
(% of AGI for various income ranges: 69.6% for AGIs below $25k, 81.0% for AGIs $25k-50k, 79.9% for AGIs $50k-75k, 75.8% for AGIs $75k-100k, 52.6% for AGIs $100k-200k)
Taxable interest for individuals: $843 (reported on 38.2% of returns)
This zip code:
$843
New York:
$3,125
(% of AGI for various income ranges: 1.0% for AGIs below $25k, 0.4% for AGIs $25k-50k, 0.1% for AGIs $50k-75k, 0.1% for AGIs $75k-100k, 1.5% for AGIs $100k-200k)
Ordinary dividends: $2,182 (reported on 20.0% of returns)
Here:
$2,182
State:
$10,299
(% of AGI for various income ranges: 1.5% for AGIs below $25k, 0.7% for AGIs $25k-50k, 0.3% for AGIs $50k-75k, 1.8% for AGIs $100k-200k)
Net capital gain/loss in AGI: +$22,567 (reported on 10.9% of returns)
Here:
+$22,567
State:
+$42,474
Profit/loss from business: +$8,438 (reported on 14.5% of returns)
Here:
+$8,438
State:
+$16,168
Taxable individual retirement arrangement distribution: $5,850 (reported on 7.3% of returns)
13147:
$5,850
New York:
$17,621
Total itemized deductions: $16,009 (18% of AGI, reported on 20.0% of returns)
Here:
$16,009
State:
$34,985
Here:
18.2% of AGI
State:
21.3% of AGI
(% of AGI for various income ranges: 12.1% for AGIs below $25k, 12.4% for AGIs $50k-75k, 8.6% for AGIs $100k-200k)
Charity contributions: $3,014 (reported on 12.7% of returns)
Here:
$3,014
State:
$5,572
Taxes paid: $8,070 (reported on 18.2% of returns)
13147:
$8,070
State:
$18,656
(% of AGI for various income ranges: 4.0% for AGIs below $25k, 4.7% for AGIs $50k-75k, 5.2% for AGIs $100k-200k)
Earned income credit: $2,138 (reported on 14.5% of returns)
Here:
$2,138
State:
$2,230
(% of AGI for various income ranges: 4.7% for AGIs below $25k, 0.7% for AGIs $25k-50k)
Percentage of individuals using paid preparers for their 2012 taxes: 61.8%
Here:
62%
State:
66%
(% for various income ranges: 52.4% for AGIs below $25k, 66.7% for AGIs $25k-50k, 70.0% for AGIs $50k-75k, 75.0% for AGIs $75k-100k, 60.0% for AGIs $100k-200k)
Averages for the 2004 tax year for zip code 13147, filed in 2005:
Average Adjusted Gross Income (AGI) in 2004: $36,759 (Individual Income Tax Returns)
Here:
$36,759
State:
$59,519
Salary/wage: $31,826 (reported on 86.1% of returns)
Here:
$31,826
State:
$50,673
(% of AGI for various income ranges: 168.5% for AGIs below $10k, 71.7% for AGIs $10k-25k, 83.3% for AGIs $25k-50k, 83.5% for AGIs $50k-75k, 82.9% for AGIs $75k-100k, 40.2% for AGIs over 100k)
Taxable interest for individuals: $761 (reported on 52.1% of returns)
This zip code:
$761
New York:
$2,377
(% of AGI for various income ranges: 8.3% for AGIs below $10k, 2.5% for AGIs $10k-25k, 0.8% for AGIs $25k-50k, 1.0% for AGIs $50k-75k, 0.3% for AGIs $75k-100k, 0.7% for AGIs over 100k)
Taxable dividends: $1,205 (reported on 24.1% of returns)
Here:
$1,205
State:
$5,394
(% of AGI for various income ranges: 5.1% for AGIs below $10k, 0.9% for AGIs $10k-25k, 1.1% for AGIs $25k-50k, 0.8% for AGIs $50k-75k, 0.6% for AGIs over 100k)
Net capital gain/loss: +$14,394 (reported on 18.1% of returns)
Here:
+$14,394
State:
+$23,581
(% of AGI for various income ranges: 0.6% for AGIs below $10k, 0.4% for AGIs $10k-25k, 1.5% for AGIs $25k-50k, 5.0% for AGIs $50k-75k, 25.6% for AGIs over 100k)
Profit/loss from business: +$5,540 (reported on 15.9% of returns)
Here:
+$5,540
State:
+$13,809
(% of AGI for various income ranges: 15.5% for AGIs below $10k, 8.1% for AGIs $10k-25k, 2.9% for AGIs $25k-50k, 1.7% for AGIs $50k-75k)
Profit/loss from farming: +$3,439 (reported on 7.5% of returns)
Here:
+$3,439
State:
-$2,666
(% of AGI for various income ranges: 3.7% for AGIs $10k-25k, 0.0% for AGIs $50k-75k, 2.1% for AGIs $75k-100k)
IRA payment deduction: $2,688 (reported on 2.9% of returns)
13147:
$2,688
New York:
$3,115
Total itemized deductions: $14,670 (19% of AGI, reported on 18.3% of returns)
Here:
$14,670
State:
$25,864
Here:
19.2% of AGI
State:
21.9% of AGI
(% of AGI for various income ranges: 36.6% for AGIs below $10k, 5.9% for AGIs $25k-50k, 6.9% for AGIs $50k-75k, 9.0% for AGIs $75k-100k, 10.3% for AGIs over 100k)
Charity contributions deductions: $1,807 (2% of AGI, reported on 15.2% of returns)
Here:
$1,807
State:
$4,439
Here:
2.4% of AGI
State:
3.6% of AGI
(% of AGI for various income ranges: 7.1% for AGIs below $10k, 0.6% for AGIs $25k-50k, 0.3% for AGIs $50k-75k, 0.6% for AGIs $75k-100k, 1.4% for AGIs over 100k)
Total tax: $4,800 (reported on 75.7% of returns)
13147:
$4,800
State:
$11,730
(% of AGI for various income ranges: 3.6% for AGIs below $10k, 5.2% for AGIs $10k-25k, 6.7% for AGIs $25k-50k, 8.8% for AGIs $50k-75k, 10.0% for AGIs $75k-100k, 18.4% for AGIs over 100k)
Earned income credit: $1,721 (reported on 12.4% of returns)
Here:
$1,721
State:
$1,757
Percentage of individuals using paid preparers for their 2004 taxes: 61.8%
Here:
62%
State:
67%
(% for various income ranges: 56.9% for AGIs below $10k, 61.0% for AGIs $10k-25k, 71.8% for AGIs $25k-50k, 52.2% for AGIs $50k-75k, 53.3% for AGIs $75k-100k, 81.0% for AGIs over 100k)
Household received Food Stamps/SNAP in the past 12 months: 32 Household did not receive Food Stamps/SNAP in the past 12 months: 330
Women who did not have a birth in the past 12 months: 140 (51 now married, 88 unmarried)
Housing units in zip code 13147 with a mortgage: 160 (28 second mortgage, 2 home equity loan, 16 both second mortgage and home equity loan) Houses without a mortgage: 3
Median monthly owner costs for units with a mortgage: $1,406 Median monthly owner costs for units without a mortgage: $519
Residents with income below the poverty level in 2022:
This zip code:
14.0%
Whole state:
14.3%
Residents with income below 50% of the poverty level in 2022:
This zip code:
3.7%
Whole state:
6.8%
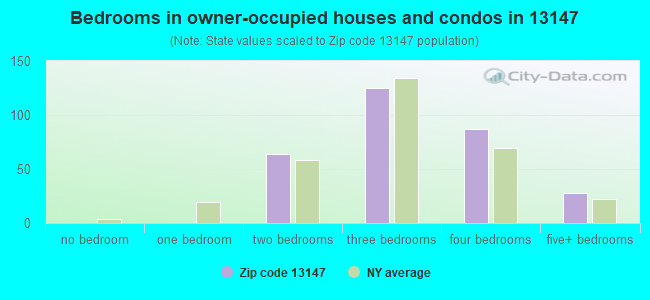
Median number of rooms in houses and condos:
Here:
7.0
State:
6.3
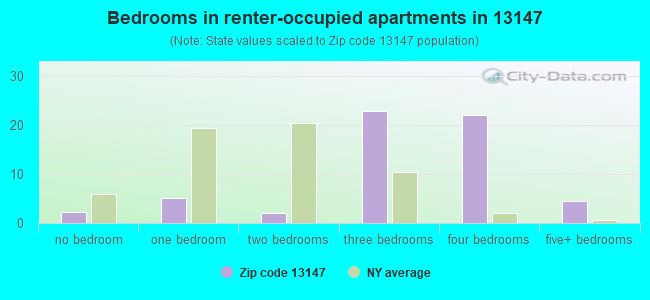
Median number of rooms in apartments:
Here:
6.2
State:
3.8
Notable locations in this zip code not listed on our city pages
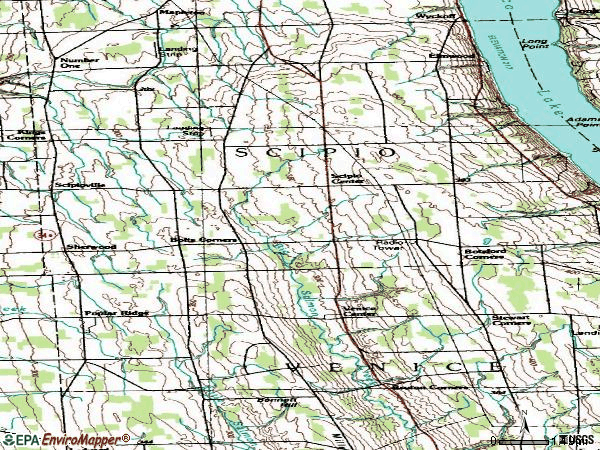
Notable locations in zip code 13147: Kings Corners (A), Holley Corners (B), Bruton Corners (C), Botsford Corners (D), Bolts Corners (E), Scipio Fire Department (F). Display/hide their locations on the map
Cemeteries: Scipio Rural Cemetery (1), Saint Bernard Cemetery (2), Saint Bernard's Old Catholic Cemetery (3), Gould-Akin Cemetery (4), Bolts Corners Cemetery (5), Manchester Family Cemetery (6), Babcock Family Cemetery (7). Display/hide their locations on the map
In group quarters: 73 (-1 institutionalized population)
Size of family households: 128 2-persons, 50 3-persons, 41 4-persons, 6 5-persons, 1 6-persons, 8 7-or-more-persons
Size of nonfamily households: 99 1-person, 29 2-persons
102 married couples with children.
44 single-parent households (40 men, 4 women).
89.8% of residents of 13147 zip code speak English at home.
7.2% of residents speak Spanish at home (29% very well, 39% well, 10% not well, 23% not at all).
2.8% of residents speak other Indo-European language at home (58% very well, 42% well).
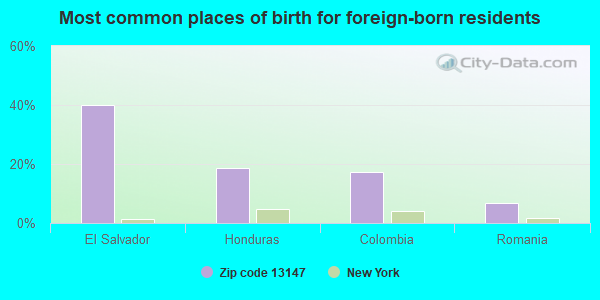
Foreign born population: 74 (8.1%) (43.4% of them are naturalized citizens)
This zip code:
8.1%
Whole state:
22.7%
40%El Salvador
19%Honduras
17%Colombia
7%Romania
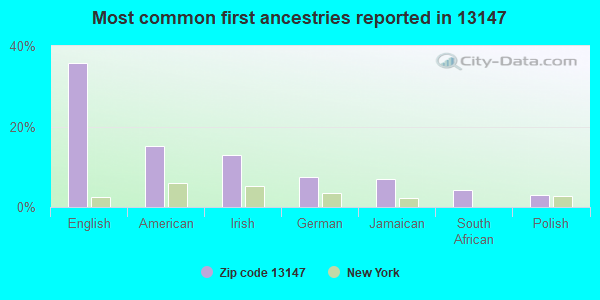
36%English
15%American
13%Irish
8%German
7%Jamaican
4%South African
3%Polish
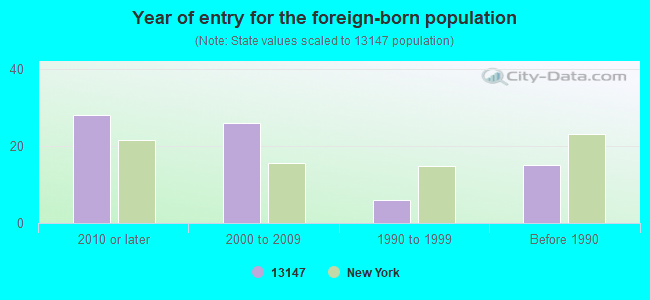
Year of entry for the foreign-born population
282010 or later
262000 to 2009
61990 to 1999
15Before 1990
Facilities with environmental interests located in this zip code:
ALLEN FARMS (140 HUNTER ROAD in SCIPIO CENTER, NY)
STATE MASTER (New York facility tracking) - National Pollutant Discharge Elimination System Permit National Pollutant Discharge Elimination System NON-MAJOR (Tracking pollutant discharge elimination systems) - permit Business SIC classification: GENERAL FARMS, PRIMARILY LIVESTOCK AND ANIMAL SPECIALTIES Organizations: DUANE/GARY ALLEN (CONTACT/OWNER)
Alternative names: DUANE/GARY ALLEN
GREEN HILL FARM (2288 MOSHER ROAD in SCIPIO, NY)
STATE MASTER (New York facility tracking) - National Pollutant Discharge Elimination System Permit National Pollutant Discharge Elimination System NON-MAJOR (Tracking pollutant discharge elimination systems) - permit Business SIC classification: GENERAL FARMS, PRIMARILY LIVESTOCK AND ANIMAL SPECIALTIES Organizations: JOHN/RICHARD JANSSEN (CONTACT/OWNER)
Alternative names: JOHN/RICHARD JANSSEN
Housing units lacking complete plumbing facilities: 8.5% Housing units lacking complete kitchen facilities: 10.3%
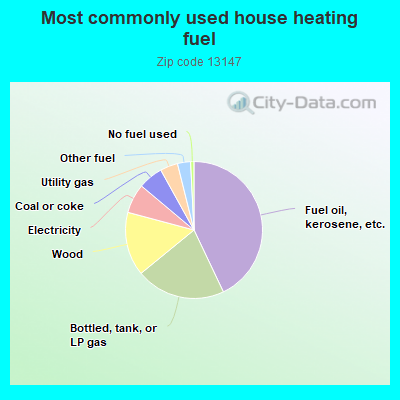
43.3%Fuel oil, kerosene, etc.
21.3%Bottled, tank, or LP gas
15.2%Wood
7.0%Electricity
5.9%Coal or coke
4.2%Utility gas
3.1%Other fuel
0.8%No fuel used
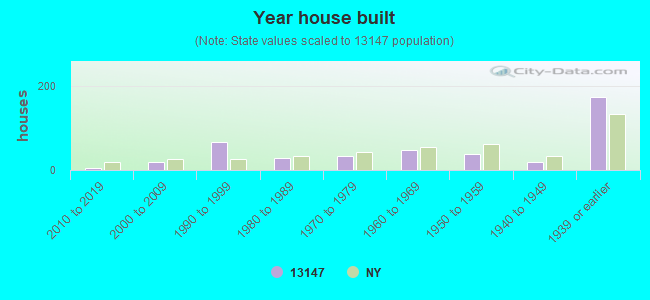
Population in 1990: 1,520.
Place of birth for U.S.-born residents:
This state: 732
Northeast: 58
Midwest: 4
South: 40
76% of the 13147 zip code residents lived in the same house 5 years ago. Out of people who lived in different houses, 63% lived in this county. Out of people who lived in different counties, 50% lived in New York.
90% of the 13147 zip code residents lived in the same house 1 year ago. Out of people who lived in different houses, 71% moved from this county. Out of people who lived in different houses, 4% moved from different county within same state. Out of people who lived in different houses, 22% moved from abroad.
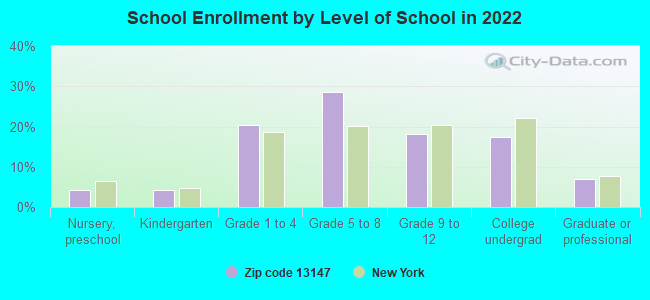
Private vs. public school enrollment:
Students in private schools in grades 1 to 8 (elementary and middle school): 14
Here:
20.0%
New York:
15.6%
Students in private schools in grades 9 to 12 (high school): 7
Here:
29.9%
New York:
15.0%
Students in private undergraduate colleges: 9
Here:
38.9%
New York:
39.2%
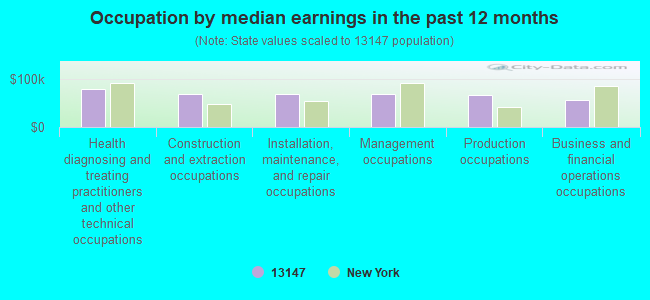
Occupation by median earnings in the past 12 months ($)
80,435Health diagnosing and treating practitioners and other technical occupations
69,803Construction and extraction occupations
69,650Installation, maintenance, and repair occupations
68,701Management occupations
67,808Production occupations
57,517Business and financial operations occupations
Top industries in this zip code by the number of employees in 2005:
Accommodation and Food Services: Full-Service Restaurants (10-19 employees: 1 establishment)
Construction: Plumbing, Heating, and Air-Conditioning Contractors (5-9: 1)
Construction: Site Preparation Contractors (1-4: 2)
Other Services (except Public Administration): Religious Organizations (1-4: 2)
Administrative and Support and Waste Management and Remediation Services: Landscaping Services (1-4: 1)
Construction: Residential Remodelers (1-4: 1)
Other Services (except Public Administration): Automotive Body, Paint, and Interior Repair and Maintenance (1-4: 1)
People in group quarters in 2010:
27 people in workers' group living quarters and job corps centers
Fatal accident statistics in 2012:
Fatal accident count: 1
Vehicles involved in fatal accidents: 1
Fatal accidents caused by drunken drivers: 0
Fatalities: 1
Persons involved in fatal accidents: 1
Pedestrians involved in fatal accidents: 0
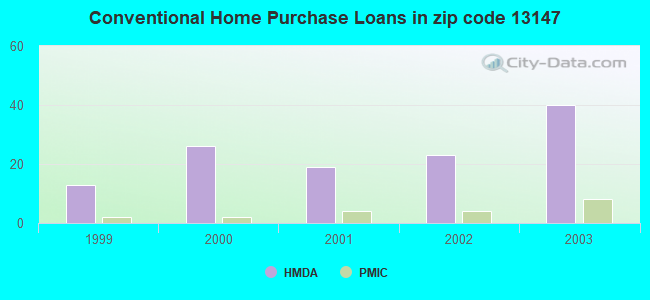
Home Mortgage Disclosure Act Aggregated Statistics For Year 2003 (Based on 2 partial tracts)
A) FHA, FSA/RHS & VA Home Purchase Loans
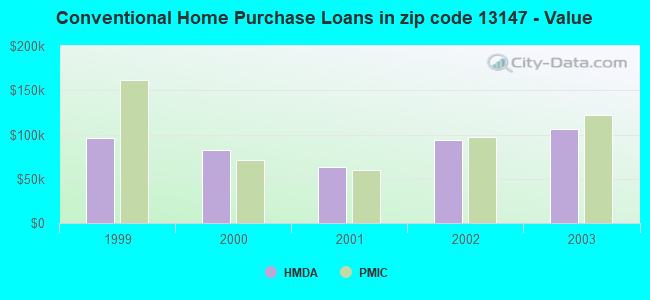
B) Conventional Home Purchase Loans
C) Refinancings
D) Home Improvement Loans
F) Non-occupant Loans on < 5 Family Dwellings (A B C & D)
Number
Average Value
Number
Average Value
Number
Average Value
Number
Average Value
Number
Average Value
LOANS ORIGINATED
7
$85,180
40
$105,947
86
$90,160
13
$13,626
8
$117,039
APPLICATIONS APPROVED, NOT ACCEPTED
1
$69,590
2
$56,940
8
$76,411
6
$19,770
0
$0
APPLICATIONS DENIED
1
$62,470
6
$87,910
33
$82,986
6
$34,927
1
$62,470
APPLICATIONS WITHDRAWN
1
$98,060
2
$82,245
36
$102,079
6
$24,910
0
$0
FILES CLOSED FOR INCOMPLETENESS
0
$0
2
$145,110
3
$74,337
0
$0
1
$158,160
Aggregated Statistics For Year 2002 (Based on 2 partial tracts)
A) FHA, FSA/RHS & VA Home Purchase Loans
B) Conventional Home Purchase Loans
C) Refinancings
D) Home Improvement Loans
F) Non-occupant Loans on < 5 Family Dwellings (A B C & D)
Number
Average Value
Number
Average Value
Number
Average Value
Number
Average Value
Number
Average Value
LOANS ORIGINATED
7
$84,051
23
$93,693
66
$85,550
17
$34,702
6
$144,848
APPLICATIONS APPROVED, NOT ACCEPTED
0
$0
5
$86,040
9
$61,507
2
$26,490
1
$21,350
APPLICATIONS DENIED
1
$35,590
1
$62,470
24
$91,634
3
$17,133
0
$0
APPLICATIONS WITHDRAWN
1
$68,800
2
$106,760
21
$80,473
4
$20,362
1
$60,890
FILES CLOSED FOR INCOMPLETENESS
1
$32,420
0
$0
2
$51,400
0
$0
0
$0
Aggregated Statistics For Year 2001 (Based on 2 partial tracts)
A) FHA, FSA/RHS & VA Home Purchase Loans
B) Conventional Home Purchase Loans
C) Refinancings
D) Home Improvement Loans
F) Non-occupant Loans on < 5 Family Dwellings (A B C & D)
Number
Average Value
Number
Average Value
Number
Average Value
Number
Average Value
Number
Average Value
LOANS ORIGINATED
4
$70,778
19
$63,680
49
$66,686
22
$15,492
2
$95,290
APPLICATIONS APPROVED, NOT ACCEPTED
0
$0
6
$66,955
5
$41,280
1
$11,860
0
$0
APPLICATIONS DENIED
0
$0
5
$41,754
16
$58,421
13
$15,451
0
$0
APPLICATIONS WITHDRAWN
1
$56,150
2
$40,330
9
$77,499
2
$53,380
0
$0
FILES CLOSED FOR INCOMPLETENESS
0
$0
0
$0
2
$55,355
1
$39,540
0
$0
Aggregated Statistics For Year 2000 (Based on 2 partial tracts)
A) FHA, FSA/RHS & VA Home Purchase Loans
B) Conventional Home Purchase Loans
C) Refinancings
D) Home Improvement Loans
E) Loans on Dwellings For 5+ Families
F) Non-occupant Loans on < 5 Family Dwellings (A B C & D)
Number
Average Value
Number
Average Value
Number
Average Value
Number
Average Value
Number
Average Value
Number
Average Value
LOANS ORIGINATED
6
$77,893
26
$82,426
23
$54,531
17
$20,561
1
$74,340
2
$70,775
APPLICATIONS APPROVED, NOT ACCEPTED
0
$0
2
$50,215
9
$53,599
2
$31,630
0
$0
0
$0
APPLICATIONS DENIED
0
$0
6
$73,148
21
$47,674
9
$35,322
0
$0
5
$65,320
APPLICATIONS WITHDRAWN
0
$0
3
$67,217
7
$41,687
1
$3,950
0
$0
0
$0
FILES CLOSED FOR INCOMPLETENESS
0
$0
0
$0
2
$37,565
0
$0
0
$0
0
$0
Aggregated Statistics For Year 1999 (Based on 1 partial tract)


+$3,439
-$2,666
(% of AGI for various income ranges: 3.7% for AGIs $10k-25k, 0.0% for AGIs $50k-75k, 2.1% for AGIs $75k-100k) Nearest zip codes: 13026, 13160, 13071, 13081, 13021, 13024.