Estimated zip code population in 2022: 2,832 Zip code population in 2010: 2,460 Zip code population in 2000: 2,400
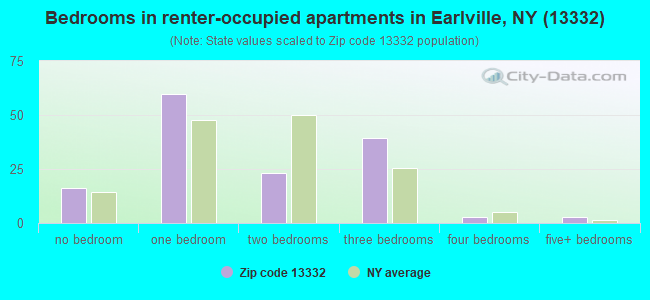
Houses and condos: 1,167 Renter-occupied apartments: 142
% of renters here:
16%
State:
46%
March 2022 cost of living index in zip code 13332: 94.6 (less than average, U.S. average is 100)
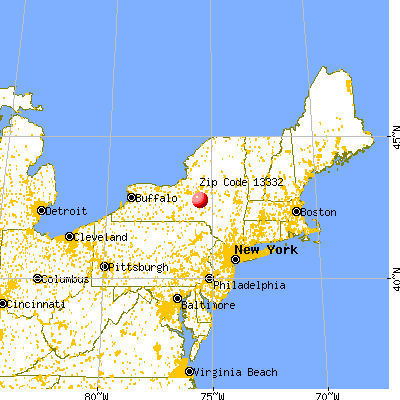
Land area: 49.2 sq. mi. Water area: 0.1 sq. mi.
Population density: 58 people per square mile
(very low).
OSM Map
General Map
Google Map
MSN Map
OSM Map
General Map
Google Map
MSN Map
OSM Map
General Map
Google Map
MSN Map
OSM Map
General Map
Google Map
MSN Map
Please wait while loading the map...
Real estate property taxes paid for housing units in 2022:
This zip code:
2.2% ($2,755)
New York:
1.5% ($6,180)
Median real estate property taxes paid for housing units with mortgages in 2022: $2,732 (2.1%) Median real estate property taxes paid for housing units with no mortgage in 2022: $2,845 (2.5%)
Business Search- 14 Million verified businesses
Males: 1,486
(52.5%)
Females: 1,345
(47.5%)
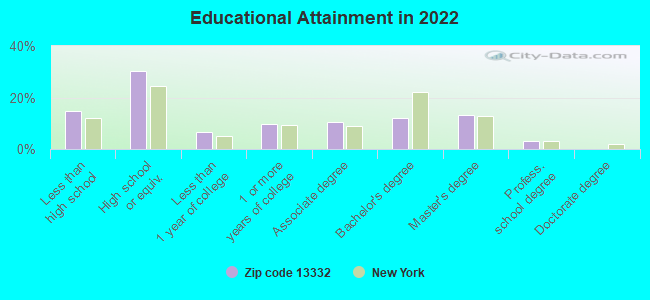
For population 25 years and over in 13332:
High school or higher: 84.7%
Bachelor's degree or higher: 28.4%
Graduate or professional degree: 16.2%
Unemployed: 6.7%
Mean travel time to work (commute): 19.5 minutes
For population 15 years and over in 13332:
Never married: 27.2%
Now married: 61.5%
Separated: 0.5%
Widowed: 3.6%
Divorced: 7.2%
Zip code 13332 compared to state average:
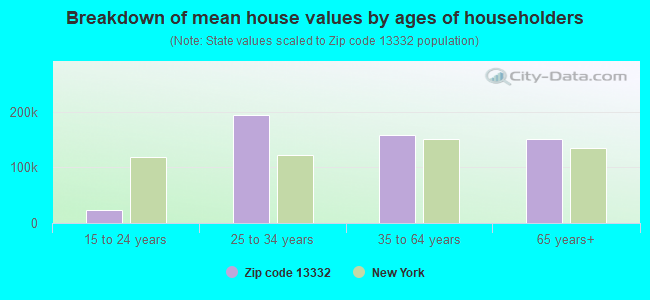
Median house value significantly below state average.
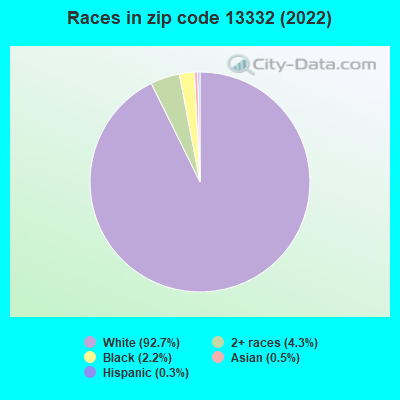
Black race population percentage significantly below state average.
Hispanic race population percentage significantly below state average.
Median age below state average.
Foreign-born population percentage significantly below state average.
Renting percentage significantly below state average.
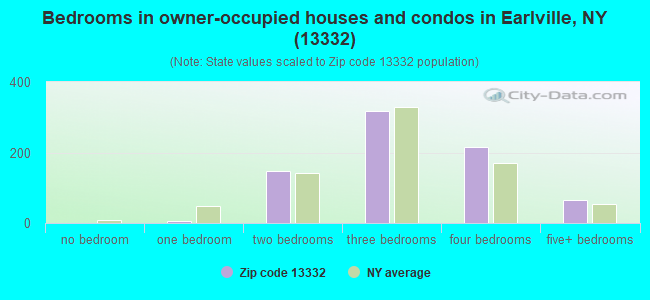
Number of rooms per house above state average.
Number of college students significantly below state average.
Percentage of population with a bachelor's degree or higher below state average.
Estimated median house/condo value in 2022: $123,633
13332:
$123,633
New York:
$400,400
According to our research of New York and other state lists, there were 2 registered sex offenders living in 13332 zip code as of April 25, 2024. The ratio of all residents to sex offenders in zip code 13332 is 1,396 to 1. The ratio of registered sex offenders to all residents in this zip code is lower than the state average.
Median resident age:
This zip code:
32.1 years
New York median age:
40.0 years
Average household size:
This zip code:
3.1 people
New York:
2.5 people
Averages for the 2020 tax year for zip code 13332, filed in 2021:
Average Adjusted Gross Income (AGI) in 2020: $53,062 (Individual Income Tax Returns)
Here:
$53,062
State:
$90,930
Salary/wage: $47,730 (reported on 77.9% of returns)
Here:
$47,730
State:
$72,104
(% of AGI for various income ranges: 1222.6% for AGIs below $25k, 3646.8% for AGIs $25k-50k, 6890.8% for AGIs $50k-75k, 9780.0% for AGIs $75k-100k, 20384.3% for AGIs $100k-200k)
Taxable interest for individuals: $1,038 (reported on 28.3% of returns)
This zip code:
$1,038
New York:
$3,075
(% of AGI for various income ranges: 30.0% for AGIs below $25k, 38.4% for AGIs $25k-50k, 43.1% for AGIs $50k-75k, 64.3% for AGIs $75k-100k, 94.3% for AGIs $100k-200k)
Ordinary dividends: $2,406 (reported on 15.0% of returns)
Here:
$2,406
State:
$11,095
(% of AGI for various income ranges: 37.0% for AGIs below $25k, 15.6% for AGIs $25k-50k, 38.5% for AGIs $50k-75k, 88.6% for AGIs $75k-100k, 247.1% for AGIs $100k-200k)
Net capital gain/loss in AGI: +$8,457 (reported on 12.4% of returns)
Here:
+$8,457
State:
+$44,925
(% of AGI for various income ranges: 38.3% for AGIs below $25k, 71.5% for AGIs $50k-75k, 352.9% for AGIs $75k-100k, 1080.0% for AGIs $100k-200k)
Profit/loss from business: +$14,344 (reported on 14.2% of returns)
Here:
+$14,344
State:
+$14,940
(% of AGI for various income ranges: 198.7% for AGIs below $25k, 132.4% for AGIs $25k-50k, 545.4% for AGIs $50k-75k, 1140.0% for AGIs $100k-200k)
Taxable individual retirement arrangement distribution: $15,689 (reported on 8.0% of returns)
13332:
$15,689
New York:
$19,609
(% of AGI for various income ranges: 97.8% for AGIs below $25k, 154.0% for AGIs $25k-50k, 1145.7% for AGIs $75k-100k)
Total itemized deductions: $34,750 (reported on 1.8% of returns)
Here:
$34,750
State:
$39,326
(% of AGI for various income ranges: 534.6% for AGIs $50k-75k)
Taxes paid: $7,433 (reported on 2.7% of returns)
13332:
$7,433
State:
$9,183
(% of AGI for various income ranges: 171.5% for AGIs $50k-75k)
Earned income credit: $2,211 (reported on 16.8% of returns)
Here:
$2,211
State:
$2,138
(% of AGI for various income ranges: 97.0% for AGIs below $25k, 78.8% for AGIs $25k-50k)
Percentage of individuals using paid preparers for their 2020 taxes: 93.8%
Here:
94%
State:
95%
(% for various income ranges: 88.9% for AGIs below $25k, 96.9% for AGIs $25k-50k, 95.2% for AGIs $50k-75k, 100.0% for AGIs $75k-100k, 92.9% for AGIs $100k-200k)
Averages for the 2012 tax year for zip code 13332, filed in 2013:
Average Adjusted Gross Income (AGI) in 2012: $40,285 (Individual Income Tax Returns)
Here:
$40,285
State:
$77,088
Salary/wage: $36,753 (reported on 81.7% of returns)
Here:
$36,753
State:
$60,593
(% of AGI for various income ranges: 70.9% for AGIs below $25k, 76.1% for AGIs $25k-50k, 76.4% for AGIs $50k-75k, 80.3% for AGIs $75k-100k, 69.1% for AGIs $100k-200k)
Taxable interest for individuals: $800 (reported on 31.2% of returns)
This zip code:
$800
New York:
$3,125
(% of AGI for various income ranges: 1.9% for AGIs below $25k, 0.2% for AGIs $25k-50k, 0.9% for AGIs $50k-75k, 0.1% for AGIs $75k-100k, 0.5% for AGIs $100k-200k)
Ordinary dividends: $1,400 (reported on 17.4% of returns)
Here:
$1,400
State:
$10,299
(% of AGI for various income ranges: 1.6% for AGIs below $25k, 0.3% for AGIs $25k-50k, 0.3% for AGIs $50k-75k, 0.6% for AGIs $75k-100k, 0.7% for AGIs $100k-200k)
Net capital gain/loss in AGI: +$3,962 (reported on 11.9% of returns)
Here:
+$3,962
State:
+$42,474
(% of AGI for various income ranges: 0.1% for AGIs below $25k, 0.3% for AGIs $25k-50k, 1.7% for AGIs $50k-75k, 3.0% for AGIs $100k-200k)
Profit/loss from business: +$8,738 (reported on 14.7% of returns)
Here:
+$8,738
State:
+$16,168
(% of AGI for various income ranges: 5.8% for AGIs below $25k, 5.6% for AGIs $25k-50k, 1.7% for AGIs $50k-75k, 4.0% for AGIs $75k-100k)
Taxable individual retirement arrangement distribution: $9,791 (reported on 10.1% of returns)
13332:
$9,791
New York:
$17,621
(% of AGI for various income ranges: 2.8% for AGIs below $25k, 4.0% for AGIs $25k-50k, 6.5% for AGIs $75k-100k)
Total itemized deductions: $16,274 (20% of AGI, reported on 17.4% of returns)
Here:
$16,274
State:
$34,985
Here:
19.8% of AGI
State:
21.3% of AGI
(% of AGI for various income ranges: 6.7% for AGIs $25k-50k, 6.0% for AGIs $50k-75k, 9.9% for AGIs $75k-100k, 10.0% for AGIs $100k-200k)
Charity contributions: $2,800 (reported on 11.0% of returns)
Here:
$2,800
State:
$5,572
(% of AGI for various income ranges: 0.5% for AGIs $25k-50k, 0.5% for AGIs $50k-75k, 0.8% for AGIs $75k-100k, 1.6% for AGIs $100k-200k)
Taxes paid: $6,995 (reported on 17.4% of returns)
13332:
$6,995
State:
$18,656
(% of AGI for various income ranges: 1.8% for AGIs $25k-50k, 2.3% for AGIs $50k-75k, 4.3% for AGIs $75k-100k, 5.6% for AGIs $100k-200k)
Earned income credit: $2,130 (reported on 21.1% of returns)
Here:
$2,130
State:
$2,230
(% of AGI for various income ranges: 5.8% for AGIs below $25k, 1.5% for AGIs $25k-50k)
Percentage of individuals using paid preparers for their 2012 taxes: 56.9%
Here:
57%
State:
66%
(% for various income ranges: 52.2% for AGIs below $25k, 61.3% for AGIs $25k-50k, 60.0% for AGIs $50k-75k, 55.6% for AGIs $75k-100k, 62.5% for AGIs $100k-200k)
Averages for the 2004 tax year for zip code 13332, filed in 2005:
Average Adjusted Gross Income (AGI) in 2004: $34,531 (Individual Income Tax Returns)
Here:
$34,531
State:
$59,519
Salary/wage: $32,158 (reported on 83.5% of returns)
Here:
$32,158
State:
$50,673
(% of AGI for various income ranges: 97.1% for AGIs below $10k, 68.7% for AGIs $10k-25k, 81.6% for AGIs $25k-50k, 83.1% for AGIs $50k-75k, 72.8% for AGIs $75k-100k, 70.6% for AGIs over 100k)
Taxable interest for individuals: $834 (reported on 46.1% of returns)
This zip code:
$834
New York:
$2,377
(% of AGI for various income ranges: 5.5% for AGIs below $10k, 2.5% for AGIs $10k-25k, 0.9% for AGIs $25k-50k, 0.4% for AGIs $50k-75k, 1.3% for AGIs $75k-100k, 0.7% for AGIs over 100k)
Taxable dividends: $1,087 (reported on 24.8% of returns)
Here:
$1,087
State:
$5,394
(% of AGI for various income ranges: 6.2% for AGIs below $10k, 1.5% for AGIs $10k-25k, 0.7% for AGIs $25k-50k, 0.3% for AGIs $50k-75k, 0.5% for AGIs $75k-100k, 0.7% for AGIs over 100k)
Net capital gain/loss: +$3,672 (reported on 16.5% of returns)
Here:
+$3,672
State:
+$23,581
(% of AGI for various income ranges: 2.8% for AGIs below $10k, 1.7% for AGIs $10k-25k, 1.1% for AGIs $25k-50k, 0.2% for AGIs $50k-75k, 1.6% for AGIs $75k-100k, 5.8% for AGIs over 100k)
Profit/loss from business: +$5,786 (reported on 15.1% of returns)
Here:
+$5,786
State:
+$13,809
(% of AGI for various income ranges: 5.9% for AGIs below $10k, 4.5% for AGIs $10k-25k, 3.0% for AGIs $25k-50k, 2.0% for AGIs $50k-75k, 2.7% for AGIs $75k-100k)
IRA payment deduction: $2,654 (reported on 2.3% of returns)
13332:
$2,654
New York:
$3,115
Total itemized deductions: $17,120 (26% of AGI, reported on 18.8% of returns)
Here:
$17,120
State:
$25,864
Here:
25.5% of AGI
State:
21.9% of AGI
(% of AGI for various income ranges: 5.1% for AGIs $10k-25k, 5.8% for AGIs $25k-50k, 7.6% for AGIs $50k-75k, 10.9% for AGIs $75k-100k, 23.1% for AGIs over 100k)
Charity contributions deductions: $3,064 (5% of AGI, reported on 15.6% of returns)
Here:
$3,064
State:
$4,439
Here:
4.5% of AGI
State:
3.6% of AGI
(% of AGI for various income ranges: 0.5% for AGIs $10k-25k, 0.4% for AGIs $25k-50k, 0.8% for AGIs $50k-75k, 0.8% for AGIs $75k-100k, 6.1% for AGIs over 100k)
Total tax: $3,973 (reported on 72.2% of returns)
13332:
$3,973
State:
$11,730
(% of AGI for various income ranges: 2.9% for AGIs below $10k, 4.2% for AGIs $10k-25k, 6.3% for AGIs $25k-50k, 8.3% for AGIs $50k-75k, 10.7% for AGIs $75k-100k, 14.4% for AGIs over 100k)
Earned income credit: $1,690 (reported on 17.7% of returns)
Here:
$1,690
State:
$1,757
Percentage of individuals using paid preparers for their 2004 taxes: 66.6%
Here:
67%
State:
67%
(% for various income ranges: 55.5% for AGIs below $10k, 67.6% for AGIs $10k-25k, 72.1% for AGIs $25k-50k, 66.0% for AGIs $50k-75k, 69.6% for AGIs $75k-100k, 83.3% for AGIs over 100k)
Household received Food Stamps/SNAP in the past 12 months: 190 Household did not receive Food Stamps/SNAP in the past 12 months: 714
Women who had a birth in the past 12 months: 34 (29 now married, 5 unmarried) Women who did not have a birth in the past 12 months: 517 (323 now married, 187 unmarried)
Housing units in zip code 13332 with a mortgage: 419 (9 second mortgage, 4 both second mortgage and home equity loan) Houses without a mortgage: 28
Median monthly owner costs for units with a mortgage: $1,402 Median monthly owner costs for units without a mortgage: $480
Residents with income below the poverty level in 2022:
This zip code:
14.3%
Whole state:
14.3%
Residents with income below 50% of the poverty level in 2022:
This zip code:
7.1%
Whole state:
6.8%
Median number of rooms in houses and condos:
Here:
6.8
State:
6.3
Median number of rooms in apartments:
Here:
3.8
State:
3.8
Notable locations in this zip code not listed on our city pages
Notable locations in zip code 13332: Loomis Corners (A), Excell Corners (B), Earlville Free Library (C), Earlville Fire Department (D). Display/hide their locations on the map
Churches in zip code 13332 include: Earlville and Poolville United Methodist Church (A), First Baptist Church (B), Lebanon Federated Church (C). Display/hide their locations on the map
Cemeteries: Lebanon Valley Cemetery (1), Poolville Rural Cemetery (2), Earlville Cemetery (3), Niles Cemetery (4), Wilcok Cemetery (5). Display/hide their locations on the map
In group quarters: 7 (-1 institutionalized population)
Size of family households: 204 2-persons, 171 3-persons, 155 4-persons, 36 5-persons, 61 6-persons, 22 7-or-more-persons
Size of nonfamily households: 183 1-person, 52 2-persons, 2 3-persons
716 married couples with children.
111 single-parent households (57 men, 54 women).
92.0% of residents of 13332 zip code speak English at home.
0.1% of residents speak Spanish at home (100% very well).
7.5% of residents speak other Indo-European language at home (49% very well, 46% well, 5% not well).
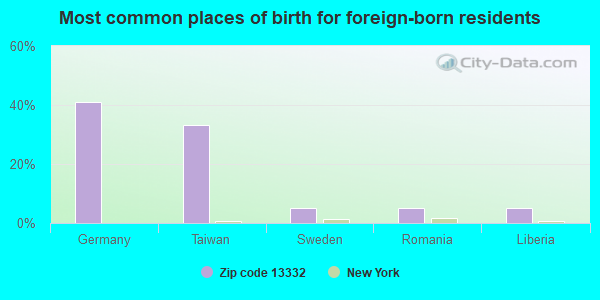
Foreign born population: 39 (1.4%) (63.7% of them are naturalized citizens)
This zip code:
1.4%
Whole state:
22.7%
41%Germany
33%Taiwan
5%Sweden
5%Romania
5%Liberia
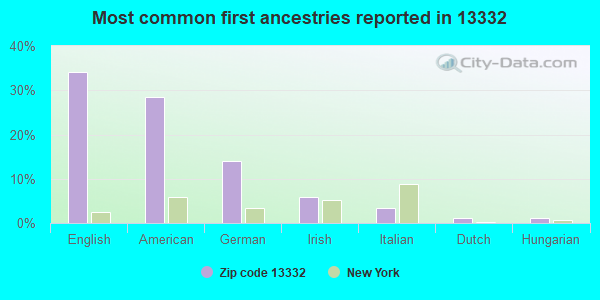
34%English
29%American
14%German
6%Irish
3%Italian
1%Dutch
1%Hungarian
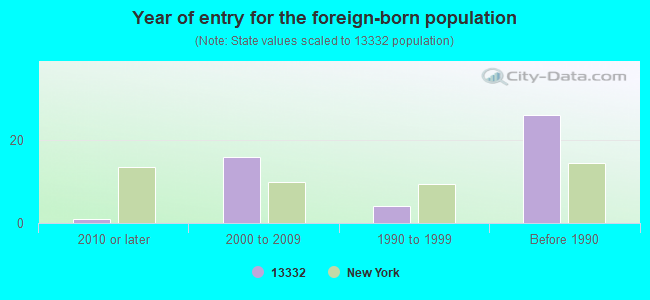
Year of entry for the foreign-born population
12010 or later
162000 to 2009
41990 to 1999
26Before 1990
Housing units lacking complete plumbing facilities: 4.9% Housing units lacking complete kitchen facilities: 9.9%
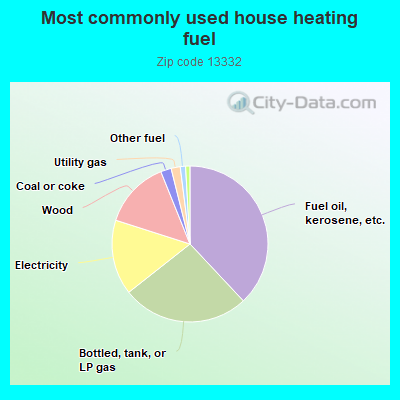
38.1%Fuel oil, kerosene, etc.
26.4%Bottled, tank, or LP gas
15.6%Electricity
14.0%Wood
2.2%Coal or coke
1.9%Utility gas
1.1%Other fuel
0.9%No fuel used
Population in 1990: 2,413.
Place of birth for U.S.-born residents:
This state: 2,263
Northeast: 272
Midwest: 56
South: 78
West: 110
64% of the 13332 zip code residents lived in the same house 5 years ago. Out of people who lived in different houses, 56% lived in this county. Out of people who lived in different counties, 50% lived in New York.
93% of the 13332 zip code residents lived in the same house 1 year ago. Out of people who lived in different houses, 39% moved from this county. Out of people who lived in different houses, 29% moved from different county within same state. Out of people who lived in different houses, 32% moved from different state.
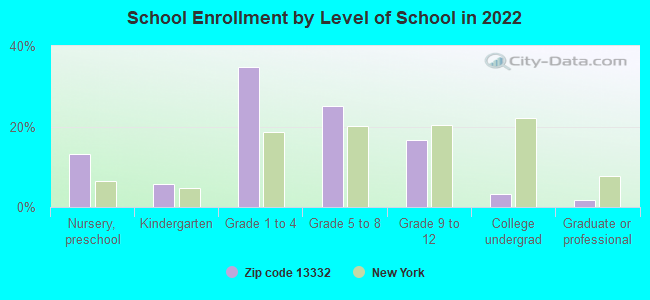
Private vs. public school enrollment:
Students in private schools in grades 1 to 8 (elementary and middle school): 29
Here:
7.2%
New York:
15.6%
Students in private schools in grades 9 to 12 (high school): 2
Here:
1.8%
New York:
15.0%
Students in private undergraduate colleges: 5
Here:
26.3%
New York:
39.2%
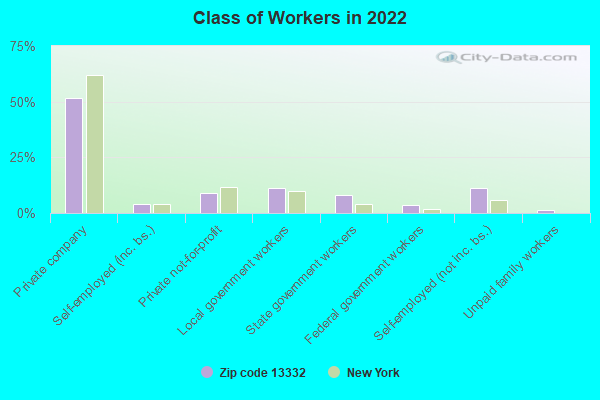
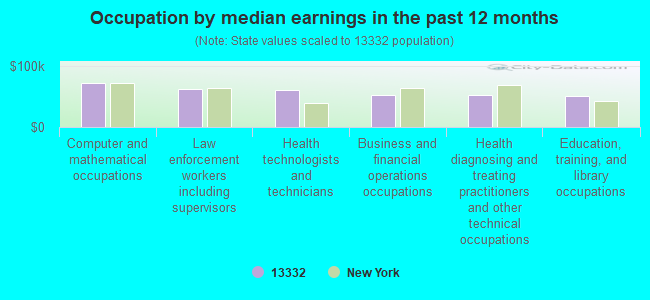
Occupation by median earnings in the past 12 months ($)
71,828Computer and mathematical occupations
61,566Law enforcement workers including supervisors
60,753Health technologists and technicians
51,705Business and financial operations occupations
51,611Health diagnosing and treating practitioners and other technical occupations
51,271Education, training, and library occupations
Top industries in this zip code by the number of employees in 2005:
Health Care and Social Assistance: Residential Mental Retardation Facilities (10-19 employees: 1 establishment)
Construction: Site Preparation Contractors (10-19: 1)
Administrative and Support and Waste Management and Remediation Services: Solid Waste Collection (5-9: 1, 1-4: 1)
Accommodation and Food Services: Full-Service Restaurants (5-9: 1)
Information: Libraries and Archives (5-9: 1)
Construction: New Single-Family Housing Construction (except Operative Builders) (1-4: 3)
People in group quarters in 2010:
3 people in group homes intended for adults
Home Mortgage Disclosure Act Aggregated Statistics For Year 2009 (Based on 4 partial tracts)
A) FHA, FSA/RHS & VA Home Purchase Loans
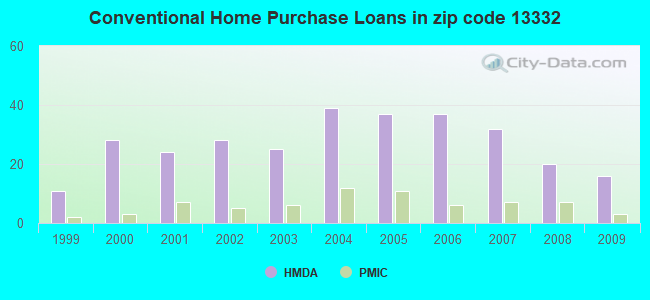
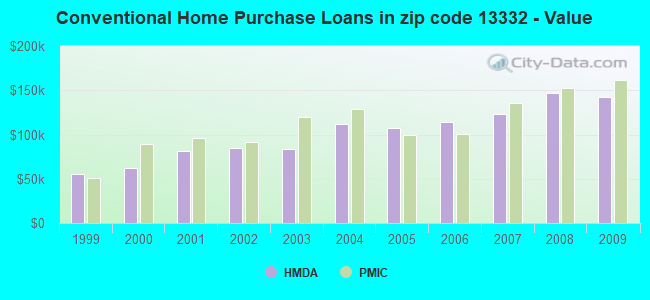
B) Conventional Home Purchase Loans
C) Refinancings
D) Home Improvement Loans
F) Non-occupant Loans on < 5 Family Dwellings (A B C & D)
G) Loans On Manufactured Home Dwelling (A B C & D)
Number
Average Value
Number
Average Value
Number
Average Value
Number
Average Value
Number
Average Value
Number
Average Value
LOANS ORIGINATED
5
$96,218
16
$142,801
43
$116,863
10
$35,262
4
$255,260
3
$71,050
APPLICATIONS APPROVED, NOT ACCEPTED
1
$98,010
1
$65,790
3
$149,420
0
$0
1
$159,440
1
$80,870
APPLICATIONS DENIED
4
$98,585
3
$62,060
19
$97,252
9
$29,174
1
$8,040
2
$15,095
APPLICATIONS WITHDRAWN
1
$119,980
2
$84,870
7
$130,414
1
$57,970
2
$188,645
0
$0
FILES CLOSED FOR INCOMPLETENESS
0
$0
0
$0
2
$138,890
0
$0
0
$0
0
$0
Aggregated Statistics For Year 2008 (Based on 4 partial tracts)
A) FHA, FSA/RHS & VA Home Purchase Loans
B) Conventional Home Purchase Loans
C) Refinancings
D) Home Improvement Loans
F) Non-occupant Loans on < 5 Family Dwellings (A B C & D)
G) Loans On Manufactured Home Dwelling (A B C & D)
Number
Average Value
Number
Average Value
Number
Average Value
Number
Average Value
Number
Average Value
Number
Average Value
LOANS ORIGINATED
7
$94,019
20
$147,074
32
$108,536
11
$36,682
5
$149,014
3
$63,060
APPLICATIONS APPROVED, NOT ACCEPTED
0
$0
3
$74,247
6
$83,365
2
$8,295
1
$72,370
2
$59,015
APPLICATIONS DENIED
1
$112,180
5
$103,940
18
$107,757
19
$34,643
1
$42,860
7
$74,541
APPLICATIONS WITHDRAWN
0
$0
4
$158,368
9
$87,679
2
$36,180
2
$94,155
3
$81,717
FILES CLOSED FOR INCOMPLETENESS
0
$0
0
$0
1
$93,530
1
$7,030
0
$0
1
$7,030
Aggregated Statistics For Year 2007 (Based on 4 partial tracts)
A) FHA, FSA/RHS & VA Home Purchase Loans
B) Conventional Home Purchase Loans
C) Refinancings
D) Home Improvement Loans
F) Non-occupant Loans on < 5 Family Dwellings (A B C & D)
G) Loans On Manufactured Home Dwelling (A B C & D)
Number
Average Value
Number
Average Value
Number
Average Value
Number
Average Value
Number
Average Value
Number
Average Value
LOANS ORIGINATED
4
$83,822
32
$123,242
34
$77,838
19
$55,835
8
$106,232
5
$67,318
APPLICATIONS APPROVED, NOT ACCEPTED
1
$39,670
3
$139,223
6
$87,757
3
$34,003
1
$220,950
1
$33,650
APPLICATIONS DENIED
1
$33,150
7
$123,283
47
$95,043
20
$41,506
6
$117,580
3
$50,770
APPLICATIONS WITHDRAWN
1
$48,020
3
$106,413
16
$92,906
4
$71,902
1
$84,370
0
$0
FILES CLOSED FOR INCOMPLETENESS
0
$0
0
$0
5
$141,806
1
$87,380
0
$0
0
$0
Aggregated Statistics For Year 2006 (Based on 4 partial tracts)
A) FHA, FSA/RHS & VA Home Purchase Loans
B) Conventional Home Purchase Loans
C) Refinancings
D) Home Improvement Loans
F) Non-occupant Loans on < 5 Family Dwellings (A B C & D)
G) Loans On Manufactured Home Dwelling (A B C & D)
Number
Average Value
Number
Average Value
Number
Average Value
Number
Average Value
Number
Average Value
Number
Average Value
LOANS ORIGINATED
2
$83,215
37
$113,748
49
$79,081
30
$37,203
10
$149,158
10
$41,105
APPLICATIONS APPROVED, NOT ACCEPTED
0
$0
4
$44,525
9
$70,658
6
$31,365
2
$83,980
4
$31,180
APPLICATIONS DENIED
3
$54,617
7
$61,321
51
$83,123
18
$43,999
1
$108,440
9
$43,737
APPLICATIONS WITHDRAWN
0
$0
2
$91,765
26
$103,184
7
$62,259
2
$59,935
3
$64,350
FILES CLOSED FOR INCOMPLETENESS
0
$0
1
$70,850
7
$153,670
1
$39,060
1
$107,500
0
$0
Aggregated Statistics For Year 2005 (Based on 4 partial tracts)
A) FHA, FSA/RHS & VA Home Purchase Loans
B) Conventional Home Purchase Loans
C) Refinancings
D) Home Improvement Loans
F) Non-occupant Loans on < 5 Family Dwellings (A B C & D)
G) Loans On Manufactured Home Dwelling (A B C & D)
Number
Average Value
Number
Average Value
Number
Average Value
Number
Average Value
Number
Average Value
Number
Average Value
LOANS ORIGINATED
4
$58,940
37
$106,842
53
$77,965
24
$44,948
10
$111,125
10
$53,253
APPLICATIONS APPROVED, NOT ACCEPTED
1
$63,140
6
$88,987
10
$67,551
3
$26,660
1
$138,930
4
$45,330
APPLICATIONS DENIED
0
$0
10
$95,451
56
$83,153
21
$28,770
2
$93,455
11
$44,675
APPLICATIONS WITHDRAWN
0
$0
4
$130,640
36
$85,977
6
$71,100
3
$161,817
4
$64,125
FILES CLOSED FOR INCOMPLETENESS
1
$43,300
2
$129,570
11
$112,257
0
$0
1
$49,760
0
$0
Aggregated Statistics For Year 2004 (Based on 4 partial tracts)
A) FHA, FSA/RHS & VA Home Purchase Loans
B) Conventional Home Purchase Loans
C) Refinancings
D) Home Improvement Loans
E) Loans on Dwellings For 5+ Families
F) Non-occupant Loans on < 5 Family Dwellings (A B C & D)
G) Loans On Manufactured Home Dwelling (A B C & D)
Number
Average Value
Number
Average Value
Number
Average Value
Number
Average Value
Number
Average Value
Number
Average Value
Number
Average Value
LOANS ORIGINATED
5
$102,644
39
$112,346
41
$82,819
22
$33,039
1
$100,440
5
$134,344
4
$60,035
APPLICATIONS APPROVED, NOT ACCEPTED
0
$0
5
$54,944
14
$54,964
4
$22,465
0
$0
1
$80,850
2
$47,200
APPLICATIONS DENIED
0
$0
8
$71,665
61
$73,276
19
$27,231
0
$0
3
$69,743
11
$42,765
APPLICATIONS WITHDRAWN
0
$0
2
$103,465
34
$73,309
5
$31,572
0
$0
1
$107,350
2
$39,990
FILES CLOSED FOR INCOMPLETENESS
1
$33,150
1
$66,790
9
$78,046
2
$34,935
0
$0
0
$0
0
$0
Aggregated Statistics For Year 2003 (Based on 4 partial tracts)
A) FHA, FSA/RHS & VA Home Purchase Loans
B) Conventional Home Purchase Loans
C) Refinancings
D) Home Improvement Loans
F) Non-occupant Loans on < 5 Family Dwellings (A B C & D)
Number
Average Value
Number
Average Value
Number
Average Value
Number
Average Value
Number
Average Value
LOANS ORIGINATED
5
$69,940
25
$83,891
91
$83,222
6
$18,792
7
$66,459
APPLICATIONS APPROVED, NOT ACCEPTED
0
$0
3
$23,200
7
$68,209
1
$13,380
0
$0
APPLICATIONS DENIED
0
$0
5
$68,362
56
$66,261
11
$18,463
2
$50,220
APPLICATIONS WITHDRAWN
0
$0
2
$80,730
31
$67,501
2
$46,750
0
$0
FILES CLOSED FOR INCOMPLETENESS
0
$0
1
$159,220
4
$110,408
0
$0
0
$0
Aggregated Statistics For Year 2002 (Based on 4 partial tracts)
A) FHA, FSA/RHS & VA Home Purchase Loans
B) Conventional Home Purchase Loans
C) Refinancings
D) Home Improvement Loans
F) Non-occupant Loans on < 5 Family Dwellings (A B C & D)
Number
Average Value
Number
Average Value
Number
Average Value
Number
Average Value
Number
Average Value
LOANS ORIGINATED
6
$57,498
28
$85,129
57
$82,679
8
$16,520
4
$96,285
APPLICATIONS APPROVED, NOT ACCEPTED
1
$24,110
6
$44,260
7
$55,757
1
$24,500
0
$0
APPLICATIONS DENIED
0
$0
8
$52,744
34
$67,773
7
$14,381
1
$34,950
APPLICATIONS WITHDRAWN
1
$84,630
1
$44,080
19
$64,788
1
$7,530
1
$22,600
FILES CLOSED FOR INCOMPLETENESS
0
$0
1
$50,630
7
$55,430
0
$0
0
$0
Aggregated Statistics For Year 2001 (Based on 4 partial tracts)
A) FHA, FSA/RHS & VA Home Purchase Loans
B) Conventional Home Purchase Loans
C) Refinancings
D) Home Improvement Loans
F) Non-occupant Loans on < 5 Family Dwellings (A B C & D)
Number
Average Value
Number
Average Value
Number
Average Value
Number
Average Value
Number
Average Value
LOANS ORIGINATED
5
$57,738
24
$81,917
49
$69,960
12
$17,782
2
$159,520
APPLICATIONS APPROVED, NOT ACCEPTED
0
$0
5
$48,358
5
$45,650
3
$13,880
1
$20,180
APPLICATIONS DENIED
1
$42,690
7
$52,143
34
$45,173
11
$10,535
2
$41,720
APPLICATIONS WITHDRAWN
0
$0
2
$52,105
23
$61,209
4
$32,702
1
$27,550
FILES CLOSED FOR INCOMPLETENESS
0
$0
0
$0
3
$39,133
0
$0
0
$0
Aggregated Statistics For Year 2000 (Based on 4 partial tracts)
A) FHA, FSA/RHS & VA Home Purchase Loans
B) Conventional Home Purchase Loans
C) Refinancings
D) Home Improvement Loans
F) Non-occupant Loans on < 5 Family Dwellings (A B C & D)
Number
Average Value
Number
Average Value
Number
Average Value
Number
Average Value
Number
Average Value
LOANS ORIGINATED
4
$60,368
28
$61,889
22
$51,021
14
$12,279
3
$84,843
APPLICATIONS APPROVED, NOT ACCEPTED
0
$0
5
$50,040
6
$42,690
7
$18,660
0
$0
APPLICATIONS DENIED
0
$0
17
$35,405
25
$57,745
9
$16,534
2
$36,760
APPLICATIONS WITHDRAWN
1
$25,110
3
$75,690
12
$63,777
1
$25,110
1
$73,210
FILES CLOSED FOR INCOMPLETENESS
0
$0
1
$61,850
2
$51,585
0
$0
0
$0
Aggregated Statistics For Year 1999 (Based on 2 partial tracts)
A) FHA, FSA/RHS & VA Home Purchase Loans
B) Conventional Home Purchase Loans
C) Refinancings
D) Home Improvement Loans
F) Non-occupant Loans on < 5 Family Dwellings (A B C & D)
Detailed PMIC statistics for the following Tracts:0308.00
, 0310.00
2002 - 2018 National Fire Incident Reporting System (NFIRS) incidents
According to the data from the years 2002 - 2018 the average number of fires per year is 12. The highest number of fires - 25 took place in 2016, and the least - 6 in 2006. The data has a growing trend.
When looking into fire subcategories, the most incidents belonged to: Structure Fires (71.1%), and Outside Fires (13.2%).
Fire incident types reported to NFIRS in Zip Code 13332


 Nearest zip codes: 13346, 13464, 13334, 13310, 13484, 13832.


 According to the data from the years 2002 - 2018 the average number of fires per year is 12. The highest number of fires - 25 took place in 2016, and the least - 6 in 2006. The data has a growing trend.
 When looking into fire subcategories, the most incidents belonged to: Structure Fires (71.1%), and Outside Fires (13.2%).